. 2025 Feb 26;12(2):241170.
doi: 10.1098/rsos.241170. eCollection 2025 Feb.

Both optical and rheological properties contribute to viscosity judgements when comparing real liquids using vision and touch

Affiliations

Both optical and rheological properties contribute to viscosity judgements when comparing real liquids using vision and touch

Jeffrey Martin et al. R Soc Open Sci. .

Abstract

Does the opacity of a liquid, or the way it reflects light, affect how viscous it appears? Would the perceived viscosity change if we touch the liquid? Viscosity of a material, or how it flows, produces a rich stimulus that reflects the material's rheological properties, which can be independently inferred by touch or vision, or by combining modalities. In addition, the material's optical properties convey other cues not dependent on rheology, such as colour or transparency. How these multisensory cues form stable percepts of viscosity that drive behaviour remains unknown. To shed light on this mapping, we conducted a series of psychophysical experiments in which observers compared the thickness of real liquids. First, we show that perceptual discrimination tends to scale in proportion to stimulus viscosity. Next, we show that optical properties such as transparency and opacity, although not related to viscosity, influence visual judgments of thickness. This bias, driven by appearance, is reduced when observers combine visual and haptic information. Combining information across visual and haptic senses improves discrimination only over a limited viscosity range.

Keywords: Weber fraction; haptic; perception; psychophysics; viscosity; visual.


Conflict of interest statement

We declare we have no competing interests.

Figures

Still frames taken from videos showing four representative comparisons from the visual tasks: low/ high viscosity for transparent and opaque liquids
Figure 1.
Still frames taken from videos showing four representative comparisons from the visual tasks: low/high viscosity for transparent and opaque liquids. Frames are taken at the point of maximum pump travel for the first of three successive pumps. Viscosity values are added for illustration and were not shown to participants during the discrimination task.
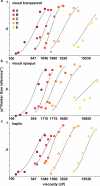
Psychometric curves plotted as the frequency of ‘thicker’ response vs.viscosity for groups A – E from table 3 for (a) task 1 a, transparent visua
Figure 2.
Psychometric curves plotted as the frequency of ‘thicker’ response versus viscosity for groups A–E from table 3 for (a) task 1a, visual transparent, (b) task 1b, visual opaque and (c) task 2, haptic modalities, on a logarithmic viscosity axis. Solid lines are fits of equation (2.2) with p set to true reference viscosity. Vertical lines denote the viscosity of the reference stimuli.
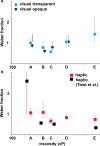
Weber fractions at reference viscosities for a) tasks 1 a and 1b, visual and b) task 2, haptic modalities
Figure 3.
Weber fractions at reference viscosities for (a) tasks 1a and 1b, visual and (b) task 2, haptic modalities. For comparison we also plot the results from Tiest et al. [10].
Subjective equivalent viscosity of transparent fluids vs. opaque reference fluids, task 1 c. For the visual modalit
Figure 4.
Subjective equivalent viscosity of transparent fluids versus opaque reference fluids, task 1c. For the visual modality, there exists a significant bias where transparent fluids are visually perceived to be much less viscous compared to opaque fluids of equal viscosity. Error bars indicate 95% bootstrap intervals.
Viscosities at 200 s−1 for 31 opaque and 13 transparent personal care products having identical or similar dispensing nozzles to the ones used in this work.
Figure 5.
Viscosities at 200 s−1 for 31 opaque and 13 transparent personal care products having identical or similar dispensing nozzles to the ones used in this work.
Weber fractions vs. reference viscosity. Comparison of visual-transparent and multimodal stimulus Weber fractions. Error bars indicate 95% bootstrap intervals.
Figure 6.
Weber fractions versus reference viscosity. Comparison of visual-transparent and multimodal stimulus Weber fractions. Error bars indicate 95% bootstrap intervals.

References

    1. Coppen FMV. 1942. The differential threshold for the subjective judgement of the elastic and plastic properties of soft bodies. Br. J. Psychol. Gen. Sect. 32, 231–247. (10.1111/j.2044-8295.1942.tb01022.x) - DOI
    1. Scott Blair G, Coppen FMV. 1939. The subjective judgement of the elastic and plastic properties of soft bodies; the ‘differential thresholds’ for viscosities and compression moduli. Proc. R. Soc. Lond. B 128, 109–125. (10.1098/rspb.1939.0046) - DOI
    1. Lederman SJ, Klatzky RL. 1987. Hand movements: A window into haptic object recognition. Cogn. Psychol. 19, 342–368. (10.1016/0010-0285(87)90008-9) - DOI - PubMed
    1. Bergmann Tiest WM. 2010. Tactual perception of material properties. Vis. Res. 50, 2775–2782. (10.1016/j.visres.2010.10.005) - DOI - PubMed
    1. Harper R, Stevens SS. 1964. Subjective Hardness of Compliant Materials. Q. J. Exp. Psychol. 16, 204–215. (10.1080/17470216408416370) - DOI

LinkOut - more resources