. 2025 Apr 1;152(7):dev204654.
doi: 10.1242/dev.204654. Epub 2025 Apr 10.

A Lgr5-independent developmental lineage is involved in mouse intestinal regeneration

Affiliations

A Lgr5-independent developmental lineage is involved in mouse intestinal regeneration

Maryam Marefati et al. Development. .

Abstract

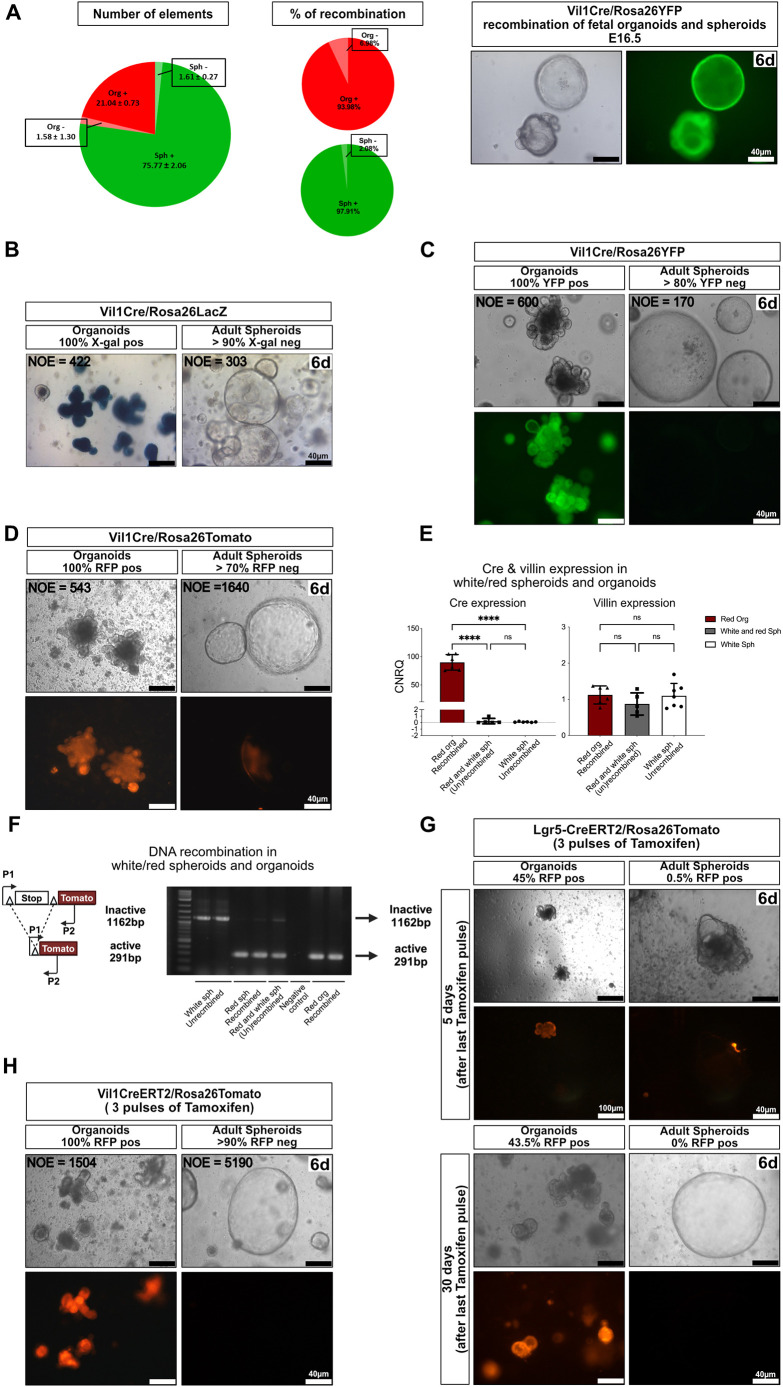
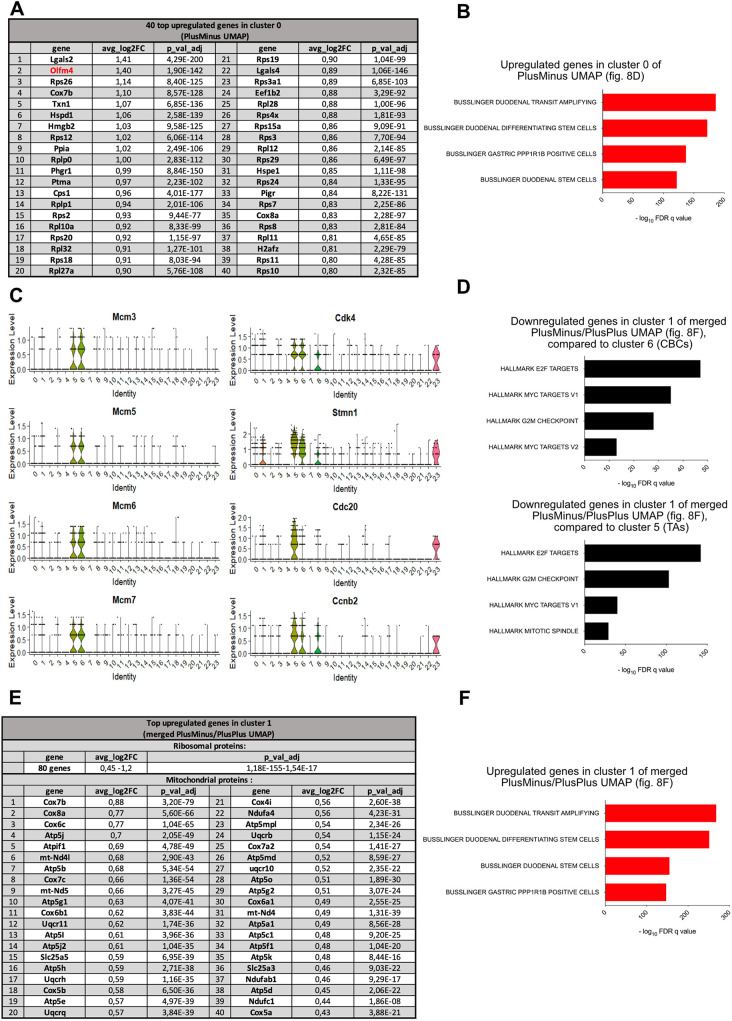
Collagenase and dispase treatment of intestinal tissue from adult mice generates cells growing in matrigel as stably replatable cystic spheroids, in addition to differentiated organoids. Contrary to classical EDTA-derived organoids, these spheroids display poor intestinal differentiation and grow independently of Rspondin, noggin and EGF. Their transcriptome strikingly resembles that of fetal intestinal spheroids, with downregulation of crypt base columnar cell (CBC) markers (Lgr5, Ascl2, Smoc2 and Olfm4). In addition, they display upregulation of inflammatory and mesenchymal genetic programs, together with robust expression of YAP target genes. Lineage tracing, cell-sorting and single cell RNA sequencing experiments demonstrate that adult spheroid-generating cells belong to a hitherto undescribed developmental lineage, independent of Lgr5-positive CBCs, and are involved in regeneration of the epithelium following CBC ablation.

Keywords: Intestinal development; Organoids; Regeneration; Stem cells.


Conflict of interest statement

Competing interests The authors declare no competing or financial interests.

Figures

Fig. 1.
Fig. 1.
Collagenase/dispase treatment of adult intestine releases spheroid-generating cells. (A) Treatment of intestinal tissue with collagenase/dispase releases cellular material growing as spheroids (black arrows) when cultured in 3D, in addition to minigut organoids (red arrows). (B) EDTA treatment of intestinal tissue (step 1) releases crypts growing only as organoids, whereas action of collagenase/dispase on the material remaining after EDTA treatment (step 2) generates only spheroids that can be serially replated free of mesenchyme. (C) EDTA-derived organoids in co-culture with intestinal mesenchymal cells or in the presence of medium conditioned by intestinal mesenchyme convert to a spheroid phenotype but revert to the organoid phenotype in the absence of mesenchyme influence. Scale bars: 100 µm. Labels in the upper right corner of each picture refer to the days after initiation of cultures. Schematics created in BioRender by Hadefi, A., 2025. https://BioRender.com/v53v026. Republished with permission.
Fig. 2.
Fig. 2.
Adult intestinal spheroids grow in the absence of EGF, noggin and Rspondin. (A) Fetal spheroids derived from E15.5 embryonic intestine rely on Rspondin for their growth in vitro (ENR versus EN). (B) Adult spheroids can be cultured in the presence of EGF, noggin and Rspondin (ENR) medium as well as of EN medium, but thrive better in plain medium devoid of growth factors (BCM). (C) The proportion of dark and clear spheroids at day 2 and day 6 after being in different culture media. Data are mean±s.e.m. (D) Lgr4KO spheroids derived from postnatal intestine (P15) grow normally and can be subcultured in BCM conditions. Scale bars: 100 µm.
Fig. 3.
Fig. 3.
Gene expression program of adult spheroids. (A) Volcano plot showing that, compared to organoids, adult spheroid transcripts display partial downregulation of markers representative of all five intestinal differentiated cell types; to allow pertinent comparison, spheroids and organoids were cultured in the same EGF, noggin and Rspondin (ENR)-containing medium. (B) Logarithmic plot showing reads per kilobase per million (RPKM) measured for adult spheroids and organoids; red dots indicate expression of genes illustrating the intestinal epithelial nature of spheroids. (C) Logarithmic plot showing RPKM for adult spheroids and organoids; red dots indicate expression of genes belonging to the intestinal mesenchymal gene signature by Li et al. (2007). (D) Immunofluorescence showing Trop2-Cdx2 and Trop2-Cdh17 expression on spheroids and organoids, confirming the intestinal origin of adult spheroids. Scale bars: 20 µm. (E) Pre-ranked gene set enrichment analysis (GSEA) showing positive correlation between adult spheroid upregulated genes (versus organoids) and matrisome signature described by Naba et al. (2012). (F) Volcano plot showing upregulation of an ‘adult tissue stem cell signature’ (red dots indicate 54 genes downregulated and 159 genes upregulated) (Wong et al., 2008) and downregulation of an ‘intestinal stem cell signature’ (black indicates 33 genes downregulated and 8 genes upregulated) (Haber et al., 2017) in adult spheroids, compared to organoids (total number of genes modulated with an FDR<0.05 is 3329). (G) Logarithmic plot showing RPKM for adult spheroids and organoids; dots indicate ‘+4’ (green) or CBC (red) stem cell markers; with the exception of prominin and CD44, CBC markers were downregulated and ‘+4’ markers were expressed at levels similar to those in organoids. (H) Volcano plot of adult spheroid versus organoid transcriptomes, showing upregulation of the vast majority of genes belonging to the fetal spheroid signature (red dots) (Fernandez et al., 2016). (I) Multidimensional scaling plot (MDS) displaying relatedness between adult intestinal spheroids (blue), fetal intestinal spheroids (green) and intestinal organoids (orange). (J-N) Pre-ranked GSEAs showing the following: positive correlation between adult spheroid upregulated genes (versus organoids) and the gene signature of Clu+ve ‘revival stem cells’ from irradiated intestine (J; Ayyaz et al., 2019), regenerating stomach (K; Fernandez et al., 2016), regenerating intestine induced by dextran sulphate sodium (DSS) treatment in a murine model of colitis (L; Yui et al., 2018), the intestine following helminthic infection (M; Nusse et al., 2018); and Yap/Taz gene expression signature (N; Gregorieff et al., 2015). ES, enrichment score; NES, normalized enrichment score.
Fig. 4.
Fig. 4.
Organoids and adult spheroids originate from separate developmental intestinal lineages. (A) Proportion of elements and percentages of recombined fetal organoids and spheroids from E16.5 Vil1Cre/Rosa26YFP mice (left); representative images (right) at day 6 of initial seeding (n=3). (B-D) Representative images showing absence of recombination in spheroids from Vil1Cre mice using Rosa26LacZ (n=2) (B), Rosa26YFP (n=7) (C) or Rosa26Tomato (n=4) (D) reporters 6 days after initial seeding. (E) qRT-PCR of Cre (expressed as CRNQ) and villin (expressed relative to level in organoids) measured in organoids and in Tom+ve (red/recombined) and Tom-ve (white/unrecombined) spheroids. Data are mean±s.e.m. ns, not significant; ****P<0.0001 (one-way ANOVA test with Tukey‘s multiple comparison tests). (F) PCR strategy targeting the Rosa26Tomato locus showing the absence of recombination in white spheroids prepared from Vil1Cre/Rosa26Tomato mice. (G) Absence of recombination in spheroids derived from Lgr5CreERT/Rosa26Tomato mice after three pulses of tamoxifen (n=2 for short chase; n=3 for long chase). (H) Absence of recombination in spheroids cultured from Vil1CreERT2/Rosa26Tomato mice after three pulses of tamoxifen (n=4). Scale bars: 40 µm; 100 µm in upper left images in G. Labels in the upper right corner of the images refer to the days after initiation of cultures. NOE, number of elements counted for each condition.
Fig. 5.
Fig. 5.
Regeneration of Mcl1-ablated intestine originates from cells escaping recombination triggered by VilCreERT2. (A) Schematic summary of the experiment. (B) Number of caspase 3-positive cells in crypt cells at various time after tamoxifen injection (n=3). **P=0.0028, ****P<0.0001 (two-way ANOVA test with Dunnett‘s multiple comparisons test). (C) Representative pictures of crypts with caspase 3-positive cells (WT-WT, wild-type mice; HE-HO, Vil1CreERT2 heterozygotes, homozygote for Mcl1fl/fl). (D) Representative images showing the yield of organoids (EDTA fraction panels) or spheroids (collagenase-dispase fraction panels) at various time points after tamoxifen administration. Cultures are shown 6 days after plating. (E) Quantification of spheroids and organoids per well, 24 h after tamoxifen injection; each symbol illustrates results from one mouse (n>4). Data are mean±s.e.m. ns indicates P>0.05, ***P<0.001 (two-way ANOVA test with Šídák's multiple comparisons). (F) Percentage of epithelial surface containing Mcl1fl/fl recombined cells, along the crypt-villus axis at various times after tamoxifen administration, n=2-7 mice (see also Fig. S5). Data are mean±s.e.m. (G) Representative images of intestinal epithelium showing Mcl1 RNAscope signals at various times after tamoxifen administration. Paradoxically, recombined cells show strong Mcl1-RNAscope signals (see text and Fig. S6). Scale bars: 40 μm in C; 100 μm in D and G. Schematics created in BioRender by Hadefi, A., 2025. https://BioRender.com/a95a941. Republished with permission.
Fig. 6.
Fig. 6.
Contribution of Vil1Cre-negative cells to epithelial regeneration after CBC ablation. (A) Schematic summary of the experiment. (B) Kinetics of weight loss of animals after diphtheria toxin (DT) treatment (n=6-8 mice in each group). ns indicates P>0.05, ***P<0.001, ****P<0.0001 (two-way ANOVA test with Dunnett‘s multiple comparisons test). (C) Immunofluorescence showing a RFP-negative (un-recombined) patch of epithelium in the small intestine of a Vil1Cre/Lgr5DTR/Rosa26Tomato mouse treated with DT. (D,E) Quantification of RFP-negative crypts in Swiss rolls from animals treated or not with diphtheria toxin. HE-WT-HE, VilCre/Rosa26Tomato double heterozygotes; HE-HE-HE, Vil1Cre/Lgr5DTR/Rosa26Tomato triple heterozygotes. The crypts appearing as ‘white’ after RFP immunohistochemistry (bottom row) are marked on the rolls (top row), counted and the results normalized to the length of the roll. Each symbol illustrates results from one animal (E); all samples were from mice euthanised at day 5 (see A). *P=0.0430, ****P<0.0001 (one-way ANOVA test with Tukey‘s multiple comparison tests). (F) Higher magnification showing presence of ‘white’ Paneth (red arrows) and goblet (green arrows) cells in un-recombined epithelium patches. (G) Immunofluorescence showing villin expression in villi (a) or crypts (b) of a RFP-negative (un-recombined) patch of epithelium in the small intestine of a Vil1Cre/Lgr5DTR/Rosa26Tomato mouse treated with DT. Scale bars: 50 µm in C, D (bottom row), F, G); 2.5 mm in D (top row). Schematics created in BioRender by Hadefi, A., 2025. https://BioRender.com/a95a941. Republished with permission.
Fig. 7.
Fig. 7.
Kinetics of un-recombined crypt generation following CBC ablation. (A) Schematic summary of the experiment. (B) Kinetics of un-recombined (white) crypt generation after a single injection of diphtheria toxin (DT). HE-HE-HE, Vil1Cre/Lgr5DTR/Rosa26Tomato triple heterozygotes; HE-WT-HE, Vil1Cre/Rosa26Tomato double heterozygotes. Each symbol illustrates results from one animal. Data are mean±s.e.m. ns indicates P>0.05, *P<0.02, **P<0.01, ****P<0.0001 (one-way ANOVA test with Tukey‘s multiple comparison tests). (C) Percentage of total or un-recombined (white) Clu-positive crypts by RNAscope in situ hybridization at different time points after one pulse (see A and B) or three pulses of tamoxifen (see Fig. 6A,E). Data are mean±s.e.m. ns indicates P>0.05, **P<0.01, ****P<0.0001 (one-way ANOVA test with Tukey‘s multiple comparison tests). (D) Representative images of intestinal epithelium showing the presence of Clu-positive cells in crypts after tamoxifen administration at different time points. (E) Representative image of intestinal epithelium showing the presence of Clu-positive cells (arrows) in red and white crypts. (F) Number of single Tomato-neg cells in 30 crypts in Vil1Cre/Rosa26Tomato double heterozygote mice; each symbol illustrates results from one mouse (n=6). Data are mean±s.e.m. (G) Representative images of immunofluorescence showing Tomato-neg single cells in crypts (arrows). Schematics created in BioRender by Hadefi, A, 2025. https://BioRender.com/q28z760. Republished with permission.
Fig. 8.
Fig. 8.
scRNAseq of Epcam-positive-Rosa26Tomato-positive (PlusPlus) and Epcam-positive-Rosa26Tomato-negative cells (PlusMinus). (A) Fluorescent sorting of PlusPlus cells (P4 window) and PlusMinus cells (P5 window). (B) UMAP representation of scRNAseq of 2154 PlusPlus cells showing 12 clusters identified by their differentially expressed genes (DEGs). (C) The same UMAP showing expression of Tdtomato, Olfm4, Defa24, Muc2, Sis and Chgb. (D) UMAP representation of scRNAseq of 2650 PlusMinus cells showing 10 clusters identified by their DEGs. (E) The same UMAP showing expression of Tdtomato, Olfm4, Clu, Spp1, Rnase1 and Muc6. (F) UMAP representations of similar number of cells from PlusPlus and PlusMinus samples after merging data analysis in Seurat, with indication of the cell types identified from their DEG lists. Olfm4-positive clusters are indicated by a dotted outline. (G) The same data displayed according to their PlusPlus or PlusMinus origin, with indication of overlapping contaminants (squares). (H) The same UMAP showing expression of Olfm4 and Mki67. (I) Violin plots showing expression level of canonical transcript of CBCs (Olfm4, Smoc2 and Slc12a2), +4 (Hopx) and the Wnt target genes Axin2 and Mki67 in all the clusters involved in merged data analysis.
Fig. 9.
Fig. 9.
Cells at the origin of the VilCre-negative lineage are quiescent Olfm4-positive cells. (A) Table showing 40 upregulated genes in cluster 0 of PlusMinus (Fig. 8D) sorted by log2 fold change. (B) GSEA MolSig results for biological cell types (C8) associated with the upregulated genes in cluster 0. (C) Expression levels of various genes implicated in cell cycle and mitosis across the merged datasets (Fig. 8F). (D) GSEA MolSig (hallmarks) results related to downregulated genes in cluster 1 of the combined PlusPlus and PlusMinus merged datasets (Fig. 8F), in comparison to cluster 6 (CBCs) and cluster 5 (TAs). (E) Table showing 40 upregulated genes in cluster 1 of merged datasets (Fig. 8F). (F) GSEA MolSig results for biological cell types (C8) associated with the upregulated genes in cluster 1 of the merged PlusPlus and PlusMinus datasets (Fig. 8F).

References

    1. Ayyaz, A., Kumar, S., Sangiorgi, B., Ghoshal, B., Gosio, J., Ouladan, S., Fink, M., Barutcu, S., Trcka, D., Shen, J.et al. (2019). Single-cell transcriptomes of the regenerating intestine reveal a revival stem cell. Nature 569, 121-125. 10.1038/s41586-019-1154-y - DOI - PubMed
    1. Bankaitis, E. D., Ha, A., Kuo, C. J. and Magness, S. T. (2018). Reserve stem cells in intestinal homeostasis and injury. Gastroenterology 155, 1348-1361. 10.1053/j.gastro.2018.08.016 - DOI - PMC - PubMed
    1. Barker, N., Van Es, J. H., Kuipers, J., Kujala, P., Van Den Born, M., Cozijnsen, M., Haegebarth, A., Korving, J., Begthel, H., Peters, P. J.et al. (2007). Identification of stem cells in small intestine and colon by marker gene Lgr5. Nature 449, 1003-1007. 10.1038/nature06196 - DOI - PubMed
    1. Baron, C. S. and Van Oudenaarden, A. (2019). Unravelling cellular relationships during development and regeneration using genetic lineage tracing. Nat. Rev. Mol. Cell Biol. 20, 753-765. 10.1038/s41580-019-0186-3 - DOI - PubMed
    1. Beumer, J. and Clevers, H. (2016). Regulation and plasticity of intestinal stem cells during homeostasis and regeneration. Development 143, 3639-3649. 10.1242/dev.133132 - DOI - PubMed

Substances

LinkOut - more resources