. 2025 Apr;12(16):e2416453.
doi: 10.1002/advs.202416453. Epub 2025 Feb 27.

Host Plasma Microenvironment in Immunometabolically Impaired HIV Infection Leads to Dysregulated Monocyte Function and Synaptic Transmission Ex Vivo

Affiliations

Host Plasma Microenvironment in Immunometabolically Impaired HIV Infection Leads to Dysregulated Monocyte Function and Synaptic Transmission Ex Vivo

Flora Mikaeloff et al. Adv Sci (Weinh). 2025 Apr.

Abstract

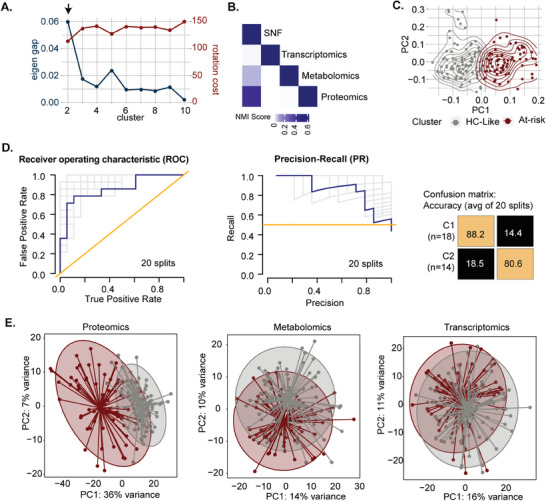
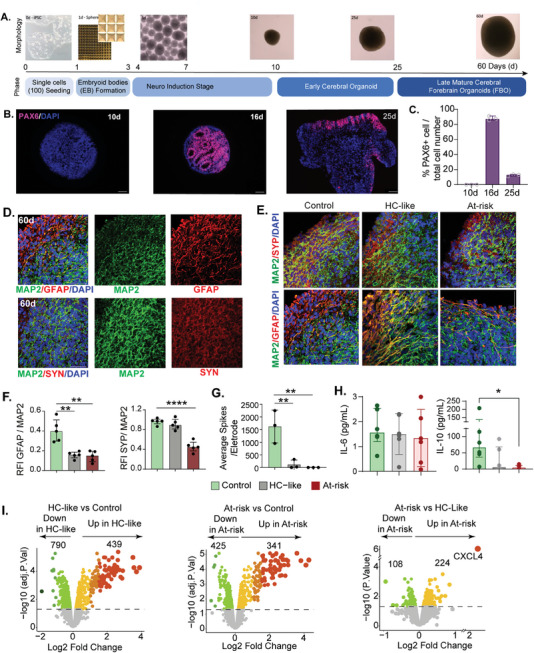
Risk stratification using multi-omics data deepens understanding of immunometabolism in successfully treated people with HIV (PWH) is inadequately explained. A personalized medicine approach integrating blood cell transcriptomics, plasma proteomics, and metabolomics is employed to identify the mechanisms of immunometabolic complications in prolonged treated PWH from the COCOMO cohort. Among the PWHs, 44% of PWH are at risk of experiencing immunometabolic complications identified using the network-based patient stratification method. Utilizing advanced machine learning techniques and a Bayesian classifier, five plasma protein biomarkers; Tubulin Folding Cofactor B (TBCB), Gamma-Glutamylcyclotransferase (GGCT), Taxilin Alpha (TXLNA), Pyridoxal Phosphate Binding Protein (PLPBP) and Large Tumor Suppressor Kinase 1 (LATS1) are identified as highly differentially abundant between healthy control (HC)-like and immunometabolically at-risk PWHs (all FDR<10-10). The personalized metabolic models predict metabolic perturbations, revealing disruptions in central carbon metabolic fluxes and host tryptophan metabolism in at-risk phenotype. Functional assays in primary cells and cortical forebrain organoids (FBOs) further validate this. Metabolic perturbations lead to persistent monocyte activation, thereby impairing their functions ex vivo. Furthermore, the chronic inflammatory plasma microenvironment contributes to synaptic dysregulation in FBOs. The endogenous plasma inflammatory microenvironment is responsible for chronic inflammation in treated immunometabolically complicated at-risk PWH who have a higher risk of cardiovascular and neuropsychiatric disorders.

Keywords: HIV/AIDS; Integrative omics; patient stratification; personalized metabolic models.


Conflict of interest statement

O'Mahony has served on speaker bureaus for Abbott, Nestlé, Nutricia, Reckitt and Yakult; received research funding from Chiesi and GSK; and acted as a consultant for PrecisionBiotics. MR is an Olink Proteomics, Boston, Massachusetts, United States employee. VP was an employee of Olink GmbH, Munich, DE, when the study was conducted and is presently Novo Nordisk, Denmark employee. RB was an employee at NBIS at the time of data analyses. RB is currently an employee of Chiesi Farmaceutici S.p.A. and does not hold Chiesi Farmaceutici S.p.A. stocks or equity shares. Chiesi Farmaceutici S.p.A. was not involved with the current study. Others none to declare.

Figures

Figure 1
Figure 1
Similarity network fusion‐based PWH stratification. A) Eigengap and rotation cost per number of clusters in SNF network. The cluster number is indicated by an arrow where maximal Eigen gap = 0.06 and minimum rotation cost = 117. B) Concordance matrix of NMIs between the fused network and every single omic network. Values in NMI (data set) are 0.4 (proteomics), 0.07 (metabolomics), and 0.008 (transcriptomics). C) The PCA of the fused network is segregated based on the cluster. Sample color is based on cluster. D) NetDx performance results in predicting SNF risk clusters based on omics data and clinical parameters. Receiver operating characteristic (ROC) curve (left), precision‐recall (PR) curve (middle), and an average of confusion matrices (right) for 20 data splits train/test. E) PCA of the individual omics to identify the heterogeneity of the clusters based on the single omic.
Figure 2
Figure 2
Identification of key molecules and pathways based on proteomics analysis. A) Volcano plot based on proteomics data analysis representing differential abundance between HC‐like and at‐risk clusters. Up‐regulated proteins are shown in red, while down‐regulated proteins are represented in blue. Inset pie chart representing the number of proteins per cell type differentially expressed compared to the other cell types in single‐cell transcriptomics data. B) The Cytoscape network was based on identifying over‐represented KEGG pathways associated with the metabolism based on proteins differing from at‐risk clusters. The node size is proportional to the number of proteins annotated with this pathway and color varies based on p‐value. C) Importance plot based on mean decrease accuracy from random forest model for the prediction of clusters based on proteomics data (Boruta, iterations = 1000, features = 1000). A confusion matrix is also displayed. D) Directed acyclic graph based on 187 most important proteins differing proteomics data at‐risk and HC‐like patients and top 5 proteins with the highest degree of influence (top of the graph) are labelled. E) Boxplots of driver proteins separated by groups. Color is based on cluster and condition (HC‐like = grey, at‐risk = red). P values are displayed for each comparison (LIMMA, FDR < 0.1 (*), FDR < 0.1 (**), FDR < 0.1 (***)). F) Co‐expression network after communities' detection based on transcriptomics, metabolomics, and proteomics. Features differing between HC‐like and at‐risk patients are colored red if upregulated or blue if downregulated. Driver genes identified by structural causal modeling are labeled. G) Heatmap based on senescence‐associated protein markers differing between HC‐like and at‐risk clusters of patients. The patient cluster is indicated above, and protein Fold Change and annotation to senescence databases are on the right. Data were Z‐score transformed. H) Pie chart representing the number of senescence‐associated proteins per cell type differentially expressed compared to the other cell types in single‐cell transcriptomics data.
Figure 3
Figure 3
Flow cytometry T‐cells and monocytes A) Dot plot showing the CD4+ and CD8+ T‐cells proportion of the CD3+ T‐cells and classical (CM), intermediate (IM), and non‐classical monocytes (NCM). P values are presented. B) Percentage of Glut1 positive cells on CD4+ T‐cells and CM and cystine/glutamate antiporter xCT positive cells on CD8 cells that were significant (< 0.05) None of the other receptors were statistically significant. C) Dot plot showing the expression of phenotypic and functional markers on memory CD4+ T cells stimulated in the presence of either HC‐like or at‐risk plasma. The stimulation index represents the fold change relative to the negative control. Only markers with modest expression across donors are shown. Gray lines connect paired samples. Friedman test. D) Pie charts depict activation markers' co‐expression on memory CD4+ and CD8+ T cells after incubation with HC‐like or at‐risk plasma. Permutation test. E) Pie charts depict co‐inhibitory and transcription factor marker co‐expression on memory CD4+ and CD8+ T cells after incubation with HC‐like or at‐risk plasma. Permutation test. F) Dot plot showing the expression of chemokine receptors (CCR2, CCR5, and CX3CR1), activation markers (CD38 and CD86), and expression of PDL1+ on monocytes after incubation with HC‐like (n = 10) or at‐risk (n = 10) plasma for 48 h with LPS stimulation (1 pg ml−1). The stimulation index represents the fold change relative to the negative control. G) Pie charts depict activation and co‐inhibitory markers' co‐expression of monocyte markers. H) Volcano plots show the differing proteins between monocytes treated with the pool of non‐homologous plasma from at‐risk (n = 10) PWH versus those treated with a pool of HC‐like (n = 10) PWH plasma for 48 h with LPS stimulation (1 pg ml−1). I) Measurement of IL‐6 and IL‐10 in the supernatant following differentiation of the MDM for seven days with GM‐CSF from HIV‐negative controls (n = 6), HC‐like (n = 12), and at‐risk (n = 12) PWH. J) Phagocytic functions were determined in MDM from HC‐like (n = 6) and at‐risk (n = 5) PWH.
Figure 4
Figure 4
Modelling metabolism at the system level. A) Workflow describing the generation of groups and individual Genome‐scale metabolic models (GSMM) and further applications. B) Heatmap representing fluxes identified by flux balance analysis in grouped GSMM (HC, HC‐like, and at‐risk). Fluxes specific to at‐risk are labeled yellow. C) Barplot showing at‐risk‐specific fluxes separated based on subsystems in HC‐like (left) and at‐risk (right) GSMM. Fluxes with different directions have been included. Flux with values <250 were excluded. D) Barplot of at‐risk specific transport reactions based on flux values in at‐risk GSMM. Equations are indicated on the right. E) Heatmap representing fluxes values for each patient differing between HC‐like at at‐risk at the individual level based on Fisher test. The patient cluster is indicated above. Metabolon super pathways are indicated on the right. F) Dotplot of metabolites differing HC‐like and At‐risk. Size is inversely proportional to FDR. Dots are ordered based on Metabolon super pathways and sub‐pathways. Color is dependent on super pathways. The horizontal line represents –log10(0.05). G) Boxplot showing the levels of metabolites in glutamate‐metabolism.
Figure 5
Figure 5
Neurological profiling and ex vivo assays in iPSCs differentiated functional cortical forebrain organoids A) Workflow for generating cortical forebrain organoids (FBOs) from human iPSC line with timeline. B) Representative confocal immunofluorescence images of human‐induced pluripotent stem cell‐derived cerebral organoids (COs) showing the expression of Paired Box 6 (PAX6) at 10, 16, and 25 days. C) A bar graph illustrating the percentage of PAX6‐positive cells in the CO at various time points during differentiation. D) Representative confocal immunofluorescence images of COs at 60 days demonstrating the presence of neurons (Microtubule Associated Protein 2, MAP2, green), astrocytes (Glial Fibrillary Acidic Protein, GFAP, red), and synapse (SYN, red) markers. E) Representative images of SYP (red) /MAP2(green) and GFAP(red)/MAP2(green) staining after the treatment of plasma from HC‐like and At‐risk. F) Quantitative analysis for SYP and GFAP expression normalized to MAP2 (n = 3). DAPI (blue) was used to visualize cell nuclei. G) 16‐electrode plates were used for Multi Electrode Array. MEA recordings, employing COs. Bar graph showing the average number of bursts per electrode across two‐month‐old FBOs maintained on MEAs from control and those treated by plasma from either HC‐like or At‐risk groups. One‐way ANOVA analyzed data sets with post hoc comparisons using Dunnett's multiple comparisons test compared to control samples. The stars above points represent Dunnett‐corrected post hoc tests. All data are presented as median (IQR) **p < 0.01; ***p < 0.001 ****p < 0.0001 versus control. H) Measurement of IL‐6 and IL‐10 in the supernatant exhibited by control (n = 6), HC‐like (n = 6), and At‐risk (n = 6) plasma‐treated FBOs. P‐value indicates Mann‐Whitney U test I) Volcano plots showing upregulated and down‐regulated proteins in iPSCs differentiated functional FBOs treated with HC‐like or at‐risk plasma. Scale bar = 50µm.
Figure 6
Figure 6
In vitro polyamines treatment in iPSCs differentiated functional cortical forebrain organoids. A) Volcano plots show the proteins differing between untreated monocytes and monocytes treated with spermidine B) Protein set enrichment analysis: Dotplots of pathways enriched in proteins differing untreated cells from cells treated with spermine and spermidine. The up‐regulation of pathways is indicated in red, and the down‐regulation in yellow. C) IL‐6, TNF‐a, and IL‐10 measurements in the supernatant. In the case of non‐detection, the lowest values for the respective kits were used. D) Venn diagram representing overlapping proteins between untreated cells and respective cells treated with spermidine and proteins differing cells treated with plasma from at‐risk patients. E) Representative images of SYP/MAP2 and GFAP/MAP2 staining after plasma treatment from HC‐like and at‐risk. In a quantitative analysis of SYP and GFAP expression normalized to MAP2, five random areas were selected to measure the fluorescence intensity. Scale bar =50µm.  F) The expression of TNFa and IL10 mRNA from cortical organoids from the control and SPD‐treated group (n = 3). G) Measurement of IL6 and IL10 in the supernatant. H) The average number of bursts per minute and electrode across two‐month‐old cortical organoids were maintained on MEAs treated with SPD or without any treatment. Data sets were analyzed by unpaired t‐tests. All data are presented as median (IQR) *p < 0.05; **p < 0.01; versus Control. I) Dot plot of KEGG pathways differing control organoids and organoids treated with spermidine. Val: Valine, Leu: Leucine, Ile: Isoleucine, Ala: Alanine, Asp: Aspartate, Glu: Glutamate.

References

    1. Mikaeloff F., Gelpi M., Benfeitas R., Knudsen A. D., Vestad B., Hogh J., Hov J. R., Benfield T., Murray D., Giske C. G., Mardinoglu A., Troseid M., Nielsen S. D., Neogi U., eLife 2023, 12, 82785. - PMC - PubMed
    1. a) Brunet‐Ratnasingham E., Dube M., Kaufmann D. E., Trends Mol. Med. 2019, 25, 1; - PubMed
    2. b) Ambikan A. T., Svensson‐Akusjärvi S., Krishnan S., Sperk M., Nowak P., Vesterbacka J., Sönnerborg A., Benfeitas R., Neogi U., Life Sci. Allia. 2022, 5, e202201405; - PMC - PubMed
    3. c) Mikaeloff F., Svensson Akusjarvi S., Ikomey G. M., Krishnan S., Sperk M., Gupta S., Magdaleno G. D. V., Escos A., Lyonga E., Okomo M. C., Tagne C. T., Babu H., Lorson C. L., Vegvari A., Banerjea A. C., Kele J., Hanna L. E., Singh K., de Magalhaes J. P., Benfeitas R., Neogi U., Commun. Biol. 2022, 5, 27. - PMC - PubMed
    1. Akusjarvi S. S., Neogi U., Curr. HIV/AIDS Rep. 2023, 20, 42. - PMC - PubMed
    1. a) Akusjarvi S. S., Ambikan A. T., Krishnan S., Gupta S., Sperk M., Vegvari A., Mikaeloff F., Healy K., Vesterbacka J., Nowak P., Sonnerborg A., Neogi U., iScience 2022, 25, 103607; - PMC - PubMed
    2. b) Salguero S., Brochado‐Kith O., Verdices A. V., Berenguer J., Gonzalez‐Garcia J., Martinez I., Diez C., Hontanon V., Perez‐Latorre L., Fernandez‐Rodriguez A., Jimenez‐Sousa M. A., Resino S., Biomed. Pharmacother.=Biomed. Pharmacother. 2023, 159, 114220; - PubMed
    3. c) Wedrychowski A., Martin H. A., Li Y., Telwatte S., Kadiyala G. N., Melberg M., Etemad B., Connick E., Jacobson J. M., Margolis D. M., Skiest D., Volberding P., Hecht F., Deeks S., Wong J. K., Li J. Z., Yukl S. A., J. Virol. 2023, 97, e0125422; - PMC - PubMed
    4. d) Wang S., Zhang Q., Hui H., Agrawal K., Karris M. A. Y., Rana T. M., Emerg. Microb. Infect. 2020, 9, 2333. - PMC - PubMed
    1. Gelpi M., Mikaeloff F., Knudsen A. D., Benfeitas R., Krishnan S., Svenssson Akusjärvi S., Høgh J., Murray D. D., Ullum H., Neogi U., Nielsen S. D., Aging 2021, 13, 22732. - PMC - PubMed

LinkOut - more resources