. 2025 Apr;12(16):e2415565.
doi: 10.1002/advs.202415565. Epub 2025 Feb 27.

Mannose-Glycated Metal-Phenolic Microcapsules Orchestrate Phenotype Switch of Macrophages for Boosting Tumor Immunotherapy

Affiliations

Mannose-Glycated Metal-Phenolic Microcapsules Orchestrate Phenotype Switch of Macrophages for Boosting Tumor Immunotherapy

Xin Tan et al. Adv Sci (Weinh). 2025 Apr.

Abstract

Microcapsules are advancing in immunotherapy, with both their core and shell being capable of loading immunoregulatory substances. Notably, microcapsules with intrinsic bioactivities can more directly modulate the immune microenvironment, while current research in this area remains scarce. Herein, immunomodulatory metal-phenolic microcapsules (mMPMs) is developed through the one-step assembly of dopamine-modified hyaluronic acid (HADA) and FeIII onto mannose-glycated bovine serum albumin microbubbles (Man-BSA MBs). Specifically, Man-BSA formed during the early stages of the Maillard reaction is sonicated to produce microbubbles as templates for capsule preparation. Subsequently, HADA is rapidly coated on the templates and coordinates with FeIII to form microcapsules after air escapes from MBs. Mass spectrometry analysis identifies abundant lysine glycation sites on Man-BSA, with the highest glycation site percentage reaching 94.88%. Man-BSA within mMPMs effectively promotes macrophage internalization, induces the accumulation of pro-inflammatory mediators, and thereby results in the M1 polarization of macrophages, as further corroborated by proteomic analysis. Consequently, the compelling anti-tumor effects of mMPMs are demonstrated both in vitro and in vivo. Overall, this work presents an immunomodulatory microcapsule that activates pro-inflammatory phenotype macrophages, which is a promising microcarrier to improve immunotherapeutic effects.

Keywords: M1 macrophage polarization; macrophage‐related immunotherapy; mannose‐glycated bovine serum albumin; metal‐phenolic microcapsules.


Conflict of interest statement

The authors declare no conflict of interest.

Figures

Scheme 1
Scheme 1
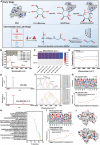
Preparation schematic of mMPMs and the mechanisms of mMPMs‐mediated M1 macrophage polarization and regulation of tumor cell death.
Figure 1
Figure 1
Preparation of mannose‐glycated BSA via the early stage of the Maillard reaction. A) A schematic representation of the early, intermediate, and late stages of the Maillard reaction between mannose and BSA, highlighting three key parameters influencing the reaction rate: temperature, time, and concentration. B) UV‐vis spectra of Man‐BSA (1:1) obtained at different heating times at 65 °C. The inset shows the macrographs of corresponding solutions. C) Heatmap illustrating the absorbance values at 294 and 420 nm for BSA and Man‐BSA (1:1) at different heating times at 65 °C. D) FTIR spectra of BSA MBs and Man‐BSA MBs (1:1). E) MALDI‐TOF mass spectrometry analysis of BSA MBs and Man‐BSA MBs (1:1). F) Curve‐fitting results of the FTIR spectra for BSA MBs and Man‐BSA MBs (1:1) in the region of the amide I band (1600–1700 cm⁻¹). G) Frequency logo and percentage of flanking residues surrounding all glycated sites identified in Man‐BSA MBs (1:1). H) The quantitative analysis of the top 20 sites exhibiting the highest levels of glycation in Man‐BSA MBs (1:1). The glycation sites are marked by the symbol *. I) Frequency logo and percentage of flanking residues surrounding most glycated sites (% glycation >66%) identified in Man‐BSA MBs (1:1). J) Surface diagram of native BSA (upper) and glycated BSA (below) [Protein Data Bank (PDB) ID: 4F5S]. The structure of BSA is shown in white, where lysine glycation sites and other glycation sites are colored red and blue, respectively. AGEs sites are indicated in brown.
Figure 2
Figure 2
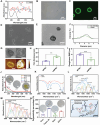
Synthesis of HADA and fabrication of mMPMs. A) UV‐vis spectra and chemical structure of the synthesized HADA. B) The optical image, C) CLSM image, D) SEM image, and E) TEM image of mMPMs. F) size distribution of Man‐BSA MBs and mMPMs. G) SEM and AFM images of MPMs and mMPMs (left: MPMs; right: mMPMs). The scale bars are 1 µm. H) Thickness (n = 3 capsules) and I) surface roughness (n = 5 capsules) of MPMs and mMPMs. J) UV‐vis spectra of HADA‐FeIII complex aqueous solution, mMPMs in MilliQ water, and in solutions with different pH (n = 3). The insets are representative optical images of the corresponding capsules at various pH values. Scale bars are 10 µm. K) The FTIR spectra of MPMs and mMPMs. L) Curve‐fitted FTIR spectra focusing on the amide I band region (1600–1700 cm⁻¹) of MPMs. M) Curve‐fitted FTIR spectra highlighting the amide I band region (1600–1700 cm⁻¹) of mMPMs. N) Degradability percentage of mMPMs in the presence of 100 mm of urea, Tween 20, NaCl, or EDTA as assessed by counting chamber (hemocytometer) (n = 3 samples). The insets are the representative optical images of the corresponding capsules after incubation with the indicated solution. Scale bars are 10 µm. O) The dominant stabilized interactions in mMPMs, including hydrophobic (blue oval), coordination (black dotted line), and intermolecular covalent interactions (blue solid line). The results are shown as the mean ± SD. **(p < 0.01) and ***(p < 0.001) determined using a two‐tailed Student's t‐test H and I).
Figure 3
Figure 3
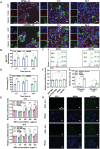
The interaction of mMPMs and macrophages in vitro. A) Confocal microscopy images of RAW 264.7 cells following exposure to MPMs or mMPMs for 2, 12, and 24 h. The microcapsules are stained with FITC (green), while cell nuclei and cytoskeleton are visualized in blue (DAPI) and red (Actin‐Tracker Red), respectively. White arrows indicate the capsules internalized by the cells. B) Intracellular mean fluorescence intensity (MFI) derived from 3 independent experiments (n = 3 independent experimental units (EUs)). C) Flow cytometry assessment of RAW 264.7 cells treated with 200 µg mL−1 MPMs and mMPMs for 2, 12, and 24 h. D) Quantitative evaluation of the flow cytometry data (n = 3 independent EUs). E) Relative cell proliferation levels of RAW 264.7 cells treated with BSA MBs, Man‐BSA MBs, MPMs, or mMPMs at the concentration of 0 to 400 µg mL−1 for 24 or 48 h (n = 5 independent EUs). F) Relative cell proliferation levels of RAW 264.7 cells treated with BSA MBs, Man‐BSA MBs, MPMs, or mMPMs at the concentration of 200 µg mL−1 for 72 h (n = 5 independent EUs). G) Quantitative analysis of ROS staining in macrophages (n = 5 independent EUs). H) Representative images of ROS staining in macrophages treated with MPMs or mMPMs at the concentration of 200 µg mL−1 for 24 or 48 h. The untreated cell was set as a NTC. The results are shown as the mean ± SD. ns (p > 0.05); *(p < 0.05); **(p < 0.01); ***(p < 0.001); and ****(p < 0.0001) determined using the Student's t‐test B and D), one‐way ANOVA with Tukey's post hoc test E and G) and Kruskal‐Wallis test F).
Figure 4
Figure 4
Biological effects of mMPMs on macrophages in vitro. A) Relative gene expressions of CCR7, iNOS, TNF‐α, IL‐10, CD206, and ARG‐1 in RAW 264.7 cells treated with 200 µg mL−1 MPMs or mMPMs for 48 h (n = 3 independent EUs). B) Representative images of immunofluorescence staining for iNOS, ARG‐1, and CD206 in RAW 264.7 cells after LPS, MPMs or mMPMs treatment for 48 h. Scale bars = 20 µm. C) Quantitative analysis of immunofluorescence staining for iNOS, ARG‐1, and CD206 (n = 3 independent EUs). D) Expression levels of TNF‐α in RAW 264.7 cells treated with LPS, MPMs or mMPMs analyzed by ELISA (n = 3 independent EUs). The untreated cell was set as a NTC, and the LPS‐stimulated one was set as a PTC. E) Representative flow cytometry analysis and corresponding quantification of the number of M1 (CD86+) and M2 (CD206+) macrophages after different treatments in vitro (n = 3 independent EUs). The results are shown as the mean ± SD. *(p < 0.05); **(p < 0.01); ***(p < 0.001); and ****(p < 0.0001) determined using one‐way ANOVA with Tukey's post hoc test (A, C: iNOS and CD206, and D) and Kruskal‐Waillis test (A and C: ARG‐1; E).
Figure 5
Figure 5
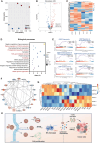
The altered cellular responses and its underlying mechanisms in macrophages treated with mMPMs via global proteomic analysis. A) PCA plot of proteomic data in the two groups (n = 3 independent EUs). B) Volcano plot of all protein expressions in MPMs versus mMPMs. C) Heatmap of all DEPs in two groups after cluster analysis. D) Top GO terms in BP significantly enriched from all DEPs (mMPMs vs MPMs). E) GSEA plots associated with phagocytosis, NO metabolic and ROS biosynthetic process, chemotaxis and cytokine, and T cell activation (mMPMs vs MPMs). F) Protein interaction network of the top 20 DEPs (mMPMs vs MPMs). G) Protein expression of immune response‐related proteins from proteomic profiles (mMPMs vs MPMs). H) The proposed mechanisms of mMPMs‐mediated macrophage M1 polarization and anti‐tumor growth. The diagram was created using BioRender (https://biorender.com/).
Figure 6
Figure 6
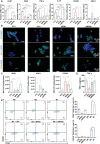
Evaluation of mMPMs‐mediated anti‐tumor effects in vitro. A) Illustrative diagram outlining the procedures for examining the impact of paracrine signals from mMPMs or MPMs‐activated macrophages on tumor cell proliferation. B) Cell viability of B16 cells treated with control and the paracrine signals from MPMs or mMPMs‐activated macrophage for 24, 48, and 72 h (n = 5 independent EUs). C) Cell viability of 4T1 cells treated with control and the paracrine signals from MPMs or mMPMs‐activated macrophage for 24, 48, and 72 h (n = 5 independent EUs). D) Quantification of dead 4T1 cells from live/dead staining images (n = 5 independent EUs). E) Quantification of dead B16 cells from live/dead staining images (n = 5 independent EUs). F) Representative live/dead staining images of 4T1 and B16 cells incubated with normal cell culture medium (control) and medium containing paracrine signals from MPMs and mMPMs‐activated macrophage for 24, 48, and 72 h. Scale bars are 100 µm. The results are shown as the mean ± SD. *(p < 0.05); **(p < 0.01); ***(p < 0.001); and ****(p < 0.0001) determined using one‐way ANOVA with Tukey's post hoc test B–E).
Figure 7
Figure 7
Evaluation of mMPMs‐mediated anti‐tumor effects in vivo. A) Illustration depicting the treatment protocol for 4T1 tumor‐bearing mice. B) The tumor growth curves of mice in the control group. C) The tumor growth curves of mice in mMPMs group. D) The average tumor growth curve for both groups of mice (n = 5 biological replicates). E) The tumor weight in control and mMPMs groups after treatment (n = 5 biological replicates). F) The body weight of mice in control and mMPMs groups during treatment (n = 3 biological replicates). G) H&E and H) TUNEL staining of tumor tissues from mMPMs and control groups at the end of treatment. I) Representative flow cytometry analysis and J) corresponding quantification of M1 (CD86+) and M2 (CD206+) macrophages in tumors (n = 3 biological replicates). K,L) The flow cytometric gating strategy and corresponding quantification of CD4+ and CD8+ T cells in tumors (n = 3 biological replicates). M) The representative images of the CD8+ (red) and CD4+ (green) immunofluorescence staining outcomes on tumor tissue sections from 4T1 tumor‐bearing mice sacrificed on day 22 post either PBS (control) or mMPMs treatment. Scale bars are 50 µm. N) H&E‐stained histological sections of lung tissue from the control and mMPMs groups. Enlarged images highlight areas of tumor metastasis. Scale bars of the top row and bottom row are 500 and 100 µm, respectively. The results are shown as the mean ± SD. ns (p > 0.05); *(p < 0.05); and ***(p < 0.001) determined using the two‐tailed Student's t‐test E, J, and K).

References

    1. Li L., Puhl S., Meinel L., Germershaus O., Biomaterials 2014, 35, 7929. - PubMed
    1. Huang P., Wang X., Liang X., Yang J., Zhang C., Kong D., Wang W., Acta Biomater. 2019, 85, 1. - PubMed
    1. Zhao X., Fan Z., Zhu C., Zhang W., Qin L., Mater. Today Bio 2023, 21, 100711. - PMC - PubMed
    1. Xi X., Ye T., Wang S., Na X., Wang J., Qing S., Gao X., Wang C., Li F., Wei W., Ma G., Sci. Adv. 2020, 6, eaay7735. - PMC - PubMed
    1. De Temmerman M., Rejman J., Lucas B., Vandenbroucke R. E., Libert C., Demeester J., De Smedt S. C., Adv. Funct. Mater. 2012, 22, 4236.

LinkOut - more resources