. 2025 Feb 27;135(8):e182417.
doi: 10.1172/JCI182417. eCollection 2025 Apr 15.

Identification of potent biparatopic antibodies targeting FGFR2 fusion-driven cholangiocarcinoma

Affiliations

Identification of potent biparatopic antibodies targeting FGFR2 fusion-driven cholangiocarcinoma

Saireudee Chaturantabut et al. J Clin Invest. .

Abstract

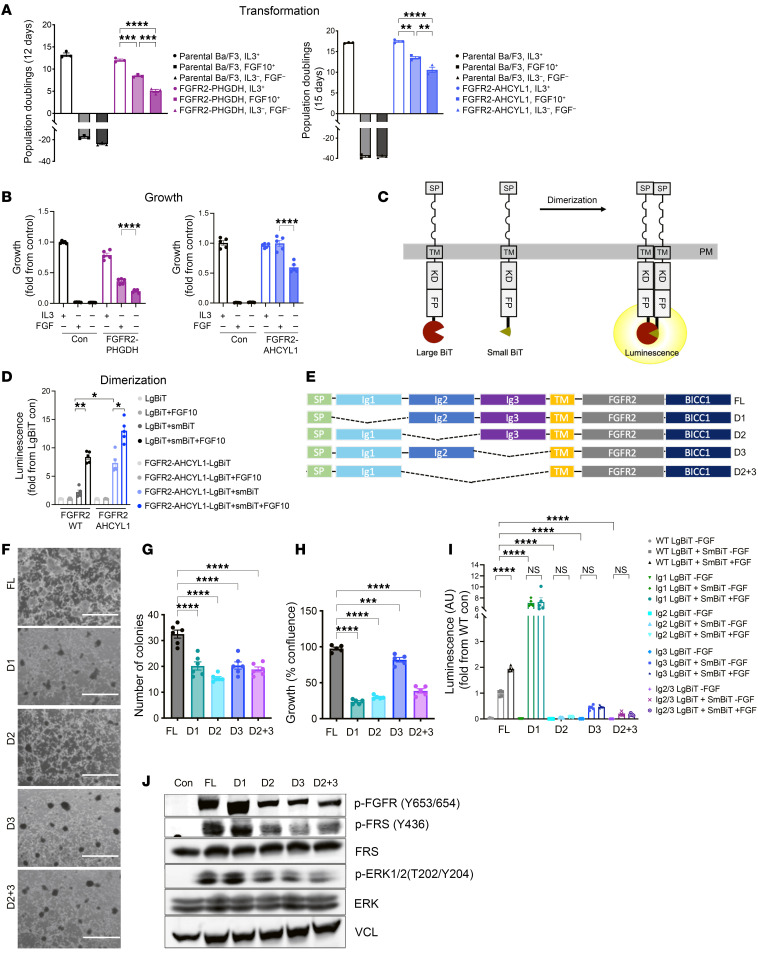
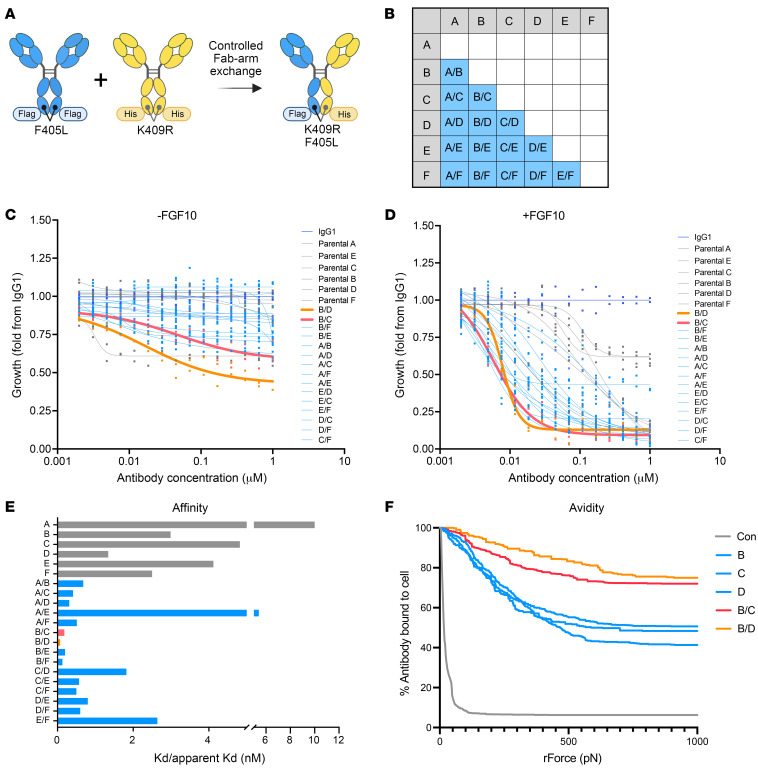
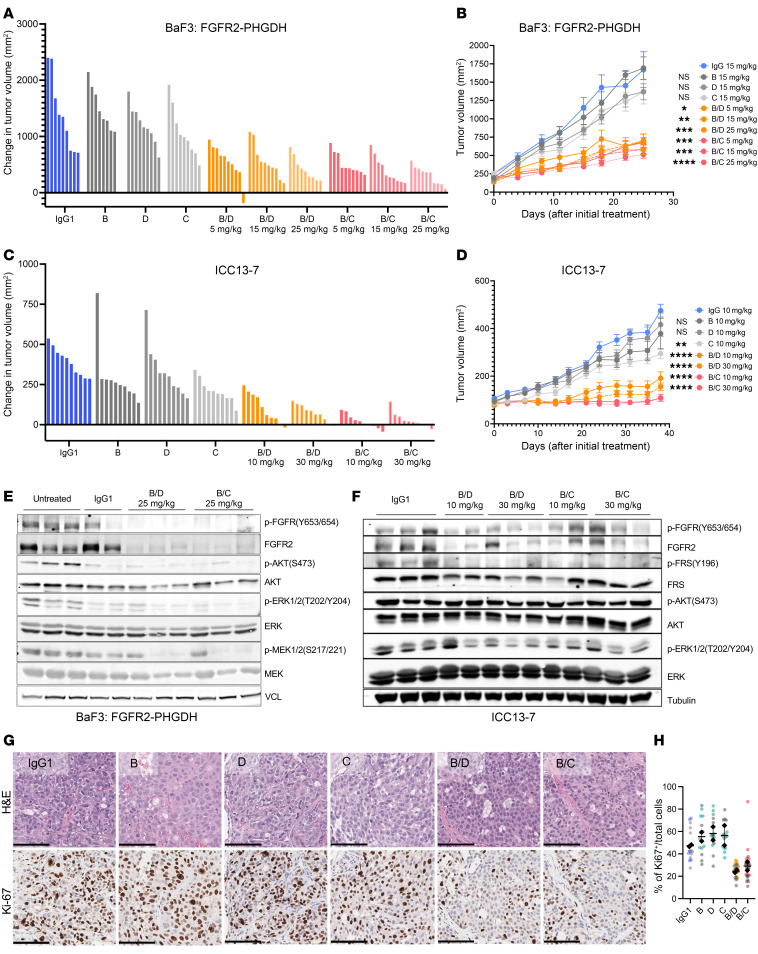
Translocations involving FGFR2 gene fusions are common in cholangiocarcinoma and predict response to FGFR kinase inhibitors. However, response rates and durability are limited due to the emergence of resistance, typically involving FGFR2 kinase domain mutations, and to suboptimal dosing, relating to drug adverse effects. Here, we develop biparatopic antibodies targeting the FGFR2 extracellular domain (ECD) as candidate therapeutics. Biparatopic antibodies can overcome drawbacks of bivalent monospecific antibodies, which often show poor inhibitory or even agonist activity against oncogenic receptors. We show that oncogenic transformation by FGFR2 fusions requires an intact ECD. Moreover, by systematically generating biparatopic antibodies targeting distinct epitope pairs in FGFR2 ECD, we identified antibodies that effectively block signaling and malignant growth driven by FGFR2 fusions. Importantly, these antibodies demonstrate efficacy in vivo, synergy with FGFR inhibitors, and activity against FGFR2 fusions harboring kinase domain mutations. Thus, we believe that biparatopic antibodies may serve as an innovative treatment option for patients with FGFR2-altered cholangiocarcinoma.

Keywords: Drug therapy; Liver cancer; Oncology; Signal transduction; Therapeutics.


Conflict of interest statement

Conflict of interest: SC received research funding from Ridgeline Discovery. AS is an employee of Ridgeline Discovery. LC is an employee of Cure Ventures; was an employee of 5AM Ventures and Flagship Pioneering. NB has research agreements with Tyra Biosciences, Servier Laboratories, and Kinnate Biopharma. WRS received research fundings from Bayer, Calico, Pfizer, Merck, Ideaya, Novartis Pharmaceuticals, Boehringer-lngelheim, Ridgeline Discovery, and Bristol-Myers Squibb; and is or was an advisory board member for Epidarex Capital, Ideaya, Pierre Fabre; 2Seventy Bio; and a founder for Red Ridge Bio and Delphia Therapeutics. SC and WRS are inventors on US Patent application 63/033,975 covering biparatopic antibodies targeting FGFR2.

Figures

Figure 1
Figure 1. The extracellular domain is necessary for full transformation by FGFR2 fusions.
(A) Transformation assays showing cumulative population doublings in BaF3 cells expressing FGFR2-PHGDH (12 days) and FGFR2-AHCYL1 (15 days) with or without FGF10 (100 ng/mL) or IL-3 (10 ng/mL), as indicated (n = 3). (B) Growth of BaF3 cells expressing FGFR2-PHGDH and FGFR2-AHCYL1 analyzed by CellTiter-Glo at 5 days after IL-3 removal (n = 5). (C) Illustration of the dimerization assay using FGFR2-fusion NanoBiT constructs. Large BiT and Small BiT subunits are fused to the C-terminus of FGFR2 fusions. SP, signal peptide; TM, transmembrane; KD, kinase domain; FP, fusion partner;PM, plasma membrane. (D) HEK-293T cells expressing FGFR2-WT and FGFR2-AHCYL1 fused to LgBiT alone or fused to LgBiT and SmBiT were used to quantify the receptor dimerization in the presence or absence of FGF10. Shown is the fold increase over FGFR2-LgBiT activity alone (n = 5). (E) Illustration of FGFR2-BICC1 constructs with D1 (Ig1), D2 (Ig2), D3 (Ig3), or D2+D3 (Ig2+Ig3) deletions in the ECD. (F) Representative images of focus formation assays of NIH-3T3 cells expressing FGFR2 WT or the indicated ECD deletion variants. Scale bar: 250 μm. (G) Quantification of number of colonies from F (n = 6). (H) Growth of NIH3T3 cells overexpressing FL, D1, D2, D3, and D2+3–deleted FGFR2-BICC1 constructs as measured by Incucyte at 5 days after plating (n = 5). (I) Dimerization of FGFR2-BICC1 D1, D2, D3, or D2+D3 ECD–deleted constructs in HEK-293T cells compared with full-length FGFR2-BICC1. Fold change in luminescence over FGFR2-WT–LgBiT is shown (n = 5). (J) Immunoblotting of FGFR2 downstream pathway effectors in HEK-293 cells expressing FGFR2-BICC1 ECD deletion constructs. All data are mean ± SEM. Data are representative of 1 out of 3 independent experiments. *P < 0.05, **P < 0.01, ***P < 0.001, ****P < 0.0001 by 1-way ANOVA multiple comparisons.
Figure 2
Figure 2. Development of candidate biparatopic antibodies directed against FGFR2.
(A) Anti-FGFR2 antibodies (Ab-A, Ab-B, Ab-C, Ab-D, Ab-E, and Ab-F) binding to SNU16 cells (FGFR2 amplification) by flow cytometry and their associated apparent Kd values. Anti-hIgG1-FITC secondary antibody was used to detect FGFR2 parental antibodies A–F (n = 3). (B) Flow cytometry analysis using anti-hIgG1-FITC secondary antibody to detect FGFR2 parental antibodies A–F. Binding epitopes of parental antibodies A–F along the FGFR2 ECD were identified using full-length, D1, D2, D3, and D2+3–deleted FGFR2-BICC1 overexpressing NIH3T3 cell lines shown in Figure 1. (C) Epitope binning through cross competition assay. BLI-Octet Epitope clustering diagrams showing cluster dendrogram with au (approximately unbiased) P values and bp (bootstrap probability) value (%). Distance represents correlations and cluster method is average. (D) α-fold predicted structure of FGFR2 ECD showing D1, D2, D3, and D1-D2 flexible linker as well as 6 FGFR2 parental antibody binding epitopes A–F. (E and F) Viability of FGFR2-PHGDH–overexpressing BaF3 cells upon treatment with increasing concentrations of antibody A–F in the presence or absence of FGF10 ligand (n = 9). All data are mean ± SEM. Data are representative of 1 out of 2 independent experiments. *P < 0.05, **P < 0.01, ***P < 0.001, ****P < 0.0001 by 1-way ANOVA multiple comparisons.
Figure 3
Figure 3. Identification of potent tumor growth–inhibiting biparatopic antibodies via unbiased screening.
(A) Illustrations showing strategy for biparatopic antibody generation. (B) A diagram showing all 15 possible biparatopic antibody pairs that were generated from 6 parental antibodies A–F. (C and D) Viability of FGFR2-AHCYL1 overexpressing BaF3 cells upon treatment with IgG1, biparatopic antibodies, and their parental antibodies in the absence (C) and presence of FGF10 (D) (n = 2). Data are representative of 1 out of 2 independent experiments. (E) Binding affinities (Kd, nM) of parental antibodies (gray) compared with biparatopic antibodies (blue) from MSD-SET assay. Biparatopic antibodies bpAb-B/D and bpAb-B/C showed apparent binding affinities (apparent Kd) of 0.07 nM (orange bar) and 0.18 nM (pink bar), respectively (n = 2). Data are representative of 1 independent experiment. (F) Representative binding curves illustrating the binding avidity between FGFR2-PHGDH expressing NIH3T3 cells and antibody B, D, C or biparatopic antibody bpAb-B/C and bpAb-B/D via acoustic force spectroscopy (n = 4–6). Data are representative of 1 independent experiment.
Figure 4
Figure 4. Biparatopic antibodies show superior inhibition of growth and transformation of a FGFR2 fusion–driven cholangiocarcinoma cell line.
(AC) Viability of cholangiocarcinoma cell line ICC13-7 or ICC21 upon treatment with biparatopic antibodies bpAb-B/C, bpAb-B/D, parental antibodies B, D, C, or IgG1 isotype in the absence (A and C) or presence (B and C) of FGF10 at 14 days after seeding (n = 3). (D and E) Proteome profiler human phospho-kinase array demonstrating levels of 43 phosphorylated human kinases in NIH3T3 cells overexpressing FGFR2-PHGDH treated with IgG1, bpAb-B/C, or bpAb-B/D for 5 hours (D). (E) Quantification of levels of p-FGFR1, p-FGFR2, p-FGFR3, and p-FGFR4 (white boxes) (n = 2). (F) Viability of CCLP-1 cells upon treatment with biparatopic antibodies bpAb-B/C, bpAb-B/D, parental antibodies B, D, C, or IgG1 isotype control (n = 3). (G and H) Immunoblot of ICC13-7 cells upon 5 hours after treatments with bpAb-B/C, or bpAb-B/D compared to the parental antibodies B, D, C in the absence (G) or presence (H) of FGF10 ligand. (I and J) Representative images of focus formation assays of FGFR2-PHGDH–expressing NIH3T3 cells upon treatments with parental antibodies B, D, C, biparatopic antibodies bpAb-B/C and bpAb-B/D, or IgG1 (I) as quantified by the number of colonies (J) (n = 3). Scale bar: 1000 μm. All data are mean ± SEM. Data are representative of 1 out of 2 independent experiments. *P < 0.05, **P < 0.01, ***P < 0.001, ****P < 0.0001 by 1-way ANOVA multiple comparisons.
Figure 5
Figure 5. Biparatopic antibodies show superior in vivo antitumor activity compared with the parental antibodies.
(AD) Tumors of BALB/c scid mice (n = 10 per group) harboring BaF3 cells overexpressing FGFR2-PHGDH (A and B) or ICC13-7 (C and D) subcutaneous xenografts treated with parental and biparatopic antibodies. Results are represented in the waterfall plot illustrating changes in tumor volume at day 25 (A and B) or day 38 (C and D) after initial treatment (A and C) and as geometric mean of tumor volumes ± SEM every 3–4 days from days 0–25 after initial treatment (B and D). Data are mean ± SEM across 10 mice. *P < 0.05, **P < 0.01, ***P < 0.001, ****P < 0.0001 by Friedman’s ANOVA multiple comparisons. (E) Immunoblot analysis of FGFR2-PHGDH–overexpressing BaF3 cells xenograft tumors harvested 5 hours after the final round of bpAb-B/C, bpAb-B/D, or IgG1 administration at 25 days after initial treatment. (F) Immunoblot analysis of ICC13-7 xenograft tumors collected 5 hours after the final round of antibody administration on day 38 after initial treatment. (G) Representative images of H&E and IHC staining for proliferation marker Ki-67 in ICC13-7 xenograft tumor samples on the final day of treatment. Scale bars, 100 μm. (H) Quantification of the percent of Ki-67–positive nuclei normalized to the total number of nuclei (nuclei counterstain). Data are from 2 biological replicates per treatment group with at least 14 representative images for analysis per group. Data are presented in a superplot where each color represents data points from the same biological sample. Black dots indicate the average values for each biological sample, while black lines represent the overall average for all data points. All data are mean ± SEM. One independent experiment was performed.
Figure 6
Figure 6. The biparatopic antibodies promote receptor internalization and lysosomal degradation.
(A) Flow cytometry histograms of surface FGFR2-PHGDH in BaF3 cells at 4°C (blue) and 37°C (red) upon treatment with bpAb-B/C or bpAb-B/D from 60–960 minutes. (B) Quantification of the histograms demonstrating the percentage of internalized FGFR2 at 60, 120, 180, 240, and 960 minutes after bpAb-B/C or bpAb-B/D incubation. (C) Quantification of histograms showing percent internalized FGFR2 in ICC13-7 cell line at 4°C and 37°C after 5 hours of treatment with parental antibody B, D, C or biparatopic antibodies bpAb-B/C or bpAb-B/D (n = 3). Data are mean ± SEM. *P < 0.05, **P < 0.01, ***P < 0.001, ****P < 0.0001 by 1-way ANOVA multiple comparisons. Data are representative of 1 out of 2 independent experiments. (D) Illustrations of Fabfluor-pH antibody labeling assay. The pH sensitive dye-based system exploits the acidic environment of the lysosomes to quantify internalization of the labeled antibody. Fluorescent signals that indicate the internalization/degradation events were tracked using Incucyte. (E) Representative images of detected fluorophore in NIH3T3 cells expressing FGFR2-PHGDH treated with parental antibody B, D, C, or biparatopic antibody bpAb-B/C and bpAb-B/D at 15 hours after incubation. Scale bars: 300 μm. (FH) Quantification of internalization/degradation signals in FGFR2-AHCYL1 (F), FGFR2-BICC1 (G), and FGFR2-PHGDH (H) expressing NIH3T3 cells treated with parental antibodies B, D, C, or biparatopic antibody bpAb-B/C and bpAb-B/D from 24 hours after incubation. Data are representative of 1 out of 2 independent experiments. (I) Quantification of internalization/degradation signals in ICC13-7 cells treated with parental antibodies B, D, C, or biparatopic antibody bpAb-B/C and bpAb-B/D at 4 hours after incubation. Data are representative of 1 out of 2 independent experiments. (J) Immunoblot of ICC13-7 cells treated with IgG1, bpAb-B/C,or bpAb-B/D antibodies alone or cotreated with bafilomycin A1 (BafA1) for 24 hours. BafA1 was preincubated for 1 hour prior to antibody treatments. Data are representative of 1 independent experiment.
Figure 7
Figure 7. Combinations of biparatopic antibodies with FGFR inhibitors.
(A and B) Biparatopic antibody B/D (A) or B/C (B) with Infigratinib, Futibatinib, or Pemigatinib combination dose response matrices in the presence of absence of FGF10. 1 = 100% viability and 0= 0% viability after indicated treatment. (C) Heatmap showing Bliss scores calculated from dose response matrices using SynergyFinder (39) application for drug combination analysis. (D and E) Viability of NIH3T3 cells stably expressed FGFR2-AHCYL1 with V565I or V565F mutations treated with bpAb-B/D, bpAb-B/C, or IgG1 (n = 3). (F) Immunoblot analysis of NIH3T3 cells stably expressing FGFR2-AHCYL1 with V565I or V565F treatment with bpAb-B/D, bpAb-B/C, or IgG1 for 5 hours (n = 3). (G and H) Quantification of internalization/degradation signals in FGFR2-AHCYL1 with V565I or V565F–expressing NIH3T3 cells treated with biparatopic antibody bpAb-B/C, bpAb-B/D, or IgG1 from 0–38 hours after incubation. (I) Viability of CCLP-1 cells stably expressed FGFR2–PHGDH fusion with V565F mutation upon treatment with IgG1, bpAb-B/D, or bpAb-B/C alone or in combination with Infigratinib (percentage compared with IgG1 treated control) (n = 3). (J) Immunoblot analysis of CCLP-1 cell line expressing FGFR2-PHGDH with V565F mutation upon treatment with IgG1, bpAb-B/C, bpAb-B/D, IgG1+Infigratinib, bpAb-B/C + Infigratinib, or bpAb-B/D + Infigratinib for 5 hours. (K) Deletion mutations derived from 4 different patients and the respective FGFR2 ECD. (L) Viability of 4 patient-derived N-terminus oncogenic mutants upon treatments with IgG1, bpAb-B/C, or bpAb-B/D as indicated (percentage viability compared with IgG1) (n = 3). (M) Immunoblot of NIH-3T3 cells bearing an FGFR2 H167_N173 in-frame deletion allele (patient 2) after treatment with IgG, bpAb-B/C, bpAb-B/D, or the relevant parental antibodies for 5 hours. All data are mean ± SEM. Data are representative of 2 independent experiments. *P < 0.05, **P < 0.01, ***P < 0.001, ****P < 0.0001 by 1-way ANOVA with multiple comparisons.

Update of

References

    1. Borad MJ, et al. Fibroblast growth factor receptor 2 fusions as a target for treating cholangiocarcinoma. Curr Opin Gastroenterol. 2015;31(3):264–268. doi: 10.1097/MOG.0000000000000171. - DOI - PMC - PubMed
    1. Arai Y, et al. Fibroblast growth factor receptor 2 tyrosine kinase fusions define a unique molecular subtype of cholangiocarcinoma. Hepatology. 2014;59(4):1427–1434. doi: 10.1002/hep.26890. - DOI - PubMed
    1. Goyal L, et al. TAS-120 overcomes resistance to ATP-competitive FGFR inhibitors in patients with FGFR2 fusion-positive intrahepatic cholangiocarcinoma. Cancer Discov. 2019;9(8):1064–1079. doi: 10.1158/2159-8290.CD-19-0182. - DOI - PMC - PubMed
    1. Goyal L, et al. Futibatinib for FGFR2-rearranged intrahepatic cholangiocarcinoma. N Engl J Med. 2023;388(3):228–239. doi: 10.1056/NEJMoa2206834. - DOI - PubMed
    1. Chen L, et al. Fibroblast growth factor receptor fusions in cancer: opportunities and challenges. J Exp Clin Cancer Res. 2021;40(1):345. doi: 10.1186/s13046-021-02156-6. - DOI - PMC - PubMed

MeSH terms

Substances