. 2025 Feb 27;135(8):e189801.
doi: 10.1172/JCI189801. eCollection 2025 Apr 15.

Megakaryocytes transfer mitochondria to bone marrow mesenchymal stromal cells to lower platelet activation

Affiliations

Megakaryocytes transfer mitochondria to bone marrow mesenchymal stromal cells to lower platelet activation

Chengjie Gao et al. J Clin Invest. .

Abstract

Newly produced platelets acquire a low activation state, but whether the megakaryocyte plays a role in this outcome has not been fully uncovered. Mesenchymal stem cells (MSCs) were previously shown to promote platelet production and lower platelet activation. We found that healthy megakaryocytes transfer mitochondria to MSCs, which is mediated by connexin 43 (Cx43) gap junctions on MSCs and leads to platelets at a low energetic state with increased LYN activation, characteristic of resting platelets with increased LYN activation, characteristic of resting platelets. On the contrary, MSCs have a limited ability to transfer mitochondria to megakaryocytes. Sickle cell disease (SCD) is characterized by hemolytic anemia and results in heightened platelet activation, contributing to numerous disease complications. Platelets in SCD mice and human samples had a heightened energetic state with increased glycolysis. MSC exposure to heme in SCD led to decreased Cx43 expression and a reduced ability to uptake mitochondria from megakaryocytes. This prevented LYN activation in platelets and contributed to increased platelet activation at steady state. Altogether, our findings demonstrate an effect of hemolysis in the microenvironment leading to increased platelet activation in SCD. These findings have the potential to inspire new therapeutic targets to relieve thrombosis-related complications of SCD and other hemolytic conditions.

Keywords: Bone marrow; Hematology; Mouse stem cells; Platelets; Stem cells.


Conflict of interest statement

Conflict of interest: The authors have declared that no conflict of interest exists.

Figures

Figure 1
Figure 1. Megakaryocytes transfer mitochondria to mesenchymal stem cells.
C57BL/6 murine MKs were cultured together with C57BL/6 MSCs or cultured alone. By flow cytometry, MKs from cocultures were analyzed for (A) mean fluorescence intensity (MFI) of mitotracker green (MTG) (n = 5) and (B) MFI of MTG from human cord blood CD34+ cell-derived MKs cocultured with human bone marrow MSCs (n = 4). (C) RT-PCR expression of Nd1/Hk2 in murine MKs from cocultures (n = 5). (D) C57BL/6 murine MKs were cultured together with MSCs from PhAM-floxed;E2a-cre mice or cultured alone. MFI of mitochondria PhAM signal in MKs by flow cytometry (n = 5). (E) Wild-type murine MSCs were cultured together with murine MKs from PhAM-floxed;E2a-cre mice or cultured alone. MFI of PhAM mitochondrial signal in MSCs by flow cytometry (n = 4). (F) Schematic of transplant design in which C57BL/6 mice were transplanted with PhAM-floxed;E2a-cre bone marrow cells or PhAM-floxed;E2a-cre mice were transplanted with C57BL/6 cells. (G) Bone marrow MSCs analyzed from transplanted mice for percentage PhAM+ MSCs and (H) numbers of PhAM+ MSCs per femur. (I) Bone marrow MKs analyzed from transplanted mice for percentage PhAM+ MKs and (J) numbers of PhAM+ MKs per femur. n = 3–4 mice for GJ. *P ≤ 0.05, **P ≤ 0.01, ***P ≤ 0.001, ****P ≤ 0.0001. Data were analyzed with 2-tailed, unpaired Student’s t test. Data are presented as mean ± SEM.
Figure 2
Figure 2. Metabolic changes to megakaryocytes and MSCs following coculture.
C57BL/6 murine MKs were cultured together with C57BL/6 MSCs or cultured alone. (A) A representative Seahorse glycolytic rate assay conducted on MSCs following coculture. (B) Basal glycolysis levels of MSCs from coculture. (C) Compensatory glycolysis of MSCs following coculture. (D) Representative Seahorse glycolytic rate assay conducted on MKs following coculture. (E) Basal glycolysis levels of MKs from coculture. (F) Compensatory glycolysis of MKs following coculture. n = 3. *P ≤ 0.05, **P ≤ 0.01, ***P ≤ 0.001. Data were analyzed with 2-tailed, unpaired Student’s t test. Data are presented as mean ± SEM.
Figure 3
Figure 3. MSC CX43 gap junctions mediate mitochondrial transfer from megakaryocytes.
PhAM-floxed;E2a-cre murine MKs cultured together with C57BL/6 MSCs or MSCs from CX43-floxed;Lepr-cre mice. Following coculture, flow cytometry assessment of (A) mean fluorescence intensity (MFI) of PhAM signal in MKs (n = 5), (B) MFI of PhAM signal in platelets (n = 5), (C) MFI of PhAM signal in MSCs (n = 5), (D) CD62P expression on platelets (n = 4), and (E) JonA (αIIbβ3) expression on platelets (n = 4). (F) Representative Seahorse glycolytic rate assay conducted on MKs following coculture with wild-type or Gap19-treated MSCs (n = 3). (G) Basal glycolysis levels of MKs from coculture (n = 3). (H) Compensatory glycolysis of MKs following coculture (n = 3). (I) RT-PCR analysis of glycolytic genes (Pkm2, Pfkm, Hk1, and Slc3a3) in MKs from cocultures with either C57BL/6 MSCs or C57BL/6 MSCs pretreated with Gap19 to inhibit CX43 expression (n = 3–4). *P ≤ 0.05, **P ≤ 0.01. Data were analyzed with 2-tailed, unpaired Student’s t test. Data are presented as mean ± SEM.
Figure 4
Figure 4. MSCs alter platelet transcriptomics signature.
C57BL/6 murine MKs were cultured together with C57BL/6 MSCs or cultured alone. Platelets from cultures were pooled to conduct bulk RNA-Seq analysis (n = 4 mice per group). (A) Principal component analysis. (B) Top differentially expressed genes among platelets from cultures. (C) Top 10 pathways of differentially expressed genes in platelets from MK-MSC cocultures compared with MKs cultured alone. (D) Gene expression related to platelet aggregation in platelets from MK-MSC cocultures compared with MKs cultured alone.
Figure 5
Figure 5. MSCs upregulate LYN signaling in platelets.
C57BL/6 murine MKs were cultured together with C57BL/6 MSCs or cultured alone. Platelets from cultures were analyzed by flow cytometry for (A) total LYN mean fluorescence intensity (MFI). C57BL/6 murine MKs were cultured together with C57BL/6 MSCs, with Gap19-treated MSCs, cytochalasin D–treated MSCs, or cultured alone. (B) Histogram of p-LYN signal among platelets from cocultures. (C) MFI p-LYN signal among platelets from cocultures. *P ≤ 0.05. n = 3–4 mice. Data in A were analyzed with 2-tailed, unpaired Student’s t test. Data in C were analyzed by 1-way ANOVA with Tukey’s multiple comparison test. Data are presented as mean ± SEM.
Figure 6
Figure 6. Activation and metabolic profile of platelets from SCD mice.
Peripheral blood platelets from the Townes model of SCD or SA control mice were analyzed by flow cytometry for (A) CD62P expression (n = 3 mice) and (B) JonA expression (N = 4 mice). (C) Quantification of p-LYN expression by mean fluorescence intensity (MFI) (n = 6 mice). (D) Representative Seahorse glycolytic rate assay conducted on platelets from SCD mice compared with SA control mice (n = 3 mice). (E) Basal glycolysis levels (n = 3 mice). (F) Compensatory glycolysis levels (n = 3 mice). (G) Sorted MKs from SCD mice or SA control mice were analyzed by RT-PCR for glycolysis associated gene expression (n = 4 mice). Peripheral blood platelets from SCD or healthy donor patients were analyzed by (H) Seahorse glycolytic rate assay (n = 3). (I) Basal glycolysis levels of SCD platelets or healthy donor control platelets (n = 3). (J) Compensatory glycolysis of SCD platelets or healthy donor control platelets (n = 3). *P ≤ 0.05, **P ≤ 0.01, ***P ≤ 0.001, ****P ≤ 0.0001. Data were analyzed with 2-tailed, unpaired Student’s t test. Data are presented as mean ± SEM.
Figure 7
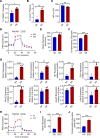
Figure 7. MSCs contribute to increased platelet activation in SCD.
SA murine MKs were cultured together with MSCs from SS or SA mice. Platelets from cocultures were analyzed by flow cytometry for expression of (A) CD62P (n = 6) and (B) JonA (n = 6). SA or SS MSCs were analyzed by RT-PCR for expression of (C) Cx43 (encoded by Gja1) relative to Gapdh (n = 3). (D) Cx43 (encoded by Gja1) relative to Gapdh in 20 μM hemin-treated MSCs or vehicle control-treated MSCs (n = 3–4). PhAM-floxed;E2a-cre murine MKs were cultured together with hemin-treated MSCs or vehicle-treated MSCs. Following coculture, flow cytometry assessment of (E) mean fluorescence intensity (MFI) of PhAM signal in MSCs (n = 4–5). (F) Percentage of CD62P+ platelets from hemin-treated MSC MK cocultures normalized to the MK + MSC group (n = 4). C57BL/6 murine MKs cultured alone or together with vehicle-treated MSCs or hemin-treated MSCs. (G) Mitotracker green signal in MKs (n = 5) and (H) mitotracker green signal in platelets (n = 3-6). (I) Mitotracker green signal in peripheral blood platelets from patients with SCD or healthy donors (n = 7). (J) Flow cytometry analysis of P-LYN expression in murine platelets from cocultures of MKs only, MKs + MSCs, and MKs + hemin-pretreated MSCs (n = 4–5). *P ≤ 0.05, **P ≤ 0.01, ***P ≤ 0.001, ****P ≤ 0.0001. Data in AF and I were analyzed with 2-tailed, unpaired Student’s t test. Data in G, H, and J were analyzed by 1-way ANOVA with Tukey’s multiple comparison test. Data are presented as mean ± SEM.

References

    1. Mendelson A, et al. Mesenchymal stromal cells lower platelet activation and assist in platelet formation in vitro. JCI Insight. 2019;4(16):e126982. doi: 10.1172/jci.insight.126982. - DOI - PMC - PubMed
    1. Levoux J, et al. Platelets facilitate the wound-healing capability of mesenchymal stem cells by mitochondrial transfer and metabolic reprogramming. Cell Metab. 2021;33(3):688–690. doi: 10.1016/j.cmet.2021.02.003. - DOI - PubMed
    1. Liu D, et al. Intercellular mitochondrial transfer as a means of tissue revitalization. Signal Transduct Target Ther. 2021;6(1):65. doi: 10.1038/s41392-020-00440-z. - DOI - PMC - PubMed
    1. Golan K, et al. Bone marrow regeneration requires mitochondrial transfer from donor Cx43-expressing hematopoietic progenitors to stroma. Blood. 2020;136(23):2607–2619. - PMC - PubMed
    1. Court AC, et al. Mitochondrial transfer from MSCs to T cells induces Treg differentiation and restricts inflammatory response. EMBO Rep. 2020;21(2):e48052. - PMC - PubMed

MeSH terms