. 2025 Mar 21;387(6740):eadk3248.
doi: 10.1126/science.adk3248. Epub 2025 Mar 21.

Regulatory T cells constrain T cells of shared specificity to enforce tolerance during infection

Affiliations

Regulatory T cells constrain T cells of shared specificity to enforce tolerance during infection

David E J Klawon et al. Science. .

Abstract

During infections, CD4+ Foxp3+ regulatory T (Treg) cells must control autoreactive CD4+ conventional T (Tconv) cell responses against self-peptide antigens while permitting those against pathogen-derived "nonself" peptides. We defined the basis of this selectivity using mice in which Treg cells reactive to a single prostate-specific self-peptide were selectively depleted. We found that self-peptide-specific Treg cells were dispensable for the control of Tconv cells of matched specificity at homeostasis. However, they were required to control such Tconv cells and prevent autoimmunity toward the prostate after exposure to elevated self-peptide during infection. Notably, the Treg cell response to self-peptide did not affect protective Tconv cell responses to a pathogen-derived peptide. Thus, self-peptide-specific Treg cells promoted self-nonself discrimination during infection by selectively controlling Tconv cells of shared self-specificity.


Conflict of interest statement

Competing interests: The authors declare that they have no competing interests.

Figures

Fig 1.
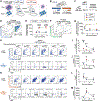
Fig 1.. C4-specific MJ23 Tconv cells are activated by self-ligand at steady-state and trigger the local enrichment of polyclonal Treg cells.
(A) Experimental schematic for (B) to (D). (B) Summary of PD-1 mean fluorescence intensity (MFI) on transferred MJ23 or polyclonal Tconv cells 24 hr post-transfer determined by confocal microscopy. n = 18, polyclonal Tconv; n = 23, MJ23 Tconv. (C) Local scaled density of polyclonal Treg cells within a 30μm radius of MJ23 Tconv cell or transferred polyclonal Tconv cells 24 hr post-transfer as determined by confocal imaging. n = 34, polyclonal Tconv; n = 107, MJ23 Tconv. (D) Frequency of MJ23+ CD4+ Tconv cells amongst polyclonal CD4+ T cells in the pLN at the indicated timepoint post-transfer, identified by flow cytometry. n = 12, d1; n = 12, d3; n = 12, d14 (E & F) Wild-type male mice were irradiated and reconstituted with a low frequency of congenically-disparate MJ23tg+ Rag1−/− Foxp3DTR bone marrow (LF MJ23 chimeric mice). >6 weeks post-engraftment the fate of MJ23 T cells was assessed in the pLNs by flow cytometry or confocal microscopy. LF MJ23 chimeras were depleted of MJ23 Treg cells via diphtheria toxin injection (DT) 3 days prior to analysis or left untreated. (G) Representative flow cytometric analysis of Egr2 vs. Foxp3 expression by MJ23 CD4+ T cells isolated from the pLNs. The frequency of cells within gates is denoted. (H) Frequency of Egr2+ cells amongst MJ23 CD4+ Treg and Tconv cells isolated from the pLNs of host mice, measured by flow cytometry. n = 20, no depletion; n = 10, MJ23 Treg depletion. (I-J) pLNs were harvested from untreated LF MJ23 chimeric mice as in (F) and analyzed by confocal microscopy. The observed local scaled density of polyclonal (I) or MJ23 (J) Treg cells within a 30μm radius of each MJ23 Tconv cell was determined, and was compared to the density after the position of MJ23 Tconv cells was randomly shuffled with polyclonal Tconv cells. For I, n = 13, shuffled; n = 13, observed; for J, n = 13, shuffled; n = 13, observed. Flow cytometric gating strategy is described in figure S13. The n values represent number of cells (B-C) and (I-J), or numbers of mice (D) and (H). Data are pooled from multiple independent experiments: n = 2 (B-C), 3 (D), 4–5 (G-H), 2 (I-J). Graphs show mean and quartiles (B-C) and (I-J), or mean ± SEM (D) and (H). P values were calculated by two-tailed non-parametric Mann-Whitney test (B-C), ordinary 1-way ANOVA (D) and (H), or as described in Materials and Methods (I-J). * P < 0.05; ** = P < 0.01; *** = P < 0.001; n.s. = P > 0.05)
Fig 2.
Fig 2.. Thymic presentation of C4/I-Ab is required to prevent prostatitis following Lm[C4] infection and does not impact the T cell response to the Lm-derived LLO peptide.
(A) Schematic depicting the anatomical location of C4 peptide expression and the approximate frequencies of endogenous C4/I-Ab-specific Treg and Tconv cells in C4WT and C4ΔTEC male mice. (B) Schematic depicting peptide expression in the genetically-engineered Lm[C4] pathogen strain. (C) Experimental design for panels (D-E) and (H-M). Lm[C4]: n = 6, C4WT d4; n = 7, C4ΔTEC d4; n = 6, C4WT d7; n = 7, C4ΔTEC d7; n = 8, C4WT d14; n = 10, C4ΔTEC d14. (D) Representative analysis of C4/I-Ab tetramer-APC vs -PE expression by polyclonal CD4+ T cells post-infection with Lm[C4]. The frequency of cells within gates is denoted. (E) Summary plot of the number of CD4+ T cells and CD8β+ T cells recovered from the prostates of mice. (F & G) C4WT and C4ΔTEC mice were challenged intravenously with 107 CFU Lm[F1], as in fig. S4F, and T cells isolated from the prostate were analyzed. Aire−/− male mice lacking tolerance to the F1 peptide were infected as a control. n = 4, C4WT; n = 4, C4ΔTEC; n = 2, Aire−/−. (F) Representative analysis of F1/I-Ab tetramer-APC vs -PE expression by polyclonal CD4+ T cells. The frequency of cells within the gates are denoted. (G) Pooled data showing the number of CD4+ T cells recovered from the prostates of Lm[F1]-challenged mice. (H-M) Analysis of T cells in the spleen in Lm[C4]-challenged mice treated as in (C). (H) Representative analysis of C4/I-Ab tetramer-APC vs -PE expression in polyclonal CD4+ T cells (top) and Ki67 vs Foxp3 expression by C4/I-Ab tetramer+ T cells (bottom). The frequency of cells within gates is denoted. (I) Data pooled from (H) showing the frequency of dual C4/I-Ab tetramer+ CD4+ T cells expressing Foxp3. (J) Pooled data from (H) showing the number of dual C4/I-Ab tetramer+ CD4+ T cells. (K) Representative analysis of LLO/I-Ab tetramer-APC vs -PE expression by polyclonal CD4+ T cells (top) and Ki67 vs Foxp3 expression by LLO/I-Ab tetramer+ T cells (bottom). The frequency of cells within gates is denoted. (L) Pooled data from (K) showing the frequency of dual LLO/I-Ab tetramer+ CD4+ T cells expressing Foxp3. (M) Pooled data from (K) showing the number of dual LLO/I-Ab tetramer+ CD4+ T cells. Flow cytometric gating strategy is described in figure S13. The n values represent the number of mice. Data are pooled from multiple independent experiments: n = 3–4 (D-E), 2 (F-G), 3–4 (H-M). In all graphs, each symbol represents the mean ± SEM of pooled mice. * denotes comparison of CD4+ T cells and # denotes comparison of CD8β+ T cells. P values were calculated by two-tailed non-parametric Mann-Whitney test (E), (I-J), (L-M) or ordinary 2-way ANOVA (G).(* = P < 0.05; ** = P < 0.01; *** = P < 0.001; **** = P < 0.0001; n.s. = P > 0.05).
Fig 3.
Fig 3.. C4-specific Treg cells restrict the emergence of C4-specific Tconv cells exhibiting proliferative and stem-like central memory states following Lm[C4] infection.
(A-E) C4WT and C4ΔTEC male mice were challenged intravenously with 107 CFU Lm[C4] as in (Fig. 2C). At 4 days post-infection, C4/I-Ab tetramer+ CD4+ T cells were purified by cell sorting from the spleen, and cells from individual mice were tagged, pooled, and subjected to scRNA-seq (10X platform). n = 9, C4WT; n = 10, C4ΔTEC. (A) Unsupervised clustering and UMAP embedding of scRNA-seq 5’ gene expression data. Clusters 0–13 are indicated. (B) UMAP embedding of cells derived from either genotype. 1593 C4WT-derived cells and 5246 C4ΔTEC-derived cells are depicted. (C) Z-score normalized expression of Foxp3. Clusters 1, 9, and C4WT-derived cells in Cluster 10 were designated as Treg cells, while all other cells were Tconv cells. (D) Violin plots depicting Z-score normalized expression of select genes in each cluster. (E) For the C4WT and C4ΔTEC settings, fraction of total T cells (left) or Tconv-assigned cells (right) in each cluster, relative to the total number of cells from each mouse. (F) Experimental schematic for panels (G-J). LF MJ23 chimeric mice were generated in C4WT and C4ΔTEC male hosts using MJ23tg+ Rag1−/− marrow and challenged with Lm[C4]. n = 16, C4WT; n = 20, C4ΔTEC. (G) Representative analysis of Ki67 vs. Foxp3 expression by MJ23+ or polyclonal CD4+ T cells isolated from the spleen following Lm[C4] infection. Frequency of cells within the gates is denoted. (H-J) Pooled data from (G) showing the number of MJ23+ CD4+ Tconv cells (H), the frequency of Ki67+ cells amongst MJ23+ CD4+ T cells (I), and the normalized MFI of Ki67 expressed amongst MJ23+ CD4+ T cells (J). (K) Experimental schematic for panels (L-O). LF MJ23 chimeric mice were generated in wild-type male hosts using MJ23tg+ Rag1−/− Foxp3DTR marrow and challenged with Lm[C4]. In the experimental group, host mice were depleted of MJ23 Treg cells 2 days prior to infection via a single dose of DT. n = 17, no depletion (- DT); n = 17, MJ23 Treg depletion (+ DT). (L) Representative analysis of Ki67 vs. Foxp3 expression by MJ23+ or polyclonal CD4+ T cells. The frequency of cells within the gates is denoted. (M-O) Pooled data from (L) showing the number of MJ23+ CD4+ Tconv cells (M), the frequency of Ki67+ cells amongst MJ23+ CD4+ Tconv cells (N), and the mean fluorescence intensity (MFI) of Ki67 on MJ23+ CD4+ Tconv cells (O). Flow cytometric gating strategy is described in figure S13. The n values represent the number of mice. Data are pooled from multiple independent experiments: n = 3 (G-J), 4 (L-O). In (A-C), each symbol represents one cell. In (E), (H-J), and (M-O), each symbol represents one mouse. Violin plots in (D-E) represent data from pooled mice. Graphs show mean and quartiles (E), or mean ± SEM (H-J) and (M-O). P values were calculated by 2-way ANOVA (E) or Welch’s t test (H-J) and (M-O). (* = P < 0.05; ** = P < 0.01; *** = P < 0.001; **** = P < 0.0001; n.s. = P > 0.05).
Fig 4.
Fig 4.. C4-specific MJ23 Treg cells co-localize with a fraction of MJ23 Tconv cells in the lymph node to limit TCR signaling and IL-2 sensing following Lm[C4] infection.
LF MJ23 chimeric mice were generated in C4WT and C4ΔTEC male hosts using bone marrow from MJ23 Rag1−/− mice. >6 weeks post-engraftment, host mice were infected with 107 CFU Lm[C4]. 3 days post-infection, the liver-draining portal LNs were fixed, sectioned, immunostained, and CD4+ T cells were analyzed by multiplexed confocal microscopy. n = 6, C4WT; n = 4, C4ΔTEC, where n denotes number of mice. (A) Representative confocal micrographs depicting 20μm LN sections. Images depict CD45.1, Ki67, Foxp3, CD4, and PD-1 immunostaining. Scale bar = 250μm. (B) Spatial kernel density function (KDE) of polyclonal Treg cells in the paracortical region of the LNs, depicted as shown in the color scale. The dots depict MJ23 Treg and MJ23 Tconv cells. Scale bar = 250μm. (C & D) Representative confocal micrographs depicting individual MJ23 Treg and Tconv cells and surrounding microenvironments in LNs of C4WT (C) and C4ΔTEC (D) mice. Dotted yellow circles highlight cells of interest, including MJ23 Tconv cells (yellow arrows). MJ23 cells are masked on CD45.1. Scale bar = 15μm. (E & F) Pooled data depicting the normalized Ki67, PD-1, and phospho-STAT5 (pSTAT5) summed fluorescence intensity (SFI) of MJ23 Tconv cells from mice of the two genotypes, with pSTAT5 denoted in the color scale. n = 123, C4WT; n = 147, C4ΔTEC. The dashed bold line represents the support vector machine (SVM) decision boundary trained to distinguish between C4WT and C4ΔTEC MJ23 Tconv cells based on PD-1 and Ki67 expression (E, right). The percentage of MJ23 Tconv cells that fall within the C4WT SVM boundary is indicated. KDEs based on MJ23 Tconv cell PD-1 and Ki67 expression are depicted (shading). The dashed vertical and horizontal lines depict high vs. low thresholds for Ki67 and PD-1, respectively. (G) Pooled data depicting the observed proximal density of MJ23 Treg cells surrounding MJ23 Tconv cells in LNs of C4WT hosts, compared to the density after the positions of MJ23 Treg cells were randomly shuffled across the positions of all polyclonal Treg cells. n = 100, shuffled; n = 100, observed. The percentage of observed data that falls outside the 95% confidence interval of the null model (shuffled condition) is indicated. (H & I) Pooled data depicting normalized PD-1 (H) and pSTAT5 (I) SFI on MJ23 Treg and polyclonal Treg cells in LNs of C4WT hosts. Proximal cells are those observed within 30μm of an MJ23 Tconv cell. n = 89, proximal MJ23; n = 581, distal MJ23; n = 670, proximal polyclonal; n = 670, distal polyclonal. The n values indicate the number of cells (E-I). Data are pooled from 2–3 independent experiments. Each symbol represents one MJ23 Tconv cell (E-G) or one Treg cell (H-I). Mean and quartiles are indicated (G-I). P values were calculated by Mann-Whitney’s test with Bonferroni correction (H-I) or as described in Materials and Methods (G). (** = P < 0.01; *** = P < 0.001; **** = P < 0.0001).
Fig 5.
Fig 5.. In the absence of MJ23 Treg cells, a fraction of MJ23 Tconv cells escape constraint by polyclonal Treg cells following Lm[C4] infection.
See Figure 4 for experimental setup of multiplexed confocal microscopy analysis. n = 6, C4WT; n = 4, C4ΔTEC; where n denotes number of mice. (A) Schematic for analysis of proximal Treg-Tconv cell pairings. Scale bar = 15μm. (B) Heatmap of unsupervised clustering of proximal Treg-Tconv cell pairings. n = 75, proximal MJ23 Treg cells; n = 3066, proximal polyclonal Treg cells. Treg-Tconv cell pairings were classified into five distinct clusters (P1 to P5). The genotype (C4WT or C4ΔTEC) and Treg cell identity (MJ23 or polyclonal) are indicated. (C) Plots showing the proportion of proximal Treg-Tconv cell pairings in each cluster as a fraction of the total pairings in mice of either genotype. The rightmost bar plot depicts the frequency of each cluster expected by chance under a random permutation null model. (* = p < 0.05; ** = P < 0.05 with an effect size of at least 25% difference from the null model). (D) Pooled data showing the log2-transformed normalized SFI of each parameter for the indicated clusters. Plots are shown for either proximal Treg cells or their paired MJ23 Tconv cells. The indicated parameter was compared with the average for all other clusters (*** = P < 8.3e-5; Welch’s t-test with the Bonferroni correction). Plots depicting parameters for MJ23 Treg cells are included (white). Red and blue asterisks indicate parameters that were significantly increased or decreased, respectively. (E & F) Pooled data depicting the expression of Ki67 vs. PD-1 on MJ23 Tconv cells from C4WT (E) and C4ΔTEC (F) mice, as in (Fig. 4; E & F). Each symbol represents one MJ23 Tconv cell, with the color denoting the most abundant cluster assigned by the proximal Treg-Tconv cell pairings in (B). The dashed bold lines represent the SVM decision boundary. The dashed vertical and horizontal lines depict high vs. low thresholds for Ki67 and PD-1, respectively. Data are pooled from 2–3 independent experiments. Mean and quartiles are indicated (D). P values were calculated by Welch’s t test with Bonferroni correction (D) or as described in Materials and Methods (C).
Fig 6.
Fig 6.. C4-specific MJ23 Treg cells are intrinsically poised to accumulate earlier than clonally-matched Tconv cells following Lm[C4] infection.
(A) Experimental schematic. LF MJ23 chimeric mice were generated in C4WT and C4ΔTEC male hosts using MJ23tg+ Rag1−/− marrow and challenged with Lm[C4]. n = 7, C4WT d0; n = 8, C4ΔTEC d0; n = 6, C4WT d2.5; n = 6, C4ΔTEC d2.5; n = 11, C4WT d3; n = 12, C4ΔTEC d3; n = 6, C4WT d3.5; n = 6, C4ΔTEC d3.5; n = 6, C4WT d4; n = 8, C4ΔTEC d4. (B) Representative flow cytometric analysis of CD4+ T cells (top) and Ki67 vs. Foxp3 expression by MJ23+ CD4+ T cells isolated from the spleen. In the top row, MJ23 T cells fall within the CD45.1+CD45.2neg gate. The frequency of cells within the gates is denoted. (C) Pooled data from (B) showing the number of MJ23+ CD4+ Treg and Tconv cells recovered at the indicated time points. * denotes comparison of C4WT Treg to C4ΔTEC Tconv and # denotes comparison of C4WT Treg to C4WT Tconv. Flow cytometric gating strategy is described in figure S13. The n values represent the number of mice. Data are pooled from 3–5 independent experiments. Each symbol represents the mean ± SEM of pooled mice (C). P values were calculated by two-tailed non-parametric Mann-Whitney test. (* = P < 0.05; ** = P < 0.01; **** = P < 0.0001).

References

    1. Nemazee D, Receptor selection in B and T lymphocytes. Annu Rev Immunol 18, 19–51 (2000) ( 10.1146/annurev.immunol.18.1.19). - DOI - PMC - PubMed
    1. Klein L, Kyewski B, Allen PM, Hogquist KA, Positive and negative selection of the T cell repertoire: what thymocytes see (and don’t see). Nat Rev Immunol 14, 377–391 (2014) ( 10.1038/nri3667). - DOI - PMC - PubMed
    1. Mathis D, Benoist C, Aire. Annu Rev Immunol 27, 287–312 (2009) ( 10.1146/annurev.immunol.25.022106.141532). - DOI - PubMed
    1. Kyewski B, Klein L, A central role for central tolerance. Annu Rev Immunol 24, 571–606 (2006) ( 10.1146/annurev.immunol.23.021704.115601). - DOI - PubMed
    1. Yu W et al. , Clonal Deletion Prunes but Does Not Eliminate Self-Specific alphabeta CD8(+) T Lymphocytes. Immunity 42, 929–941 (2015) ( 10.1016/j.immuni.2015.05.001). - DOI - PMC - PubMed

LinkOut - more resources