. 2025 May 5;224(5):e202410001.
doi: 10.1083/jcb.202410001. Epub 2025 Feb 27.

TANGO2 is an acyl-CoA binding protein

Affiliations

TANGO2 is an acyl-CoA binding protein

Agustin Leonardo Lujan et al. J Cell Biol. .

Abstract

Loss of TANGO2 in humans precipitates metabolic crises during periods of heightened energy demand, such as fasting, infections, or high fever. TANGO2 has been implicated in various functions, including lipid metabolism and heme transport, and its cellular localization remains uncertain. In our study, we demonstrate that TANGO2 localizes to the mitochondrial lumen via a structural region containing LIL residues. Mutations in these LIL residues cause TANGO2 to relocate to the periphery of lipid droplets. We further show that purified TANGO2 binds acyl-coenzyme A, and mutations in the highly conserved NRDE sequence of TANGO2 inhibit this binding. Collectively, our findings suggest that TANGO2 serves as an acyl-coenzyme A binding protein. These insights may provide new avenues for addressing the severe cardiomyopathies and rhabdomyolysis associated with defective TANGO2 in humans.


Conflict of interest statement

Disclosures: The authors declare no competing interests exist. Views and opinions expressed are however those of the author(s) only and do not necessarily reflect those of the European Union. Neither the European Union not the granting authority can be held responsible for them.

Figures
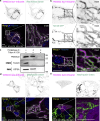
Figure 1.
Figure 1.
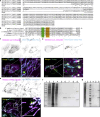
Localization of TANGO2 isoforms 1, 2, and 5. (a) HepG2 cells expressing TANGO2.Iso1-mScarlet (magenta) were incubated with Hoechst-33342 (blue) to detect DNA and MitoTracker Green to visualize the mitochondria. Pearson’s correlation (r) and Mander’s overlap (M1 and M2) coefficients were calculated with the coloc2 plugin in ImageJ software. (b) Cells cotransfected with TANGO2.Iso1-mScarlet (magenta) and Tom20.GFP (green) were incubated with Hoechst-33342 (blue) to detect DNA. (c) HepG2 cells were processed to obtain mitochondria-enriched fractions. The mitochondrial fractions were treated (+) with 50 µg/ml proteinase K for outer membrane protein cleavage and 1% Triton X-100 for total membrane disruption. Samples were resolved by SDS-PAGE and incubated with the antibodies Tom20, sited in the outer mitochondrial membrane, and ATP5A, sited in the inner mitochondrial membrane, and TANGO2. OMM, outer mitochondrial membrane; IMM, inner mitochondrial membrane. (d and e) HepG2 cells expressing TANGO2.Iso2-mScarlet (d) or TANGO2.Iso5-mScarlet (e) were incubated with MitoTracker Green to detect the mitochondria and Hoechst-33342 (blue) to label DNA. Pearson’s correlation (r) and Mander’s overlap (M1 and M2) coefficients were calculated with the coloc2 plugin in ImageJ software. Squares indicate the magnification area (inset). Scale bars = 10 µm. The white color indicates colocalization between magenta and green channels. Images are representative of three independent experiments. Source data are available for this figure: SourceData F1.
Figure S1.
Figure S1.
TANGO2 isoform alignment, location in U2OS cells, and purification in HEK293 cells. (a) In silico sequence alignments of the full-length TANGO2 isoforms 1 (UniProt ID: Q6ICL3-1), 2 (UniProt ID: Q6ICL3-2), and 5 (UniProt ID: Q6ICL3-5), using T-COFFEE server. Asterisks (*) indicate fully conserved residues, while a colon (:) and a period (.) represent strongly and weakly similar properties in the amino acid sequence. (b) Multiple sequence alignment of the 40 amino-terminal residues of TANGO2 orthologs in Homo sapiens, Danio rerio, Drosophila melanogaster, Caenorhabditis elegans, and Saccharomyces cerevisiae, using T-COFFEE software. The conserved regions LIL (green) and NRDE (orange) are highlighted. (c–e), U2OS cells transfected with TANGO2.Iso1-mScarlet (c), or the mutants TANGO2.∆LIL-mScarlet (d) and TANGO2.∆NRDE-mScarlet (e) (magenta) were incubated with the LD marker Bodipy Green and the mitochondrial marker MitoTracker Deep Red (cyan). Squares indicate the magnification area (inset). Scale bars = 10 µm. (f) Representative Coomassie staining gel of TANGO2.Flag purification. Lanes were loaded with samples of molecular marker (1, in kDa), cell lysate (2), pellet (3), flow-through fraction after bead binding (4), flow-through fraction after ATP wash (5), first elution (6), second elution (7), third elution (8), and beads (9). (g) Representative Coomassie staining gel of TANGO2.∆NRDE.Flag purification. Lanes were loaded with samples of cell lysate (1), flow-through fraction after ATP wash (2), molecular marker (3, in kDa), first elution (4), second elution (5), and beads (6). Source data are available for this figure: SourceData FS1.
Figure 2.
Figure 2.
TANGO2 wild-type and mutant location. (a–c) HepG2 cells transfected with TANGO2.Iso1-mScarlet (a), or the mutants TANGO2.∆NRDE-mScarlet (b) and TANGO2.∆LIL-mScarlet (c) were incubated with the LD marker Bodipy Green and the mitochondrial marker MitoTracker Deep Red (cyan). (d and e) HepG2 cells expressing the mutant TANGO2.40aa-mScarlet (d) or TANGO2.40aa.∆LIL-mScarlet (e) were incubated with MitoTracker Green to detect the mitochondria and Hoechst-33342 (blue) to visualize DNA. (f and g) HepG2 cells expressing TANGO2.Iso1-mScarlet (f) or TANGO2.∆LIL-mScarlet (g) were co-expressed with the LD marker construct GPAT4.hairpin-NG (green) and incubated with Hoechst-33342 (blue) to visualize DNA. Pearson’s correlation (r) and Mander’s overlap (M1 and M2) coefficients were calculated with the coloc2 plugin in ImageJ software. Squares indicate the magnification area (inset). Scale bars = 10 µm. Images are representative of three independent experiments. (h) HepG2 cells were incubated in a low-glucose medium for different periods (hour) and mechanically lysed, and the cytoplasmic and whole-cell fractions were analyzed by western blot. β-Actin was used as a loading control. (i) Graph shows the relative expression of the TANGO2/β-actin ratio in the cytoplasmic and whole-cell fractions. Source data are available for this figure: SourceData F2.
Figure 3.
Figure 3.
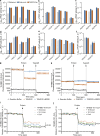
TANGO2 interacts with specific acyl chains. (a–f) LPLAT assays were performed in CHO-K1 cell lysates using C16:0-LPA, LPC, LPS, LPI, LPE, or LPG as acyl acceptors, and C16:0-CoA, C18:1-CoA, C18:2-CoA, C20:4-CoA, and C22:6-CoA as acyl donors. LPLAT activity was tested by measuring PA (a), PC (b), phosphatidylserine (PS; c), phosphatidylinositol (PI; d), phosphatidylethanolamine (PE; e), or phosphatidylglycerol (PG; f) molecule production in TANGO2-overexpressed (vermillion bars) compared with control cells (blue bars) and background noise (gray). The data are representative of three independent experiments with similar results. (g and h) Real-time NBD fluorescence intensity analysis of 2 µM 16-NBD-16:0-CoA or 18-NBD-18:1-CoA alone (0–300 s), incubated with 1 µM wild-type TANGO2 or mutant TANGO2.∆NRDE protein (300–600 s), and with 0.8% Tween-20 addition (1,200–1,800 s) at 24°C. All the reactions were performed in 150 μl of reaction buffer (Tris-HCl 20 mM, pH 7.4; black). (i and j) Real-time NBD fluorescence intensity analysis of 1 µM 16-NBD-16:0-CoA (i, black) or 18-NBD-18:1-CoA (j, black) incubated with 1 µM 16:0-CoA (vermillion), 18:1-CoA (blue), or CoA alone (green) for 5 min (0–300 s), and then with 1 µM wild-type TANGO2 protein (330–630 s) at 24°C. The NBD fluorescence intensity experiments are representative of at least two independent experiments with similar results. Data are shown as the mean ± SD. A. U. means arbitrary units.
Figure 4.
Figure 4.
Structure of TANGO2 and interaction simulation. (a) Mass distribution for TANGO2.Flag oligomers by mass photometry. (b) HepG2 cells cotransfected with TANGO2.Flag and TANGO2.mScarlet were immunoprecipitated (IP) with anti-flag resin followed by western blot analysis. The left and right panels show cell lysate input and IP, respectively. The top membrane shows immunoblotting against RFP. Flag and β-actin were used as IP and loading controls. (a–c) Cylinder (α-helices) and arrow (β-sheets) cartoon representation of the TANGO2 isoform 1 structure. The rainbow-colored chain indicates the beginning of the amino-terminal sequence (blue) to the carboxyl-terminal sequence (red) of TANGO2. The N° indicates the rotation degrees of the protein structure in the y axis. (d) Visualization of the cavitation (violet) from KVFinder in the predicted three-dimensional surface of the TANGO2 isoform 1 protein. (e) Position of the LIL and NRDE sequences in the TANGO2 structure and interaction simulation with one and two palmitate chains by AlphaFold 3.0. All structural representations of TANGO2 are based on AlphaFold prediction and visualized using UCSF ChimeraX. Source data are available for this figure: SourceData F4.

References

    1. Asadi, P., Milev M.P., Saint-Dic D., Gamberi C., and Sacher M.. 2023. Vitamin B5, a coenzyme A precursor, rescues TANGO2 deficiency disease-associated defects in Drosophila and human cells. J. Inherit. Metab. Dis. 46:358–368. 10.1002/jimd.12579 - DOI - PMC - PubMed
    1. Bard, F., Casano L., Mallabiabarrena A., Wallace E., Saito K., Kitayama H., Guizzunti G., Hu Y., Wendler F., Dasgupta R., et al. . 2006. Functional genomics reveals genes involved in protein secretion and Golgi organization. Nature. 439:604–607. 10.1038/nature04377 - DOI - PubMed
    1. Bosch, M., Parton R.G., and Pol A.. 2020. Lipid droplets, bioenergetic fluxes, and metabolic flexibility. Semin. Cell Dev. Biol. 108:33–46. 10.1016/j.semcdb.2020.02.010 - DOI - PubMed
    1. Chiapparino, A., Maeda K., Turei D., Saez-Rodriguez J., and Gavin A.-C.. 2016. The orchestra of lipid-transfer proteins at the crossroads between metabolism and signaling. Prog. Lipid Res. 61:30–39. 10.1016/j.plipres.2015.10.004 - DOI - PubMed
    1. Dibble, C.C., Barritt S.A., Perry G.E., Lien E.C., Geck R.C., DuBois-Coyne S.E., Bartee D., Zengeya T.T., Cohen E.B., Yuan M., et al. . 2022. PI3K drives the de novo synthesis of coenzyme A from vitamin B5. Nature. 608:192–198. 10.1038/s41586-022-04984-8 - DOI - PMC - PubMed

LinkOut - more resources