. 2025 Apr;301(4):108346.
doi: 10.1016/j.jbc.2025.108346. Epub 2025 Feb 25.

A p.N92K variant of the GTPase RAC3 disrupts cortical neuron migration and axon elongation

Affiliations

A p.N92K variant of the GTPase RAC3 disrupts cortical neuron migration and axon elongation

Ryota Sugawara et al. J Biol Chem. 2025 Apr.

Abstract

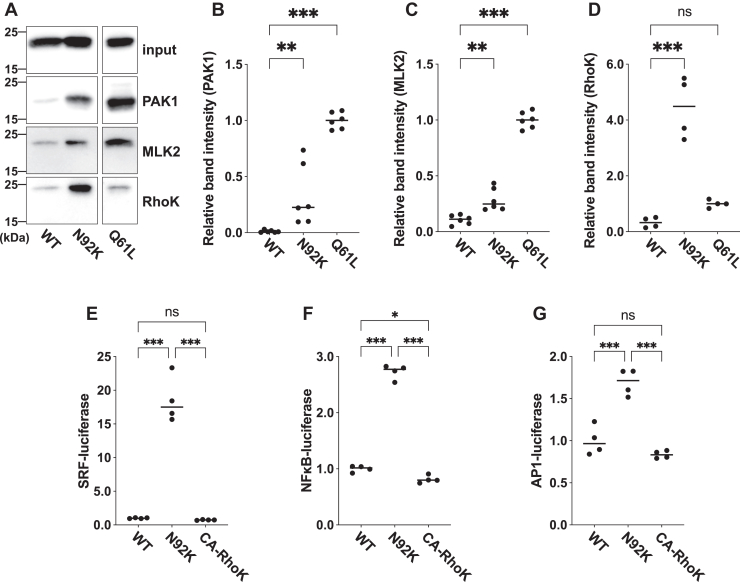
RAC3 encodes a small GTPase of the Rho family, crucial for actin cytoskeleton organization and signaling pathways. De novo deleterious variants in RAC3 cause neurodevelopmental disorder with structural brain anomalies and dysmorphic facies (NEDBAF). Disease-causing variants thus far reported are thought to impact key conserved regions within RAC3, such as the P-loop, switch I/II, and G boxes, which are essential for the interaction with regulatory proteins and effectors. Recently, however, a novel variant, c.276T > A, p.N92K, was identified in a prenatal case with complex brain malformations. This variant, located outside the core functional regions, represents a unique class of RAC3 pathogenic mutations. We investigated the variant's effects using in vitro, in silico, and in vivo approaches. Overexpression of RAC3-N92K in primary hippocampal neurons impaired differentiation, leading to round cell shape with lamellipodia, suggesting that RAC3-N92K is active. Biochemical studies showed that RAC3-N92K is (1) resistant to GAP-mediated inactivation, (2) responsive to GEF activation, and (3) capable of interacting with RAC effectors PAK1 and MLK2, as well as Rho-kinase 1, activating gene expression through SRF, NFκB, and AP1 pathways. Structural analyses suggest that N92K disrupts GAP interactions but preserves interactions with GEF, PAK1, and MLK2. In vivo, RAC3-N92K expression in embryonic mouse cortical neurons led to migration defects and periventricular clustering during corticogenesis, along with impaired axon elongation. These findings indicate that RAC3-N92K's activated state significantly disrupts cortical development, expanding the genetic and pathophysiological spectrum of NEDBAF.

Keywords: RAC3; axon guidance; brain development; neuronal migration; pathogenic variant; small GTPase; structure.


Conflict of interest statement

Conflicts of interests The authors declare that they have no conflicts of interest with the contents of this article.

Figures

Figure 1
Figure 1
Effects of the RAC3 p.N92K variant on neuronal morphology in vitro. A, schematic representation of RAC3 structure showing the position of the variant identified in this study (p.N92K) in magenta, and previously reported variants (p.G12R, p.F28S, p.P29L, p.P34R, p.A59G, p.G60D, p.Q61L, p.E62K, p.E62del, p.D63N, p.Y64C, p.R66W, and p.K116N) in black. Note that the N92 residue is located outside of any known functional regions of the protein. HVR, hypervariable region. B–E, hippocampal neurons dissociated at E16 were co-electroporated with pCAG-EGFP (0.1 μg) and either pCAG-Myc (vector) (B), -Myc-RAC3 (C), -RAC3-N92K (D), or -RAC3-Q61L (E) (0.3 μg each). Cells were fixed at 3 days in vitro and co-stained with anti-GFP (green), rhodamine-phalloidin (red), and DAPI (blue). Representative images were shown. Scale bars, 10 μm. F and G, quantification of (BE). F, axon length of neurons expressing pCAG-Myc (vector), -Myc-RAC3, -RAC3-N92K, or -RAC3-Q61L (≧ 62 cells each) was quantified. Statistical significance between vector and each variant was determined with Dunnett's test. vector versus WT, p = 0.43; vector versus Q61L, p < 0.001; vector versus N92K, p < 0.001. G, the morphological descriptor (circularity) of GFP-positive neurons (≧ 80 cells each) is shown in violin and dot plots. Statistical significance between vector and each variant was determined with Dunnett's test. vector vs. WT, p = 0.17; vector versus Q61L, p < 0.001; vector versus N92K, p < 0.001. ns: not significant, ∗∗∗p < 0.001.
Figure 2
Figure 2
Effects of the RAC3 p.N92K variant on biochemical activation status. A and B, measurement of GDP/GTP-exchange activity. A, recombinant His-tag-fused RAC3 (WT), RAC3-N92K, or RAC3-Q61L was preloaded with fluorescent mant-GDP and incubated with non-hydrolysable GTP analog. B, the mantGDP-dissociation rates of each condition were calculated as observed rate constants (Kobs [×10−5 s−1]) from the results in (A). Number of replicates, N ≥ 4. Statistical significance between each condition was determined using Tukey's test. WT versus N92K, p = 0.002; WT versus WT + GEF (Trio-D1), p < 0.001; WT versus N92K + GEF, p < 0.001; N92K versus WT + GEF, p < 0.001; N92K versus N92K + GEF, p < 0.001; WT + GEF versus N92K + GEF, p = 0.26. C and D, measurement of GTP-hydrolysis activity. C, the intrinsic activity was analyzed by directly measuring changes in GTP concentration using the GTPase-Glo assay kit. D, the EC50 (half maximal effective concentration) was estimated from the sigmoidal fitting curve in (C). Number of replicates, N ≥ 4. Statistical significance between each condition was determined using Tukey's test. WT versus N92K, p > 0.99; WT versus WT + GAP (CHN1), p < 0.001; WT versus N92K + GAP, p > 0.99; N92K versus WT + GAP, p < 0.001; N92K versus N92K + GAP, p > 0.99; WT + GAP versus N92K + GAP, p < 0.001. ns: not significant, ∗∗p < 0.002, ∗∗∗p < 0.001.
Figure 3
Figure 3
Structural overview of RAC3 and its p.N92K variation position in the GAP-associated states. A, the AlphaFold2 prediction model of the RAC3 (residues 1–192)-N-chimerin (residues 258–459) complex. The overall structure of the complex is shown on the left. A close-up view of the area enclosed by the magenta dashed line is shown on the right. Side chains of Asn92 of RAC3 (cyan) and Ser309 of N-chimerin (gray), and the backbone in the Gly307 to Ser309 region are shown as stick models. Labels (O) and (N) indicate the backbone oxygen and nitrogen atoms, respectively. A putative transition state mimic analog of the GTPase reaction, GDP-aluminum fluoride (GDP-AlF3), from the crystal structure of CDC42-GDP-AlF3-CDC42GAP complex is shown as yellow (GDP) and orange (AlF3) sticks. The switch I (residues 30–40) and switch II (residues 59–70) regions of RAC3 are shown in magenta and green, respectively. Dotted black lines indicate hydrogen bonds. B, alphaFold2-predicted model of the RAC3 (residues 1–192)-Trio-D1 (residues 1282–1606) complex. RAC3 is colored as in (A), while Trio-D1 is shown in salmon pink. C, free energy change resulting from the p.N92K variation. Free energy changes were calculated using the FoldX software, based on both the AlphaFold2-predicted models of the RAC3-N-chimerin and RAC3-Trio-D1 complexes.
Figure 4
Figure 4
Downstream signaling involved in the RAC3 p.N92K variant. A–D, interaction of RAC3-N92K with PAK1, MLK2, and Rho-kinase1 (RhoK). A, COS7 cells were transfected with pCAG-Myc-RAC3 (WT), RAC3-N92K, or -Q61L (0.3 μg each). A pull-down assay was conducted with respective GST-fused RBRs (5 μg each). 20 percent of the bound proteins was analyzed by western blotting (15% gel) using anti-Myc. Total cell lysates (3% of total volume) were also immunoblotted with anti-Myc for normalization (input). B–D, quantification of RAC3 bound to GST-RBR-PAK1 (B), -MLK2 (C), or -RhoK (D). The band intensity was measured by ImageJ software. The relative band intensity was expressed as a ratio relative to the value of RAC3-Q61L, which was set to 1.0. Data represent mean ± SEM (N ≧ 4). Statistical significance between WT and each variant was determined with Dunnett's test. B, WT versus N92K, p = 0.007; WT versus Q61L, p < 0.001. C, WT versus N92K, p = 0.002; WT versus Q61L, p < 0.001. D, WT versus N92K, p < 0.001; WT versus Q61L, p = 0.1. E–G, effects of the p.N92K variant and constitutively active Rho kinase 1 (CA-RhoK) on SRF- (E), NFκB- (F), and AP1-dependent (G) gene transcription. COS7 cells were co-transfected with each luciferase expression vector together with pCAG-Myc-RAC3 (WT), -RAC3-N92K, or CA-RhoK. Luciferase activity obtained with WT was set to 1.0, and relative activities are shown as Scatter plot. Data represent results from at least four independent experiments (N ≥ 4). Statistical significance between each condition was determined with Tukey's test. E, WT versus N92K, p < 0.001, WT versus CA-RhoK, p = 0.98, N92K versus CA-RhoK, p < 0.001. F, WT versus N92K, p < 0.001, WT versus CA-RhoK, p = 0.04, N92K versus CA-RhoK, p < 0.001. G, WT versus N92K, p < 0.001, WT versus CA-RhoK, p = 0.26, N92K versus CA-RhoK, p < 0.001. ns: not significant, ∗p < 0.033, ∗∗∗p < 0.001.
Figure 5
Figure 5
Effects of the p.N92K variant on neuronal migration during corticogenesis in vivo. A, pCAG-EGFP (0.4 μg) was co-electroporated in utero with pCAG-Myc (vector), pCAG-Myc-RAC3 (WT), or -RAC3-N92K (0.1 μg each) into the VZ progenitor cells at E14.5. Coronal sections were prepared at P0 and double-stained with anti-GFP (white) and DAPI (blue). Scale bars, 100 μm. B, quantification of GFP-positive neuron distribution in distinct cortical regions (bins 1–3) for each condition in (A). Data represent results from at least five independent experiments (N ≥ 5). Statistical significance between vector and RAC3-expressing cells was determined using Dunnett's test for each bin. Bin 1: vector versus WT, p = 0.005; vector versus N92K, p < 0.001. Bin 2: vector versus WT, p = 0.04; vector versus N92K, p > 0.99. Bin 3: vector versus WT, p = 0.24; vector versus N92K, p < 0.001. C, rescue effects of dominant negative (DN) PAK1, MLK2, and Rho-kinase1 (RhoK) on migration defects. pCAG-Myc-RAC3-N92K (0.1 μg) was co-electroporated with pCAG-GFP (0.4 μg) together with control pCAG-Flag (vector), -PAK1-KA, -MLK2-KN, or -RhoK-RB/PH(TT) (RhoK) (1.0 μg each). Analysis was performed as in (A). Scale bars, 50 μm. D, quantification of (C). Distribution of GFP-positive neurons in cortical regions (bins 1–3) is shown as scatter plot with bar. Data represent results from at least four independent experiments (N ≥ 4). Statistical significance between vector and each rescue condition was determined using Dunnett's test for each bin. Bin 1: vector versus +DN-PAK1, p = 0.33; vector versus +DN-MLK2, p = 0.50; vector versus +DN-RhoK, p > 0.99. Bin 2: vector versus + DN-PAK1, p = 0.08; vector versus ++DN-MLK2, p = 0.26; vector versus + DN-RhoK, p = 0.66. Bin 3: vector versus + DN-PAK1, p = 0.07; vector versus ++DN-MLK2, p = 0.21; vector versus + DN-RhoK, p = 0.86. EH, Long-term effects of RAC3-N92K. pCAG-Myc-RAC3-N92K was co-electroporated with pCAG-EGFP. Coronal sections were prepared at P7 and stained with anti-GFP (Green), DAPI (Blue), NeuN (Red). Boxed area in (E) was magnified to show GFP (F) and NeuN (G) signals. A merged image was presented in (H). Scale bars, 200 μm (E), 30 μm (FH). B and D, statistical significance is denoted as follows: ns: not significant, ∗p < 0.033, ∗∗p < 0.002, ∗∗∗p < 0.001.
Figure 6
Figure 6
Effects of the RAC3 p.N92K variant on axon extension during corticogenesis in vivo. A and C, pCAG-GFP (0.4 μg) was co-electroporated with pCAG-Myc-RAC3 (WT) or -RAC3-N92K (0.1 μg each) into the VZ progenitor cells at E14.5. Coronal sections were prepared at P0 (A) or P7 (C), and stained with anti-GFP (white). DAPI staining (blue) is shown in top panels. Scale bars, 500 μm. B and D, quantification of GFP intensity in callosal axons at P0 (B) or P7 (D) in different regions (bins 1–five for P0 and bins 1–four for P7). Relative intensities were normalized with bin one set to 1.0. Data represent results from at least four independent experiments (N ≥ 4). Statistical significance was determined using two-way ANOVA [B: F (3, 34), p < 0.001, D: F (4, 49), p < 0.001] followed by Šidák's post hoc test. B, bin 2, p < 0.001; bin 3, p = 0.008; bin 4, p = 0.93; bin 5, p = 0.99. D, bin 2, p < 0.001; bin 3, p < 0.001; bin 4, p < 0.001. Statistical significance is denoted as follows: ∗∗p < 0.002, ∗∗∗p < 0.001.

References

    1. Burridge K., Wennerberg K. Rho and rac take center stage. Cell. 2004;116:167–179. - PubMed
    1. Dvorsky R., Ahmadian M.R. Always look on the bright site of Rho: structural implications for a conserved intermolecular interface. EMBO Rep. 2004;5:1130–1136. - PMC - PubMed
    1. Bos J.L., Rehmann H., Wittinghofer A. GEFs and GAPs: critical elements in the control of small G proteins. Cell. 2007;129:865–877. - PubMed
    1. Malosio M.L., Gilardelli D., Paris S., Albertinazzi C., De Curtis I. Differential expression of distinct members of Rho family GTP-binding proteins during neuronal development: identification of Rac1B , a new neural-specific member of the family. J. Neurosci. 1997;17:6717–6728. - PMC - PubMed
    1. Haataja L., Groffen J., Heisterkamp N. Characterization of RAC3, a novel member of the Rho family. J. Biol. Chem. 1997;272:20384–20388. - PubMed

LinkOut - more resources