. 2025 Apr 1;39(7-8):445-462.
doi: 10.1101/gad.352492.124.

Active telomere elongation by a subclass of cancer-associated POT1 mutations

Affiliations

Active telomere elongation by a subclass of cancer-associated POT1 mutations

Annika Martin et al. Genes Dev. .

Abstract

Mutations in the shelterin protein POT1 are associated with diverse cancers and thought to drive carcinogenesis by impairing POT1's suppression of aberrant telomere elongation. To classify clinical variants of uncertain significance (VUSs) and identify cancer-driving loss-of-function mutations, we developed a locally haploid human stem cell system to evaluate >1900 POT1 mutations, including >600 VUSs. Unexpectedly, many validated familial cancer-associated POT1 (caPOT1) mutations are haplosufficient for cellular viability, indicating that some pathogenic alleles do not act through a loss-of-function mechanism. Instead, POT1's DNA damage response suppression and telomere length control are genetically separable. ATR inhibition enables isolation of frameshift mutants, demonstrating that the only essential function of POT1 is to repress ATR. Furthermore, comparison of caPOT1 and frameshift alleles reveals a class of caPOT1 mutations that elongate telomeres more rapidly than full loss-of-function alleles. This telomere length-promoting activity is independent from POT1's role in overhang sequestration and fill-in synthesis.

Keywords: POT1; cancer; deep scanning mutagenesis; pluripotent stem cells; telomerase; telomere.


Figures

Figure 1.
Figure 1.
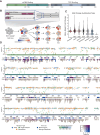
Deep scanning mutagenesis of POT1 reveals essential amino acids for cellular viability. (A) Schematic of POT1 protein domains. (B) Schematic of POT1 loHAP generation and screen timeline. Homology-directed repair (HDR)-mediated CRISPR/Cas9 mutagenesis of the remaining POT1 allele results in a spectrum of mutations with a direct genotype to phenotype correlation. Over 3 weeks of culture, the most deleterious alleles are depleted from the population. (C) Mean fold change in allele frequency across three biological replicates per allele between week 3 and week 1, stratified by mutation type: unedited, silent mutations, alanine substitutions, other substitutions (including clinical variants), precise single-codon deletions, other in-frame nonhomologous end-joining (NHEJ) events, and frameshift NHEJ events. (D) Summary dot plot of the week 3 log2 fold change for all silent mutations, substitutions, and single-codon deletions generated within the screen. Large dots indicate mean values at a given amino acid position, and smaller dots show individual biological replicates. The silent mutation mean for a given position is represented by the mean of all silent alleles carrying a codon change at that position, as silent alleles may contain codon changes at multiple positions. Below the dot plot is a domain map showing the location of the Holliday junction resolvase-like (HJRL) domain and OB folds. Below the domain map, persistence/depletion scores (see “Data Analysis—Allele Classification” in the Materials and Methods) for single-codon deletions (Del) and substitutions (Subs) are shown for each amino acid position. Blue (3,0) and taupe (0,3) indicate that all three biological replicates showed more allele depletion than synonymous mutations occurring at similar frequencies or less allele depletion than frameshift mutations, respectively. Purple (3,3) indicates hypomorphic alleles that persisted relative to frameshift mutations but were depleted relative to synonymous mutations. Gradations between these colors indicate differential behavior of biological replicates. White (0,0) indicates that the allele was not generated or that the allele could not be classified using these metrics. As multiple substitutions may occur at a single amino acid position, multiple squares at a given substitution position indicate unique amino acid substitutions. All screen results are shown in Supplemental Table S1.
Figure 2.
Figure 2.
Many pathogenic caPOT1 mutations do not compromise cellular viability or abrogate essential POT1 functions. (A) Close view of zinc coordination by cysteines 382, 385, 503, and 506, colored by the week 3 log2 fold change in allele frequency of single-codon deletions (top) or alanine substitutions (bottom). The model was derived from PDB: 5UN7 (Rice et al. 2017). (B) POT1 (gray) interaction with telomeric DNA (magenta). The inset windows show hydrophobic residues at the center of OB1 (left) and OB2 (right) colored by log2 fold change in allele frequency of alanine substitutions. The model was derived from PDB: 8SH1 (Tesmer et al. 2023). (C) Closer view of the POT1–ssDNA interactions in B with the highlighted POT1 residues colored by log2 fold change in allele frequency of alanine substitutions. The model was derived from PDB: 1XJV (Lei et al. 2004). (D) Relative quantification of the proportion of alleles that are classified as persistent, hypomorphic, or depleted based on Wilcoxon rank sum comparison versus synonymous and frameshift mutations occurring at similar week 1 allele frequencies (see “Data Analysis–Allele Classification” in the Materials and Methods). Alleles are categorized as likely familial/likely pathogenic (based on ClinVar characterization, familial inheritance pattern, or disruption of the starting methionine), uncertain, or likely benign (based on ClinVar characterization). (E) Heat map showing log2 fold change of alleles classified as “likely pathogenic” in D, with three biological replicates shown across 3 weeks of allele sampling. (*) Germline familial cancer predisposition mutations, (◊) a variant identified in familial idiopathic pulmonary fibrosis (Kelich et al. 2022).
Figure 3.
Figure 3.
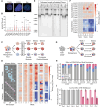
ATR inhibition stabilizes POT1 loss-of-function mutations. (A) Representative images for cells exhibiting the highest γH2AX TIF burdens in isolated T269Δ and C349Δ POT1 clones, characterized by the colocalization of TRF1 (green) and γH2AX (red) immunostaining signals. Scale bar, 2.5 μm. (B) Quantification of γH2AX TIFs per cell of clonally isolated POT1 mutants compared with unedited POT1 loHAPs. Duplicate genotypes indicate independently derived clones with the same mutation. Red error bars indicate median + interquartile range. Fisher's exact test with FDR correction for multiple comparisons of nuclei with ≥10 TIFs was done between each cell line and POT1 loHAP. (****) P value < 0.0001. (C) Schematic of intragenic synthetic lethality experiment: Clones isolated from the initial POT1 screen were retargeted to generate secondary mutations within the same POT1 allele that were then assayed over 3 weeks. (D) Results of retargeting experiment using sgRNA 73 and associated HDR templates. The heat map shows the mean log2 fold change of allele frequency of three biological replicates across 3 weeks of sampling for each indicated cell line (diploid wild type, loHAPs, S270A, T269Δ, R273A, and C349Δ). Alleles introduced by the POT1 retargeting are grouped by category: silent, alanine substitution, or single amino acid deletion. Alleles that were not detected in all three biological replicates in an indicated cell line are shown in white. (E) Telomere length analysis of clonally isolated POT1 mutant cell lines by Southern blot. Duplicate genotypes indicate independently derived clones with the same mutation. (F) Heat map showing mean log2 fold change of three biological replicates across 3 weeks of sampling for each indicated mutation. Alleles are grouped by mutation types. (G) Schematic of ATR/ATM inhibition screen. ATM inhibition (ATMi) or ATR inhibition (ATRi) was added immediately following sgRNA delivery. (H) Relative quantification of CRISPR/Cas9-mediated insertion and deletion alleles for 2 weeks after sgRNA delivery and drug treatment; three biological replicates are shown, with error bars representing the standard error of the mean. (I) Quantification of cell survival 4 days after ATRi withdrawal (−) compared with continued maintenance on ATRi (+) for four frameshift clones (pink) and four synonymous mutant clones (gray). Error bars show the standard error of the mean.
Figure 4.
Figure 4.
POT1 frameshift clones exhibit quantitatively and qualitatively different ATR-mediated TIFs than caPOT1 point mutation clones. (A) Quantification of γH2AX TIFs per cell under ATRi and 48 h after ATRi withdrawal for synonymous and frameshift clones (left of the dashed line) and with (+) or without (−) ATRi addition for 48 h for caPOT1 mutants (right of the dashed line). Red error bars indicate median + interquartile range. Fisher's exact test with FDR correction for multiple comparisons of nuclei with ≥10 TIFs was done between conditions with (+) and without (−) ATRi for each cell line. (*) P value ≤ 0.05, (****) P value ≤ 0.0001. (B) Quantification of γH2AX TIFs that colocalize with sites of EdU incorporation outside of S phase under ATRi and 48 h after ATRi withdrawal for synonymous and frameshift clones (left of the dashed line) and with (+) or without (−) ATRi addition for 48 h for caPOT1 mutants (right of the dashed line). Red error bars indicate median + interquartile range. Fisher's exact test with FDR correction for multiple comparisons of nuclei with ≥10 EdU-positive TIFs was done between frameshift (FS) and synonymous (Syn) cells and between mutant and POT1 loHAP cells. (*) P value ≤ 0.05, (****) P value ≤ 0.0001. (C) TRF1 spot number and spot intensity plots. Data are representative of four synonymous (Syn-12 through Syn-15) and four frameshift (FS-1 through FS-4) clones with (+) and without (−) ATRi. One-way ANOVA using Bonferroni's multiple comparison test was used to indicate significance. (∗) P-value ≤ 0.05, (∗∗∗) P-value ≤ 0.001. Red error bars indicate means + SD. (D) Representative images of EdU incorporation outside of S phase and γH2AX TIF colocalization outside of S phase in POT1 frameshift cells with (+) and without (−) ATRi. Scale bar, 2.5 μm. (E) Frequency plots for sites of EdU-positive γH2AX TIFs (X-axis) versus total γH2AX TIFs per cell (Y-axis). The top panel shows the frequency of distribution in loHAP, C349Δ, and T269Δ POT1 mutant cells, and the bottom panel shows frameshift (FS-1 and FS-2 combined) and synonymous mutations (Syn-12 and Syn-13 combined) with and without ATRi. (F) Frequency plots as in E for the colocalization of EdU-positive 53BP1 TIFs versus total 53BP1 TIFs per cell. (G) Frequency plots as in E for the colocalization of EdU-positive FANCD2 TIFs versus total FANCD2 TIFs per cell. (H) Frequency plots as in E for the colocalization of EdU-positive RPA2 (pS33) TIFs versus total RPA2 (pS33) TIFs per cell.
Figure 5.
Figure 5.
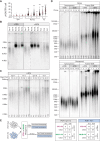
Telomere elongation driven by caPOT1 mutations is uncoupled from DDR signaling at telomeres, and POT1 is dispensable for telomere replication and maintenance under ATRi. (A) Quantification of γH2AX TIFs for mutants derived under ATRi. Withdrawal of ATRi is indicated below the X-axis. Red error bars indicate median + interquartile range. Fisher's exact test with FDR correction for multiple comparisons of nuclei with ≥10 TIFs was done relative to Syn cells without ATRi. (**) P value ≤ 0.01, (****) P value ≤ 0.0001. (B) Telomere length analysis of R273L, synonymous (Syn), and frameshift (FS) clones derived either under ATRi or without ATRi at 41 days after editing. Duplicate R273L genotypes indicate independently derived clones, whereas Syn and FS clones are labeled according to Supplemental Table S2. (C) Time-course telomere length analysis of two synonymous (Syn-7 and Syn-8) and two frameshift (FS-5 and FS-7) clones spanning days 41–98 after nucleofection. (D) Telomere length and overhang analysis of four synonymous (Syn-1 through Syn-4) and four frameshift (FS-1 through FS-4) clones 13 weeks after editing under ATRi and 72 h after ATRi withdrawal. Both native (top) and denaturing (bottom) conditions are shown. The telomere probe used was (CCCTAA)3. Relative telomere overhang intensity (native intensity/denatured intensity) is quantified at the bottom of each lane in the native condition. Note that because intensity scales with telomere length as well as copy number, quantitative conclusions cannot be drawn between cell lines with differing telomere lengths. (E) CTC1 and SHLD1 targeting experiment in POT1 Syn-1 and POT1 FS-1 cells. POT1 Syn-1 and FS-1 cells were nucleofected as described in the Materials and Methods, and individual clones were genotyped at 12 and 26 days after nucleofection. “CTC1 FS” and “SHLD1 FS” refer to clones that carry homozygous or compound heterozygous frameshift mutations in CTC1 and SHLD1, respectively. “Other” refers to any clone that carries at least one unedited or in-frame-edited allele. Significance was determined by Fisher's exact test.
Figure 6.
Figure 6.
Model of POT1 interactions and telomere end homeostasis in a POT1 haploid setting. (Top left) Under wild-type conditions, POT1 represses ATR-mediated DDR, and telomere length homeostasis is maintained. (Top right) In POT1 frameshift mutations, ATR signaling is highly activated and results in cell death unless inhibited by ATRi; fill-in synthesis occurs but may be dysregulated, and telomeres elongate. (Bottom) In the case of caPOT1 mutations, ATR signaling may be partially activated, but DNA damage responses are mild; POT1 repression of telomerase activity is diminished, and fill-in synthesis is unaffected. A subclass of caPOT1 mutants retains or gains telomere length-promoting activity so telomeres elongate more dramatically and rapidly than frameshift alleles.

References

    1. Aramburu T, Kelich J, Rice C, Skordalakes E. 2022. POT1–TPP1 binding stabilizes POT1, promoting efficient telomere maintenance. Comput Struct Biotechnol J 20: 675–684. 10.1016/j.csbj.2022.01.005 - DOI - PMC - PubMed
    1. Bainbridge MN, Armstrong GN, Gramatges MM, Bertuch AA, Jhangiani SN, Doddapaneni H, Lewis L, Tombrello J, Tsavachidis S, Liu Y, et al. 2015. Germline mutations in shelterin complex genes are associated with familial glioma. J Natl Cancer Inst 107: dju384. 10.1093/jnci/dju384 - DOI - PMC - PubMed
    1. Boersma V, Moatti N, Segura-Bayona S, Peuscher MH, van der Torre J, Wevers BA, Orthwein A, Durocher D, Jacobs JJL. 2015. MAD2L2 controls DNA repair at telomeres and DNA breaks by inhibiting 5′ end resection. Nature 521: 537–540. 10.1038/nature14216 - DOI - PMC - PubMed
    1. Buisson R, Niraj J, Rodrigue A, Ho CK, Kreuzer J, Foo TK, Hardy EJ-L, Dellaire G, Haas W, Xia B, et al. 2017. Coupling of homologous recombination and the checkpoint by ATR. Mol Cell 65: 336–346. 10.1016/j.molcel.2016.12.007 - DOI - PMC - PubMed
    1. Cai SW, Takai H, Zaug AJ, Dilgen TC, Cech TR, Walz T, de Lange T. 2024. POT1 recruits and regulates CST–Polα/primase at human telomeres. Cell 187: 3638–3651.e18. 10.1016/j.cell.2024.05.002 - DOI - PMC - PubMed

Substances