. 2024 Dec 30;15(1):10829.
doi: 10.1038/s41467-024-55052-w.

Spatiotemporal proteomics reveals the biosynthetic lysosomal membrane protein interactome in neurons

Affiliations

Spatiotemporal proteomics reveals the biosynthetic lysosomal membrane protein interactome in neurons

Chun Hei Li et al. Nat Commun. .

Abstract

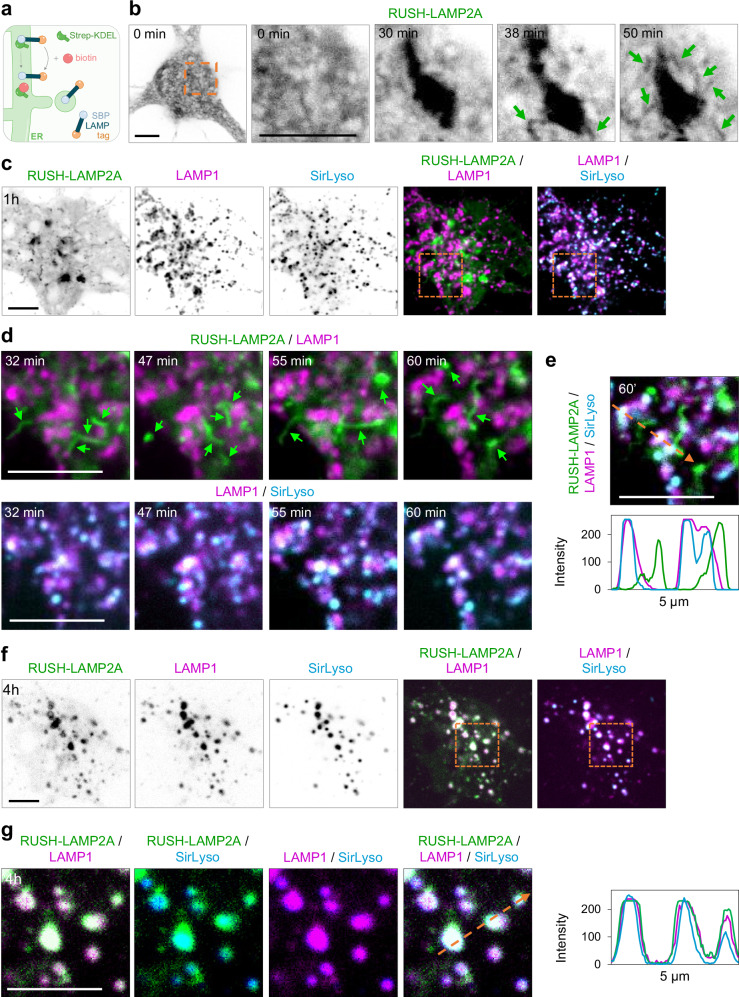
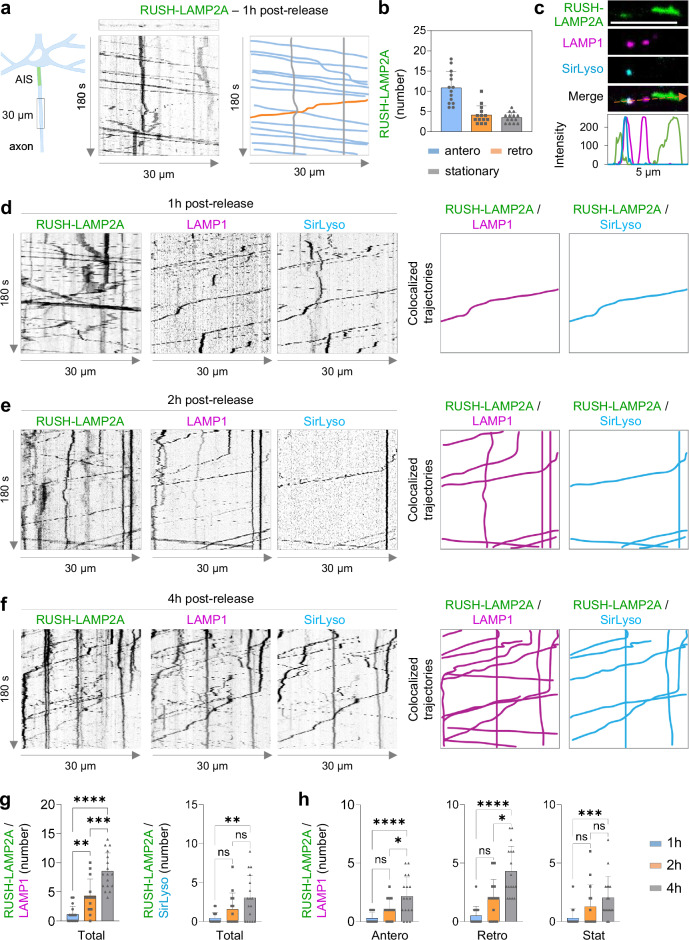
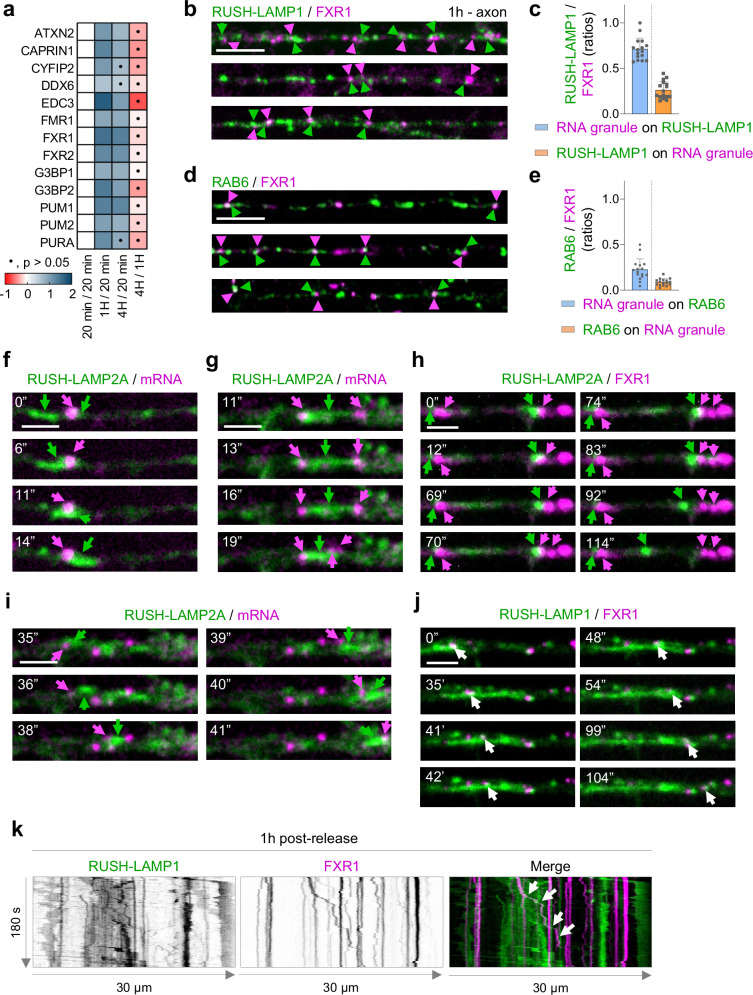
Lysosomes are membrane-bound organelles critical for maintaining cellular homeostasis. Delivery of biosynthetic lysosomal proteins to lysosomes is crucial to orchestrate proper lysosomal function. However, it remains unknown how the delivery of biosynthetic lysosomal proteins to lysosomes is ensured in neurons, which are highly polarized cells. Here, we developed Protein Origin, Trafficking And Targeting to Organelle Mapping (POTATOMap), by combining trafficking synchronization and proximity-labelling based proteomics, to unravel the trafficking routes and interactome of the biosynthetic lysosomal membrane protein LAMP1 at specified time points. This approach, combined with advanced microscopy, enables us to identify the neuronal domain-specific trafficking machineries of biosynthetic LAMP1. We reveal a role in replenishing axonal lysosomes, in delivery of newly synthesized axonal synaptic proteins, and interactions with RNA granules to facilitate hitchhiking in the axon. POTATOMap offers a robust approach to map out dynamic biosynthetic protein trafficking and interactome from their origin to destination.


Conflict of interest statement

Competing interests: The authors declare no competing interests.

Figures

Fig. 1
Fig. 1. Biosynthetic LAMP is present in an organelle distinct from lysosomes at 1 h after ER exit, but it fuses with lysosomes at 4 h.
a Schematic showing the RUSH system for retention and release of biosynthetic LAMPs. b Representative still images from live hippocampal neurons expressing RUSH-LAMP2A-mNG and imaged on a confocal spinning disk immediately after biotin addition every 1 min for 1 h. cg Representative still images from neurons co-expressing RUSH-LAMP2A-mNG and LAMP1-RFP (to visualize its steady state lysosomal distribution) and live-labeled with SirLyso 20 min prior to imaging to visualize mature lysosomes. Time after biotin addition is indicated in images. Selected magnified region in orange boxes. Orange arrows indicate the region used to generate intensity profile graphs. Green arrows point to biosynthetic LAMP2A-positive tubular organelles. Representative images reported in (bg) were repeated in at least three independent experiments. Scare bar, 5 µm. See also Supplementary Fig. 1.
Fig. 2
Fig. 2. POTATOMap dissects the biosynthetic LAMP-positive compartment interactome over time.
a Illustration of POTATOMap (Protein Origin, Trafficking And Targeting to Organelle Mapping) paradigm for biosynthetic LAMP. b Conditions and workflow for mass spectrometry in cortical neurons. c Representative confocal images of neurons expressing RUSH-LAMP1-V5-APEX2 treated with biotin-phenol (BP) only or biotin and biotin-phenol as indicated. Control neurons without H2O2 (top panel) and biotinylated neurons with H2O2 (bottom panel) were immunostained with antibodies against V5 (RUSH) and 555-conjugated Strep (biotin). Scale bar, 5 µm. d Immunoblot of RUSH-LAMP1-V5-APEX2 transduced neurons lysed at three time points as indicated, with and without H2O2. e Venn diagram of proteins significantly enriched at their respective time point(s) (N = 2 independent experiments with 2 technical repeats per experiment, two-sided t-test, p value < 0.05, log2 fold change ≥ or ≤±1, no multiple comparison test was used). fh DAVID analysis of Gene Ontology (GO) terms enriched among the proteins specific for each time point in (e, default setting was applied to DAVID analysis to determine process enrichments. Processes were first filtered by FDR < 0.01; then by EASE score, modified Fisher Exact p value < 0.05). Dot size represents the number of different proteins, dot color represents respective time point and term enrichment (p value < 0.05). GOCC, cellular compartment; GOBP, biological process; GOMF, molecular function; UPKW, Uniprot keyword. Representative image in c, d were repeated in at least 3 and 2 independent experiments respectively. See also Supplementary Figs. 2 and 3 and Source Data 1. Source data are provided as a Source Data file.
Fig. 3
Fig. 3. POTATOMap reveals interactors and potential key proteins for biosynthetic LAMP compartment trafficking and targeting to lysosomes.
a Schematic representation of identified proteins within enriched GO terms. Color coding indicates the time point(s) at which a given protein is enriched (Green 20 min; Red 1 hour; Blue 4 hour). Dashed lines between proteins specify physical interactions analyzed with STRING; grey rectangle depicts proteins involved in both processes. All indicated proteins are statistically significant (p value < 0.05). Asterisks indicate that the Log2 fold change enrichment at that time point is smaller than 1. be Confocal images of neurons co-labeled for RUSH-LAMP1-V5 and STX6 (b), RAB11 (c), RAB7 (d), and LAMTOR4 (e) after 1 h or 4 h of biotin addition. Magnified regions from soma are depicted with orange boxes. Orange arrows indicate the region used to generate intensity profile graphs. Scale bar, 10 µm, and magnified images, 1 µm. Representative images in be were repeated in at least 2−3 independent experiments. See also Supplementary Figs. 2 and 4, and Source Data 1. Source data are provided as a Source Data file.
Fig. 4
Fig. 4. Biosynthetic LAMP enters the axon as a distinct compartment other than lysosomes, but it fuses with and replenishes axonal lysosomes.
a Left, schematic showing the acquisition region of RUSH-LAMP2A-mNG transport along the axon. Right, kymographs generated from live cell imaging along the axon every 1 s for 180 s are shown. Anterograde, retrograde, and stationary direction is depicted with blue, orange, and grey lines. b Number of RUSH-LAMP2A-positive compartments moving antero- or retrogradely, or stationary after 1 h of biotin addition. n = 14 neurons, from 3 independent experiments (N = 3). c Still image from the axon of a live neuron expressing RUSH-LAMP2A-mNG and LAMP1-RFP, labeled with SirLyso. Orange arrow indicates region used to generate the intensity profile graph. Scale bar, 5 µm. df Kymographs of live neurons expressing RUSH-LAMP2A-mNG and LAMP1-RFP, labeled with SirLyso, after 1 h (d), 2 h (e) and 4 h (f) of biotin addition. Colocalized trajectories are traced and plotted on the right. g Quantification of total number of colocalized trajectories after 1, 2 and 4 h of biotin addition between RUSH-LAMP2A and LAMP1 (**p = 0.0051, ****p < 0.0001, ***p = 0.0001) or RUSH-LAMP2A and SirLyso (ns p = 0.465, **p = 0.0068, ns p = 0.3961). n = 16, 14 and 17 neurons, respectively; each from 3 independent experiments (N = 3). h Quantification of total colocalized compartments between RUSH-LAMP2A and LAMP1 in anterograde (ns p = 0.1836, ****p < 0.0001, *p = 0.0296), retrograde (ns p = 0.0944, ****p < 0.0001, *p = 0.0193) and stationary (ns p = 0.336, ***p = 0.0007, ns p = 0.1555). Data are presented as mean values ± SD, plus individual points. Ordinary one-way ANOVA test followed by a Tukey’s multiple comparison test for left graph in (g); middle graph in (h). Kruskal–Wallis test followed by a Dunn’s multiple comparison test for the right graph in (g) and the middle and right graphs in (h). See also Supplementary Fig. 5. Source data are provided as a Source Data file.
Fig. 5
Fig. 5. Axonal transport of RAB6-positive biosynthetic LAMP carrier is mediated by KIF5, KIF1A and ARL8B.
a Heatmap in which the log2 Fold Change across time points of members of the kinesin family and motor adaptors is plotted (two-sided t-test, no multiple comparison test was used). b Confocal images of axons of neurons expressing RUSH-LAMP1-V5 and shRNA scramble, or shRNAs against KIF5A-C, KIF1A or ARL8B. c Quantification of the number of LAMP1 compartments in (b). n = 26, 21, 18 and 15 neurons, respectively; each from 3 independent experiments (N = 3; ****p < 0.0001, ****p < 0.0001, ***p = 0.0003) (Scale bar, 5 µm). df Confocal image of the soma (d scale bar, 10 µm) or axon (f scale bar, 5 µm) of neurons expressing RUSH-LAMP1-V5 and GFP-RAB6A. e Magnified images of the area in (d) indicated by orange box (Scale bar, 2 µm). g Quantification of ratios for total axonal RUSH-LAMP1-V5 and RAB6A colocalizing at 1 or 4 h after release. n = 22 and 16 neurons; each from 3 independent experiments (N = 3). h Confocal images of axons from neurons expressing LAMP1-RFP and GFP-RAB6A. i Quantification of the ratios between total LAMP1 and RAB6A and colocalizing compartments, at the steady state (n = 13; N = 4 independent experiments) j Representative still images of the axon of a neuron expressing LAMP1-RFP and GFP-RAB6A (Scale bar, 2 µm, repeated with 4 independent experiments). Data are presented as mean values ± SD, plus individual points. Ordinary one-way ANOVA test followed by Tukey’s multiple comparison test in (c), and Kruskal-Wallis test followed by Dunn’s multiple comparison test in (g). See also Supplementary Fig. 6. Source data are provided as a Source Data file.
Fig. 6
Fig. 6. Biosynthetic LAMP and SYT1 are co-trafficked along the axon, and disruption of VAMP4 impairs their translocation to the axon.
a Heatmap in which the Log2 Fold Change across time points of axonal synaptic proteins and members of the SNARE complex is plotted (two-sided t-test, no multiple comparison test was used). b Live neuron expressing RUSH-LAMP2A-mNG, RUSH-SYT1-Halo and scramble, imaged during 1 h of biotin addition. Still images show part of the Golgi and a budding event. Intensity profile graph in the bottom. c Neurons expressing RUSH-LAMP2A-mNG and RUSH-SYT1-Halo at 1 and 4 h post-release. Kymographs from live cell imaging along the axon every 1 s for 180 s are shown. Colocalized anterograde (blue), retrograde (orange) or stationary (grey) trajectories were traced on the right. d Quantification of the number of trajectories for 1 and 4 h. n = 15 and 19 neurons; each from 3 independent experiments (N = 3; ****p < 0.0001, *p = 0.0433, ns p = 0.6092) e Confocal images of neurons expressing RUSH-LAMP1-V5 and EGFP-VAMP4, 1 h after release. Blue and orange boxes indicate magnified areas shown on the right, with corresponding intensity profile graph. f, g Confocal images of neurons expressing RUSH-LAMP1-V5 (f) or RUSH-SYT1-mNG (g) plus shRNA against VAMP4, or scramble. Quantifications of the number of RUSH-LAMP1 (n = 19 and 27 neurons; each from 4 independent experiments N = 4, ****p < 0.0001) and SYT1 (n = 27 and 22 cells; each from 3 independent experiments N = 3, ****p < 0.0001) positive compartments are shown on the right. h Still images from the soma of neuron expressing RUSH-LAMP2a-mNG, RUSH-SYT1-Halo and shRNA against VAMP4; control scramble in (b). Images show a Golgi budding event after 1 h release. Corresponding intensity profile graph on the right. i Neurons expressing RUSH-LAMP2A-mNG and shRNA against VAMP4 or scramble after 1 h release and immunostained for LAMTOR4 with respective intensity profile graphs are shown. j Neurons in (h) were labeled for SirLyso and imaged live after 1 h release. Still images from time points indicated in images and respective intensity profile graphs are shown. k Temporal intensity profile graph for RUSH-SYT1 and SirLyso from image in (j). Scale bars, 2 µm in (b), (hj), 5 µm in (f), (g), and 10 µm in (e). Data are presented as mean values ± SD, plus individual points. Mann-Whitney test was used in (d), (f), and (g). See also Supplementary Figs. 7 and 8. Representative images in b, e, and i were repeated in at least 3 independent experiments. Source data are provided as a Source Data file.
Fig. 7
Fig. 7. RNA granules interact with and hitchhike on biosynthetic LAMP compartments.
a Heatmap of the Log2 Fold Change/relative enrichment across time points of RNA granule-associated proteins (two-sided t-test, no multiple comparison test was used). b Confocal images of axons from neurons expressing RUSH-LAMP1-V5 and GFP-FXR1, 1 h after release. c Quantification of ratios between total GFP-FXR1 and RUSH-LAMP1-V5 and proximal compartments. n = 16; from 3 independent experiments (N = 3). d Confocal images of axons from neurons expressing GFP-RAB6 and Halo-FXR1. e Quantification of ratios between FXR1 and RAB6 colocalizations. n = 16; from 3 independent experiments (N = 3). fj Neurons expressing RUSH-LAMP2A-mNG and actin-PP7/PCP-Halo (f, g & i) or GFP-FXR1 (h, & j), imaged every 1 s after 1 h of release. k Kymograph of axon shown in j. Scale bar, 5 µm in (b), (d), and 2 µm in (f), (g), (h), (i) & (j). Data are presented as mean values ± SD, plus individual points. Representative images shown in fj were repeated in three independent experiments. See also Supplementary Fig. 9. Source data are provided as a Source Data file.
Fig. 8
Fig. 8. POTATOMap reveals mechanisms of biosynthetic LAMP Golgi exit, trafficking machinery, cotransport with axonal cargo, and interactions with RNA granules.
Model of biosynthetic LAMP Golgi exit (i), trafficking machinery (ii), cotransport with axonal synaptic proteins (iii), and interactions with RNA granules (iv).

References

    1. Perera, R. M. & Zoncu, R. The lysosome as a regulatory hub. Annu. Rev. Cell Dev. Biol.32, 223–253 (2016). - PMC - PubMed
    1. Ballabio, A. & Bonifacino, J. S. Lysosomes as dynamic regulators of cell and organismal homeostasis. Nat. Rev. Mol. Cell Biol.21, 101–118 (2020). - PubMed
    1. Settembre, C. & Perera, R. M. Lysosomes as coordinators of cellular catabolism, metabolic signalling and organ physiology. Nat. Rev. Mol. Cell Biol.25, 223–245 (2024). - PubMed
    1. Braulke, T. & Bonifacino, J. S. Sorting of lysosomal proteins. Biochim. Biophys. Acta.1793, 605–614 (2009). - PubMed
    1. Carlsson, S. R., Roth, J., Piller, F. & Fukuda, M. Isolation and characterization of human lysosomal membrane glycoproteins, h-lamp-1 and h-lamp-2. Major sialoglycoproteins carrying polylactosaminoglycan. J. Biol. Chem.263, 18911–18919 (1988). - PubMed

Publication types

Substances

LinkOut - more resources