

Neurofind: using deep learning to make individualised inferences in brain-based disorders
- PMID: 40016187
- PMCID: PMC11868583
- DOI: 10.1038/s41398-025-03290-x
Neurofind: using deep learning to make individualised inferences in brain-based disorders
Abstract
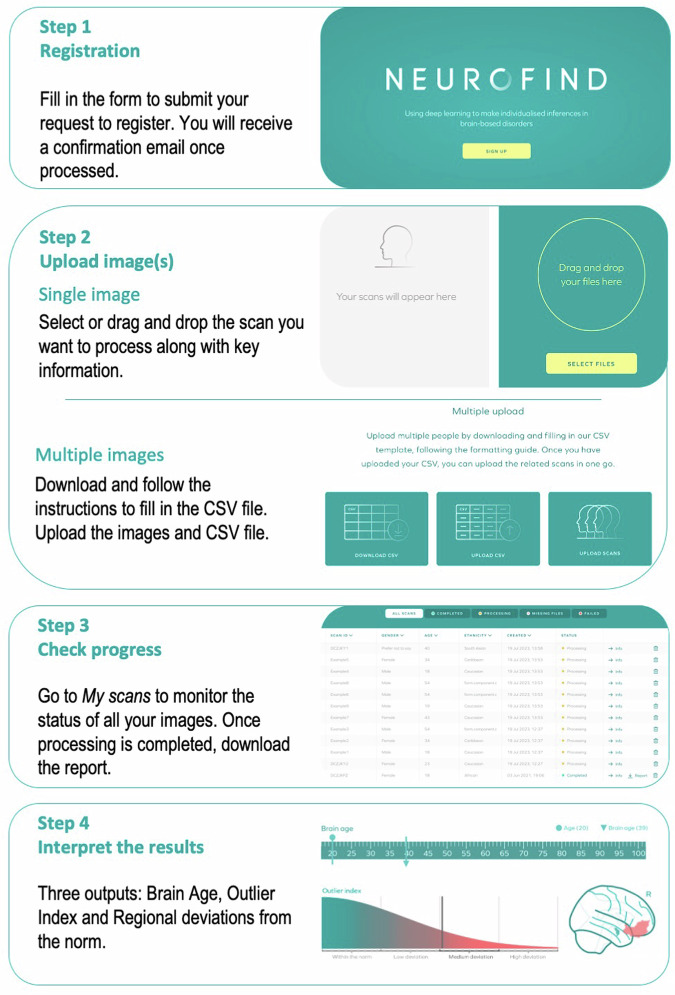
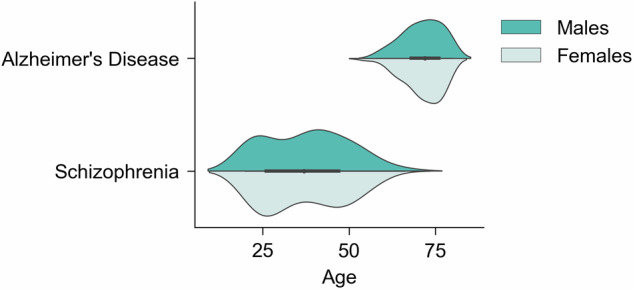
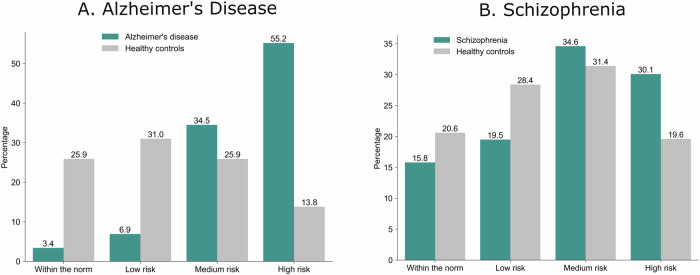
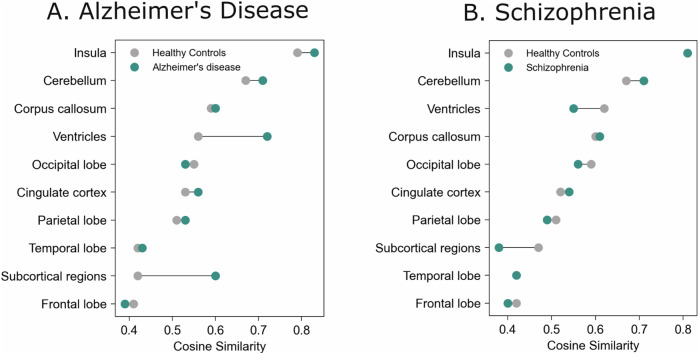
Within precision psychiatry, there is a growing interest in normative models given their ability to parse heterogeneity. While they are intuitive and informative, the technical expertise and resources required to develop normative models may not be accessible to most researchers. Here we present Neurofind, a new freely available tool that bridges this gap by wrapping sound and previously tested methods on data harmonisation and advanced normative models into a web-based platform that requires minimal input from the user. We explain how Neurofind was developed, how to use the Neurofind website in four simple steps ( www.neurofind.ai ), and provide exemplar applications. Neurofind takes as input structural MRI images and outputs two main metrics derived from independent normative models: (1) Outlier Index Score, a deviation score from the normative brain morphology, and (2) Brain Age, the predicted age based on an individual's brain morphometry. The tool was trained on 3362 images of healthy controls aged 20-80 from publicly available datasets. The volume of 101 cortical and subcortical regions was extracted and modelled with an adversarial autoencoder for the Outlier index model and a support vector regression for the Brain age model. To illustrate potential applications, we applied Neurofind to 364 images from three independent datasets of patients diagnosed with Alzheimer's disease and schizophrenia. In Alzheimer's disease, 55.2% of patients had very extreme Outlier Index Scores, mostly driven by larger deviations in temporal-limbic structures and ventricles. Patients were also homogeneous in how they deviated from the norm. Conversely, only 30.1% of schizophrenia patients were extreme outliers, due to deviations in the hippocampus and pallidum, and patients tended to be more heterogeneous than controls. Both groups showed signs of accelerated brain ageing.
© 2025. The Author(s).
Conflict of interest statement
Competing interests: The authors declare no competing interests. Ethics: The authors hereby confirm that all methodologies employed in this study adhere to the ethical guidelines set forth by the relevant national and institutional committees on human research, as well as align with the principles of the Helsinki Declaration. This study involved analysis of pre-existing anonymised datasets available elsewhere. The collection of all data was approved by the local ethics committees. Informed consent was obtained from all participants by the local research teams. Further details on data collection are provided in the references for the individual datasets in the methods. The analysis of the pre-existing subject data conducted as part of this study received full approval by the Psychiatry, Nursing and Midwifery Research Ethics Subcommittee at King’s College London (reference number LRS-20/21-21260).
Figures


References
-
- Kandilarova S, Stoyanov D, Sirakov N, Maes M, Specht K. Reduced grey matter volume in frontal and temporal areas in depression: contributions from voxel-based morphometry study. Acta Neuropsychiatr. 2019;31:252–7. - PubMed
MeSH terms
Grants and funding
LinkOut - more resources
Full Text Sources
Medical
Miscellaneous
