. 2025 Feb 27;16(1):2045.
doi: 10.1038/s41467-025-57359-8.

Molecular basis of host recognition of human coronavirus 229E

Affiliations

Molecular basis of host recognition of human coronavirus 229E

Yu-Xi Tsai et al. Nat Commun. .

Abstract

Human coronavirus 229E (HCoV-229E) is the earliest CoV found to infect humans. It binds to the human aminopeptidase N (hAPN) through the receptor binding domain (RBD) of its spike (S) protein to achieve host recognition. We present the cryo-electron microscopy structure of two HCoV-229E S protein in complex with a dimeric hAPN to provide structural insights on how the HCoV-229E S protein opens up its RBD to engage with its host receptor, information that is currently missing among alphacoronaviruses to which HCoV-229E belong. We quantitatively profile the glycosylation of HCoV-229E S protein and hAPN to deduce the glyco-shielding effects pertinent to antigenicity and host recognition. Finally, we present an atomic model of fully glycosylated HCoV-229E S in complex with hAPN anchored on their respective membrane bilayers to recapitulate the structural basis of the first step of host infection by HCoV-229E.


Conflict of interest statement

Competing interests: The authors declare no competing interest.

Figures

Fig. 1
Fig. 1. Cryo-EM structural analysis of 229E S:hAPN complex.
a Orthogonal views of the cryo-EM map of the 229E S:hAPN complex at the contour level of 6σ. The cartoon representation of the structures of both 229E S and hAPN dimer are colored by chain overlaid with the light-gray silhouette of the cryo-EM map. The map surfaces sequentially with matching colors as the cartoon representations. The unmodeled part of the other 229E S trimer was colored gray. b Schematics of domain architectures of 229E S (top) and hAPN (down). SP signal peptide, NTD N-terminal domain, RBD receptor binding domain, UH upstream helix, HR1 heptad repeat 1, CH central helix, CD connector domain, HR2 heptad repeat 2, TM transmembrane segment, CP cytoplasmic tail, D III Domain III. The domain ranges are indicated by the residue numbers. The gray dotted boxes indicate the regions that could not be defined in the cryo-EM map. Cartoon representations of the structures of HCoV-229E S (c), and hAPN ECD (d) fit to the corresponding cryo-EM maps shown in transparent surfaces. The chain with the RBD-up conformation of 229E S and the hAPN monomer are colored by domain segments, following the color scheme in (b). The upward RBD of 229E S is further labeled with “RBDup” and the length of the models is annotated in Å.
Fig. 2
Fig. 2. Conformational changes in 229E S and hAPN upon complex formation.
a The RBD underwent an upward motion upon hAPN binding by a rotation of ca. 60° defined by the angle between the center of mass (COM) of RBDdown and RBDup and the Cα atom of the first residue of the RBD (Leu293) as the hinge point. The structure of the RBDdown was taken from the PDB entry 6U7H. b The hAPN monomer of the 229E S:hAPN complex is superimposed with the X-ray structure (PDB entry 6U7G) shown in a transparent cartoon with respect to the domain IV of the hAPN monomer to illustrate the difference between the closed and open form as defined in the legend. c Superposition of the hAPN dimer of 229E S:hAPN complex and the X-ray structure (PDB entry 6U7G) reveals the widening of the open form compared to the closed form. The widths of both conformations are measured with the COMs indicated in the legend as the endpoints. The thickness of the cell membrane is drawn to scale.
Fig. 3
Fig. 3. Site-specific N-glycosylation analysis and structural mapping of the GlycoSHIELD.
MS-derived site-specific glycosylation profiles of 229E S (a) and hAPN (b). The domain architectures are shown in horizontal bars labeled with their corresponding names as defined in Supplementary Fig. 1. The pie charts of the individual N-glycosylation sites illustrate the relative populations of high-mannose type, hybrid type, and complex-type glycans shown in light-green, wheat, and purple. N538, N542, and N1040 lacked experimental evidence to assign their glycoforms. They are marked with an asterisk. The glycoforms of the unexpressed domains are drawn with dashed lines. Structural mapping of the glycosylation of 229E S (c) and hAPN (d) using the PDB entries 7CYC and 6U7G as the structural template, respectively. The proteinaceous parts are shown in white surfaces and the N-glycans are colored in green, wheat, and magenta for high, medium, and low percentage of high-mannose contents, as indicated on the right panel. The glycan shielding effects of 229E S (e) and hAPN (f) are color-ramped from white to dark green corresponding to low-to-high shielding effects as indicated by the scale bar below. The inaccessible surfaces based on a probe size of 7.5 Å are colored in dark gray. The readers are referred to Supplementary Fig. 30 for further details. The hAPN dimer interface is outlined by a yellow silhouette in (f).
Fig. 4
Fig. 4. Alterations in glycan shielding of 229E RBD in response to hAPN.
a The upper schematic illustrates the relative shielding contributed by glycans on S in RBDup conformation. The degree of relative shielding is normalized from 0 to 1, similar to Fig. 3e. The bottom panel shows the difference in glycoshielding between the one-RBDup state and the all-RBDdown state. The RBD surface representation is colored from red to blue corresponding to reduced to increased shielding as indicated by the scale bar below. The hAPN binding region and the epitopes of antibodies C04 and S11 are outlined by orange and magenta silhouettes, respectively. The molecular model of the entire 229E S trimer is shown in the upper left corner in low pass filtered surface representation with the three RBDs colored in blue and labeled in A, B, and C. A corresponds to the RBDup conformation. b The relative shielding and total shielding of 3DOWN and 1UP conformation and the discrepancy in the total shielding between the two are demonstrated with line graphs from top to bottom, with semitransparent orange regions as the epitopes of C04 and S11. The three binding loops and the residues directly contacting hAPN are indicated by brown and light brown blocks on the top panel. Source data are provided as a Source Data file.
Fig. 5
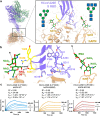
Fig. 5. Effects of N-glycosylation of N265 and N319 on the binding affinity between HCoV-229E S and hAPN.
a, b N265 and N319 are glycosylated in close proximity to the hAPN binding loops of the 229E RBD. Extra EM densities could be observed around these sites, potentially corresponding to the N-glycans. The major glycoforms of N265 and N319 derived from MS analysis are GlcNAc5Man3 and GlcNAc2Man5, respectively, as schematically shown by Symbol Nomenclature for Glycans (SNFG). Due to the limited glycan EM density, only the first three and first two glycan moieties were built for N265 and N319. The atomic model shows that a hydrogen bond could form between the O6 of NAG1 on N319 and the nearby S407. The black arrows represent the overall growing direction of the glycan structure. c Biolayer interferometry (BLI) sensorgrams of the kinetic assays with HCoV-229E S (P100E) as the immobilized ligand and the hAPN-WT, N265Q, and N319Q as the analytes are colored in blue, orange, and brown respectively. The highest concentration for each assay is indicated on the right as the starting concentration for the subsequent two-fold serial dilution. The KD, kon, and koff derived from the global fitting of the sensorgrams are shown above, with the light-gray experimental signals overlaid with the fitted data shown in colored lines. Source data are provided as a Source Data file.
Fig. 6
Fig. 6. Molecular model of HCoV-229E S:hAPN complex based on cryo-EM and MS glycosylation analyses.
a The atomic model is colored by a chain and enclosed in a transparent cryo-EM map at the contour level of 6σ. The ECDs of 229E S and hAPN, cell membrane, and virus membrane, are labeled. b The fully glycosylated model (left) with the site-specific glycan ensemble colored by respective high-mannose content, as described in the legend. The S protein surface on the right is colored by a glycan shielding effect ranging from 0 to 100%, as defined in Fig. 3.

References

    1. Gorbalenya, A. E., Enjuanes, L., Ziebuhr, J. & Snijder, E. J. Nidovirales: evolving the largest RNA virus genome. Virus Res.117, 17–37 (2006). - PMC - PubMed
    1. Zhao, X., Ding, Y., Du, J. & Fan, Y. 2020 update on human coronaviruses: one health, one world. Med. Nov. Technol. Devices8, 100043 (2020). - PMC - PubMed
    1. Ellwanger, J. H. & Chies, J. A. B. Zoonotic spillover: understanding basic aspects for better prevention. Genet. Mol. Biol.44, e20200355 (2021). - PMC - PubMed
    1. Perlman, S. & Netland, J. Coronaviruses post-SARS: update on replication and pathogenesis. Nat. Rev. Microbiol.7, 439–450 (2009). - PMC - PubMed
    1. Su, S. et al. Epidemiology, genetic recombination, and pathogenesis of coronaviruses. Trends Microbiol.24, 490–502 (2016). - PMC - PubMed

MeSH terms

Substances

LinkOut - more resources