. 2025 Feb 27;16(1):2020.
doi: 10.1038/s41467-025-57034-y.

Large scale investigation of GPCR molecular dynamics data uncovers allosteric sites and lateral gateways

Affiliations

Large scale investigation of GPCR molecular dynamics data uncovers allosteric sites and lateral gateways

David Aranda-García et al. Nat Commun. .

Abstract

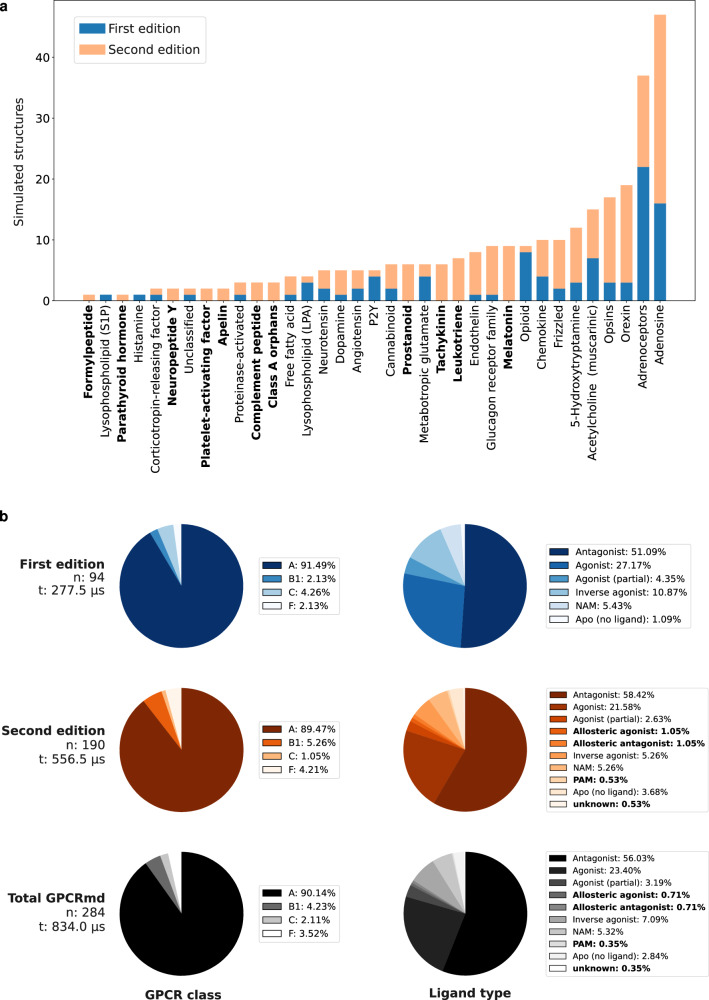
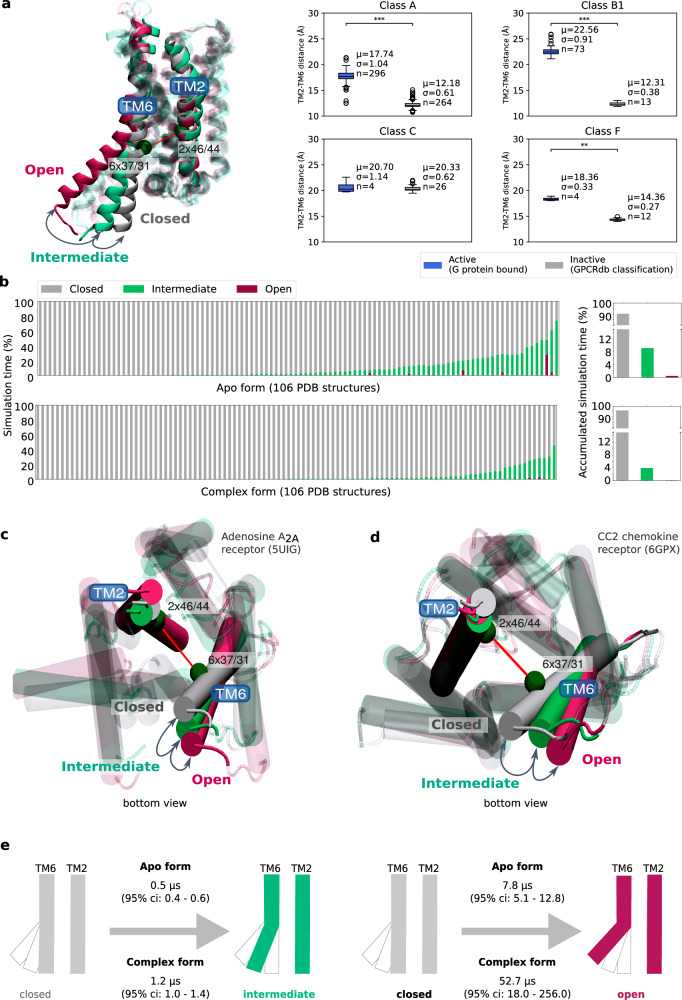
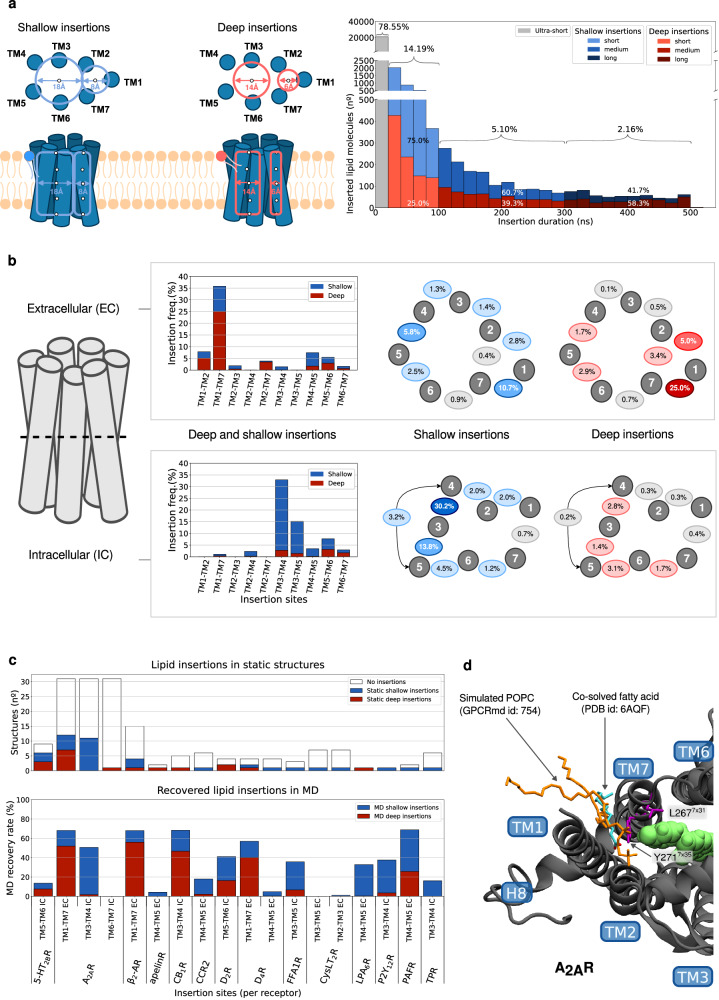
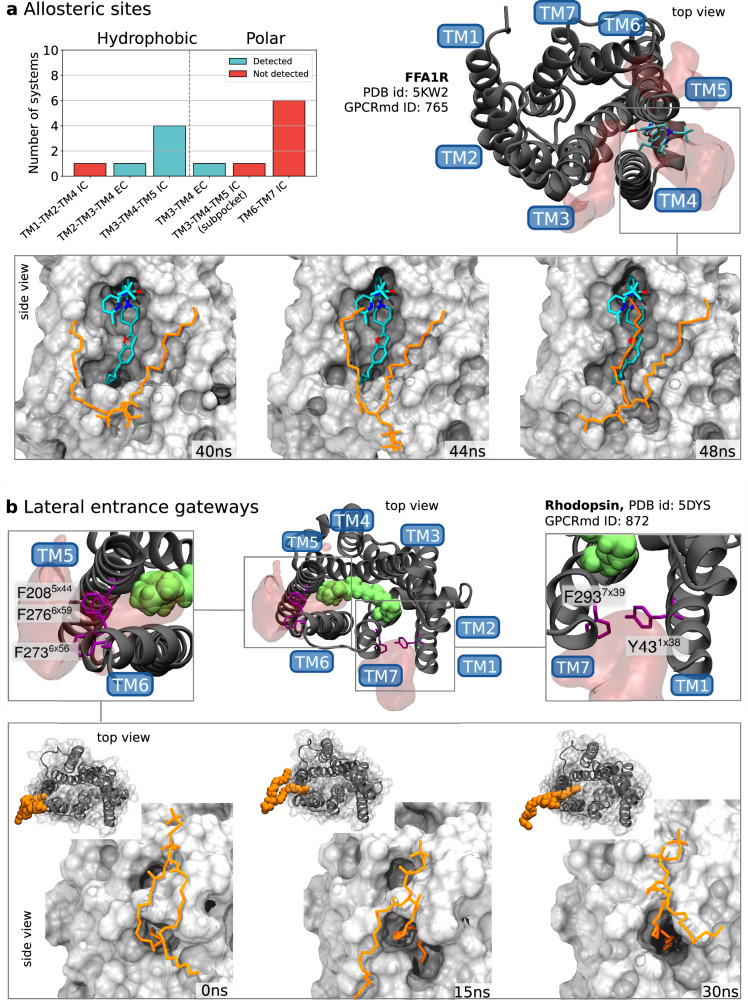
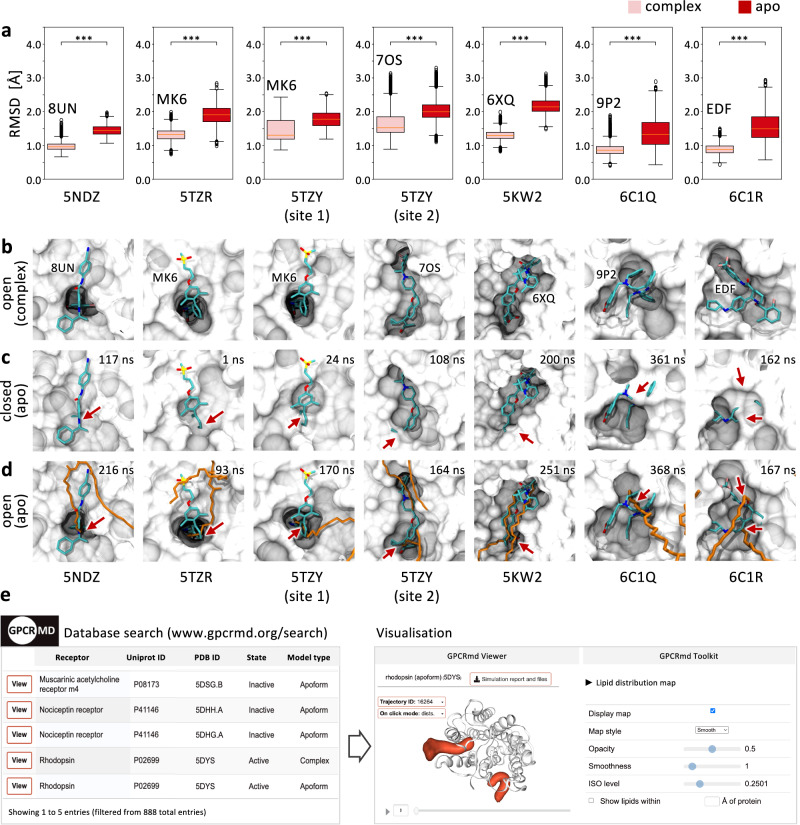
G protein-coupled receptors (GPCRs) constitute a functionally diverse protein family and are targets for a broad spectrum of pharmaceuticals. Technological progress in X-ray crystallography and cryogenic electron microscopy has enabled extensive, high-resolution structural characterisation of GPCRs in different conformational states. However, as highly dynamic events underlie GPCR signalling, a complete understanding of GPCR functionality requires insights into their conformational dynamics. Here, we present a large dataset of molecular dynamics simulations covering 60% of currently available GPCR structures. Our analysis reveals extensive local "breathing" motions of the receptor on a nano- to microsecond timescale and provides access to numerous previously unexplored receptor conformational states. Furthermore, we reveal that receptor flexibility impacts the shape of allosteric drug binding sites, which frequently adopt partially or completely closed states in the absence of a molecular modulator. We demonstrate that exploring membrane lipid dynamics and their interaction with GPCRs is an efficient approach to expose such hidden allosteric sites and even lateral ligand entrance gateways. The obtained insights and generated dataset on conformations, allosteric sites and lateral entrance gates in GPCRs allows us to better understand the functionality of these receptors and opens new therapeutic avenues for drug-targeting strategies.


Conflict of interest statement

Competing interests: The authors declare no competing interests.

Figures

Fig. 1
Fig. 1. Dataset diversity for GPCR class, receptor type and ligand type.
Newly introduced features in the second GPCRmd edition are displayed in bold. a Receptor type of the structures simulated in the second GPCRmd edition (this publication) versus the first GPCRmd round. b GPCR class and ligand type of the first GPCRmd edition (top), the second GPCRmd edition (middle) and the total dataset on GPCRmd (bottom). The reported ‘unknown’ ligand type refers to cases where a crystallisation adjuvant molecule is found inside the orthosteric pocket. Source data are provided in the Source Data file.
Fig. 2
Fig. 2. Flexibility analysis of the GPCR core.
a Structural depiction of the TM6 outward movement and the residues used to measure the TM2-TM6 distance (i.e., class A, B1, C: 2 × 46 and 6 × 37, class F: 2 × 44 and 6 × 31) (left). Distribution plot of the TM2-TM6 distance for class A, B1, C and F for active states (i.e., GPCR structures bound to a G protein) and inactive states according to GPCRdb classification. Boxplots display the average (µ), standard deviation (σ) and sample size (n) for each group. The centre line in boxplots represents the median while the box boundaries extend from the first (25%) and third (75%) quartile, representing the interquartile range (IQR). Boxplot whiskers extend to 1.5 × IQR and outliers are represented as circles. Statistical significance was assessed by a two-sided Mann-Whitney U test (class A P = 3.2 × 10−92, class B1 P = 1.1 × 10−8, class C P = 0.83, class F P = 4.3 × 10−3). b Conformational flexibility in simulated systems of GPCR class A and B1. We monitored closed, intermediate and open states based on the TM2-TM6 distance during 3 × 500 ns. Bar plots show the results for 107 simulated apo GPCRs (top) and the corresponding systems in complex with antagonists, inverse agonists or NAMs, respectively (bottom). Values available in Supplementary Data 2. c, d Structural depiction of two case studies from our dataset, represented in their open (purple), intermediate (green) and closed (grey) conformations visited during one of its apo simulations replicates. The data for the adenosine A2A receptor (PDB id: 5UIG) are available with GPCRmd id: 773 [https://www.gpcrmd.org/view/773], trajectory id: 15597. The simulation data for the CC2 chemokine receptor (PDB id: 6GPX) are accessible via the GPCRmd id: 799 [https://www.gpcrmd.org/view/799], trajectory 15764. The measured TM2-TM6 distances are marked in red. e Estimation of the average breathing kinetics across the 107 GPCR system pairs selected in b. The transition timescales from the closed to intermediate state (left) and from the closed to the open state (right) for apo and complex systems are shown including the 95% confidence interval (ci), respectively. Source data are provided in the Source Data file.
Fig. 3
Fig. 3. Identification and quantification of lipid insertions in GPCR MDs.
a Visual scheme of the algorithm used to find shallow and deep lipid insertions in GPCR simulations (left) and total count of individual lipid insertions across the dataset classified by duration and depth (right). Lipid molecules found inside any of the inner core receptor selections displayed (left) at least once during a simulation constitute individual lipid insertions. Lipids spending more than 20% of their total insertion time inside the smaller inner core selection (salmon) constitute ‘deep’ insertions, otherwise being considered ‘shallow’ insertions. Insertions are classified, according to their duration, as ultra-short (<20 ns), short (20–100 ns), medium (100–300 ns), and long (>300 ns). More information on lipid insertion detection and classification can be found in the ‘methods’ section. b Dataset-wide average lipid insertion frequency by receptor site, classified by surrounding TM helices and GPCR side (either Extracellular (EC) or Intracellular (IC)). Frequency values are displayed in two bar plots (centre) and in four visual schemes (right) where each grey circle represents a TM helix and each coloured oval an insertion frequency value. Frequencies for individual simulated systems are available in Supplementary Data 3 and 4. c Barplots representing insertions of lipid-like molecules (Supplementary Table 2) in static PDB structures (top) and the average recovery rate of these insertions in the corresponding simulations, classified by receptor and insertion sites (bottom). Results available in Supplementary Data 5. d Recovery of an experimental lipid insertion in an A2AR simulated system (PDB id: 6AQF, GPCRmd id: 754 [https://www.gpcrmd.org/view/754]), where a POPC lipid (licorice, orange) appears inserted in TM1-TM7 EC, the same spot as a previous static insertion produced by an oleic acid co-solved molecule (licorice, cyan). This insertion site is separated from the ligand binding site by residues L2677x31 and Y2717x35 (licorice, purple). Source data are provided in the Source Data file.
Fig. 4
Fig. 4. Detection of allosteric binding sites and entrance channels through lipid insertions.
a Identification of lipid insertions in systems experimentally solved with an allosteric ligand. Allosteric sites are classified according to their location in the receptor and the surrounding residues’ polarity. The results are displayed in a barplot (top left) with blue columns representing systems where a lipid insertion is found and red columns for those where no insertion is detected in any simulated replicate. Structural depiction of the free fatty-acid receptor-1 as an example system (top right) (PDB id: 5KW2, GPCRmd id: 765 [https://www.gpcrmd.org/view/765], trajectory id: 15540). A lipid penetration at TM3-TM4-TM5IC is observed where it occupies a known allosteric pocket (bottom). The initially co-solved allosteric modulator (blue colour) is shown as reference (PDB id: 5KW2). b Detection of ligand entrance/exit gateways sites through lipid insertions. Gateways identified by a dynamic lipid insertion into a rhodopsin (PDB id: 5DYS, GPCRmd id: 872 [https://www.gpcrmd.org/view/872], trajectory id: 16264). One insertion occurs at site TM5-TM6EC in the apo form system. In the absence of a ligand, the inserted lipid proceeds in this replicate to partially occupy the cavity at the beginning of the simulation. Another remarkable insertion occurs between TM1-TM7EC. Gatekeeper residues of the first (F2085x44, F2736x56 and F2766x59) and the second sites (Y431x38 and F2937x39) are represented in purple licorice. Density maps in red mark the sites that inserted lipids occupied during the simulations. See Supplementary Movies 2 and 3 for further details. Source data are provided in the Source Data file.
Fig. 5
Fig. 5. Flexibility of druggable allosteric sites.
a RMSD boxplots reflect the flexibility of druggable allosteric sites in the presence (complex) and absence (apo) of the ligand computed for a 4 Å region around the ligand (PDB three letter code of the complexed ligand is indicated). For this, the experimentally solved structure is taken as a reference structure. The RMSDs for each box are derived from 7500 simulation frames (n = 7500, i.e., 3 × 2500 frames with one frame corresponding to 0.2 ns). The centre line in boxplots represents the median while the box boundaries extend from the first (25%) and third (75%) quartile, representing the interquartile range (IQR). Boxplot whiskers extend to 1.5 × IQR and outliers are represented as circles. Statistical significance was assessed by a two-sided Mann-Whitney U test (P = 0.0 for all cases). b Surface representation of the experimentally solved allosteric site (white) in complex with the corresponding ligand (cyan). c Time evolution of the allosteric sites in the absence of the ligand (apo form) results in their complete (i.e., 5NDZ, 5TZR, 5TZY site 1) or partial closure (i.e., 5TZY site 2, 5KW2, 6C1Q, 6C1R) as indicated by red arrows. The original ligands have been superimposed to the simulated apo system’s surface to indicate the location of the initial pocket. The corresponding simulated time of pocket closure is provided in the insets. d Lipid penetration facilitates pockets site opening evolving from (c) at the indicated simulation time. E.g., the 5NDZ site closes at 117 ns and reopens at 216 ns. Simulation snapshots of (c) and (d) are taken from 5NDZ (GPCRmd ID: 1018 [https://www.gpcrmd.org/view/1018], trajectory ID: 17253), 5TZR (GPCRmd ID: 793 [https://www.gpcrmd.org/view/793], trajectory ID: 15725), 5TZY site 1 (GPCRmd ID: 928 [https://www.gpcrmd.org/view/928], trajectory ID: 16644), 5TZY site 2 (GPCRmd ID: 928 [https://www.gpcrmd.org/view/928], trajectory ID: 16645), 5KW2 (GPCRmd ID: 765 [https://www.gpcrmd.org/view/765], trajectory ID: 15539), 6C1Q (GPCRmd ID: 1084 [https://www.gpcrmd.org/view/1084], trajectory ID: 18343), 6C1R (GPCRmd ID: 1085 [https://www.gpcrmd.org/view/1085], trajectory ID: 18351). The original ligands have been superimposed to the simulated apo system’s surface to indicate the location of the initial pocket. e Searchable large scale collection of lipid insertions (left) and their visualisation on GPCRmd by mapping lipid distribution maps (orange volumetric map) on the 3D GPCR structure (right). Persistent lipid insertions are promising hotspots for allosteric sites and entrance channels. Source data are provided in the Source Data file.
Fig. 6
Fig. 6. Schematic representation of the simulation protocol used for the 2nd simulation round.
The parts included in the ‘Simulation Pipeline’ were performed automatically with a Python-based pipeline specifically designed for this purpose (https://github.com/GPCRmd/simulation_pipeline).

References

    1. Kristiansen, K. Molecular mechanisms of ligand binding, signaling, and regulation within the superfamily of G-protein-coupled receptors: molecular modeling and mutagenesis approaches to receptor structure and function. Pharmacol. Ther.103, 21–80 (2004). - PubMed
    1. Mederos, Y. & Schnitzler, M. et al. Gq-coupled receptors as mechanosensors mediating myogenic vasoconstriction. EMBO J.27, 3092–3103 (2008). - PMC - PubMed
    1. Hauser, A. S. et al. Pharmacogenomics of GPCR Drug Targets. Cell172, 41–54.e19 (2018). - PMC - PubMed
    1. Lopez-Balastegui, M. et al. Relevance of G protein-coupled receptor (GPCR) dynamics for receptor activation, signalling bias and allosteric modulation. Br. J. Pharmacol. 10.1111/bph.16495 (2024). - PubMed
    1. Torrens-Fontanals, M. et al. How do molecular dynamics data complement static structural data of GPCRs. Int. J. Mol. Sci.21, 5933 (2020). - PMC - PubMed

LinkOut - more resources