. 2025 Feb 27;16(1):2042.
doi: 10.1038/s41467-025-56532-3.

p85β acts as a transcription cofactor and cooperates with BCLAF1 in the nucleus

Affiliations

p85β acts as a transcription cofactor and cooperates with BCLAF1 in the nucleus

Panpan Wang et al. Nat Commun. .

Abstract

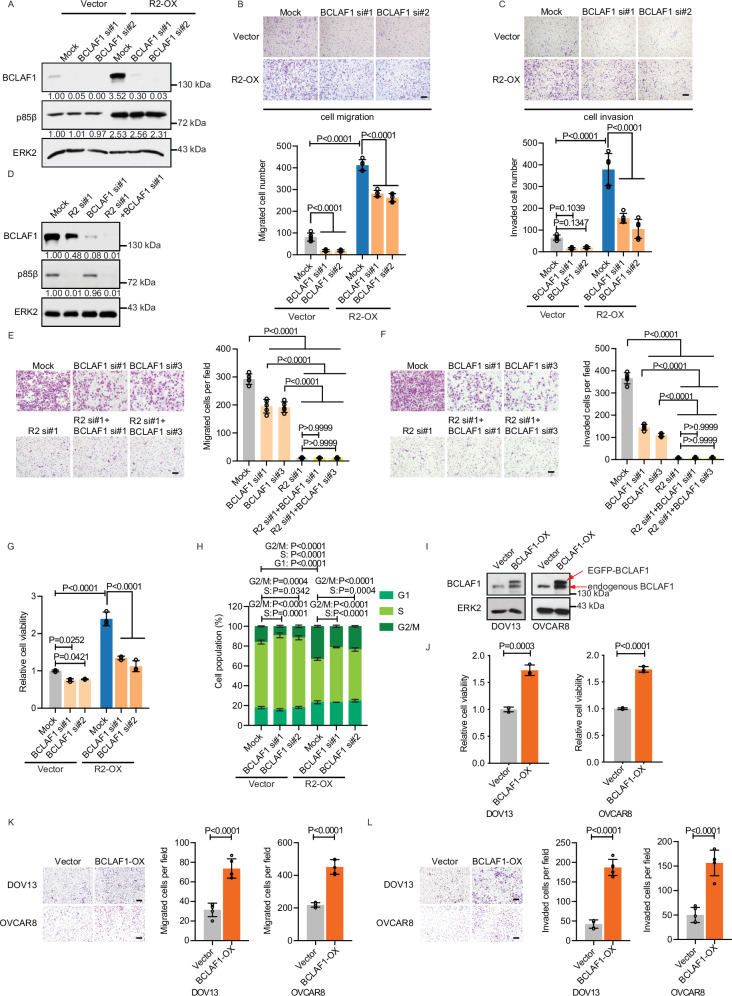
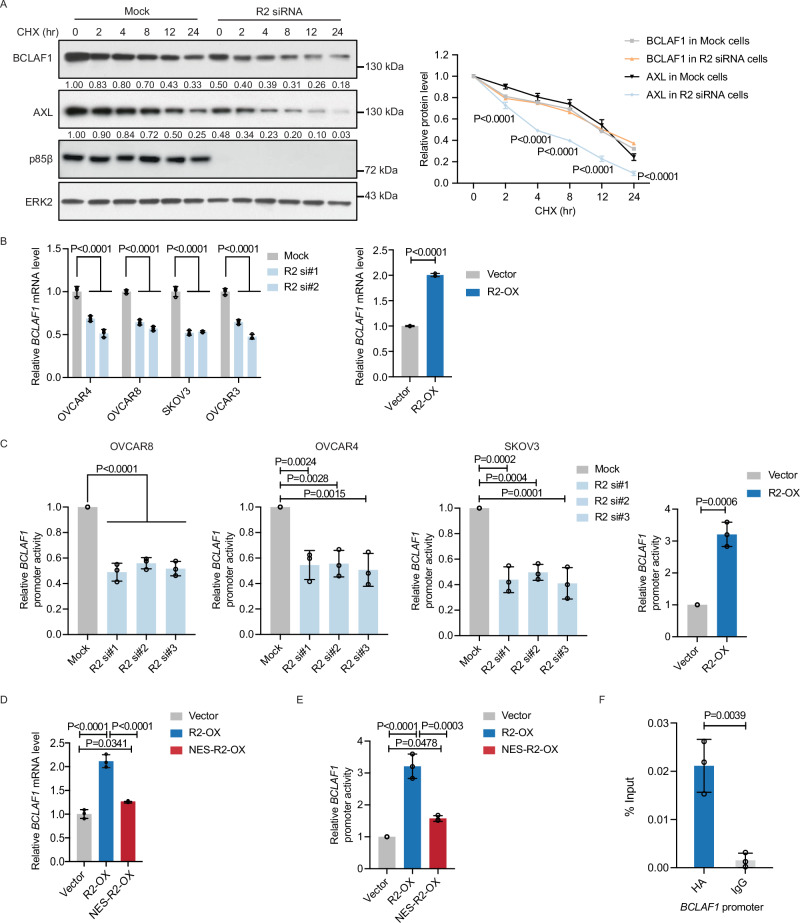
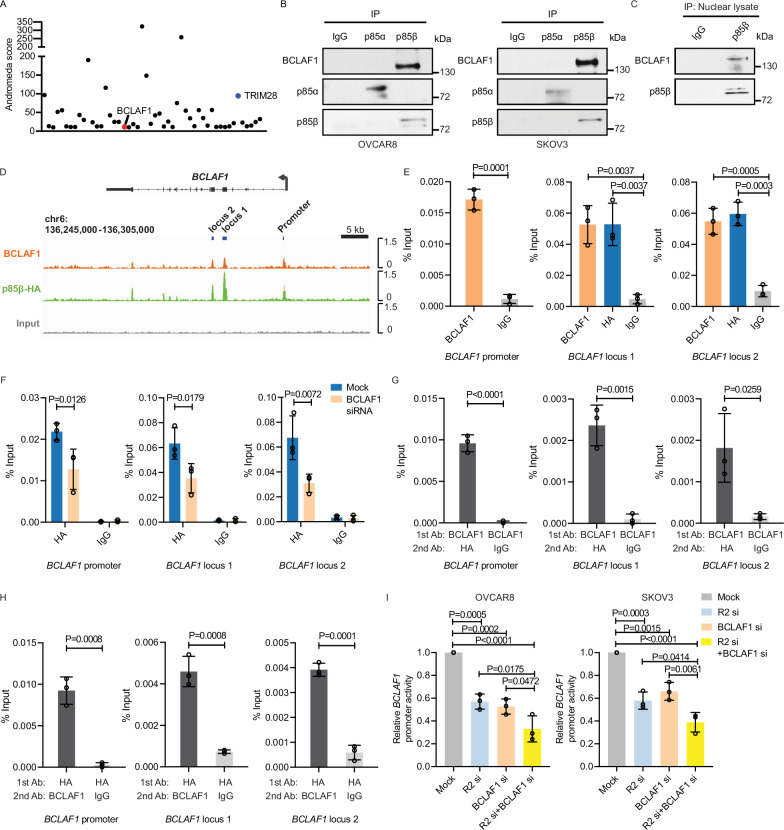
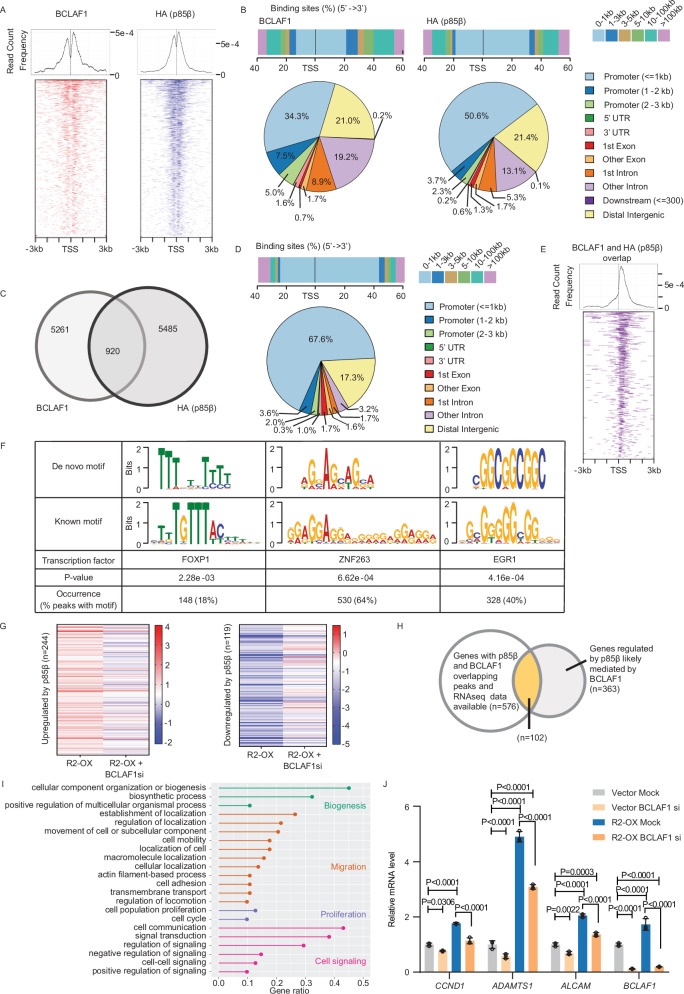
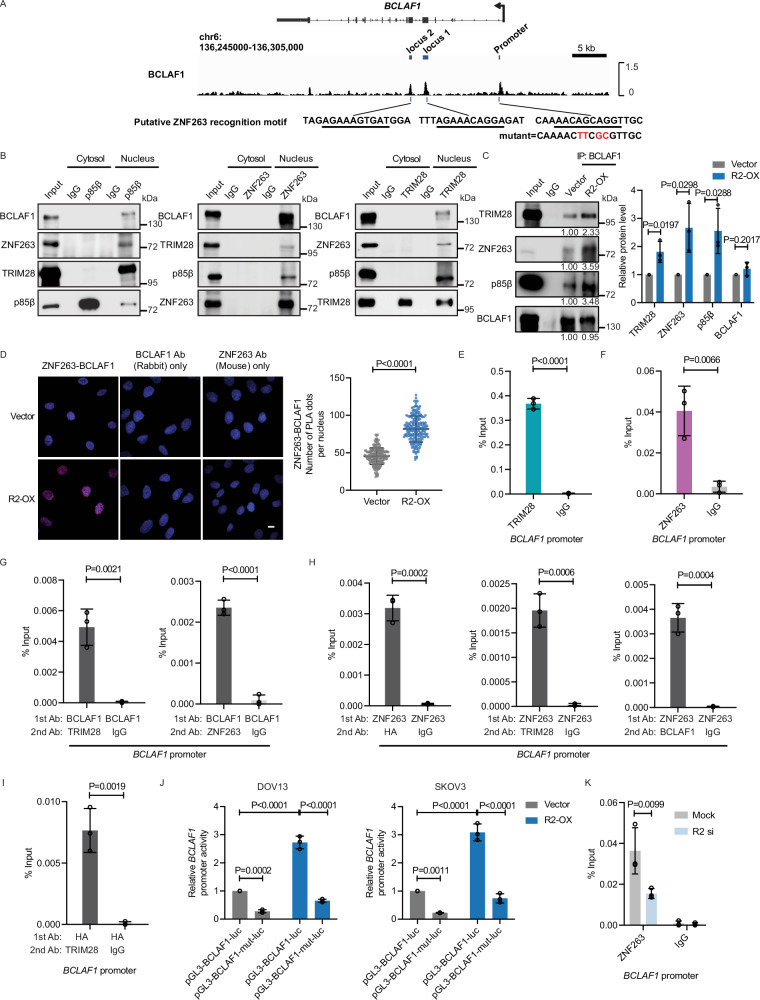
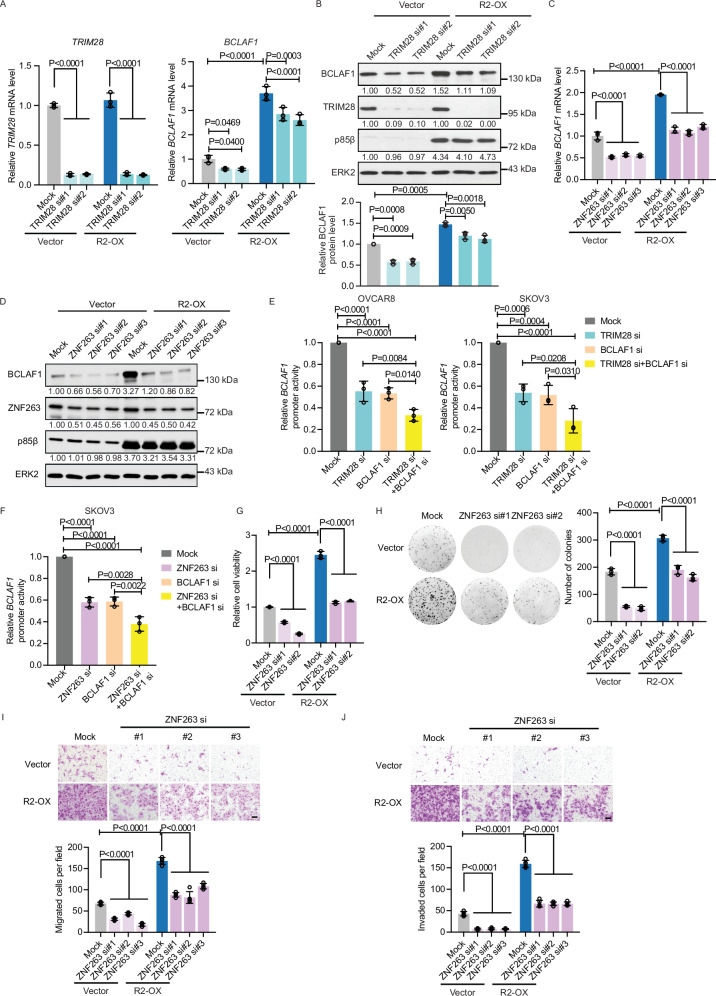
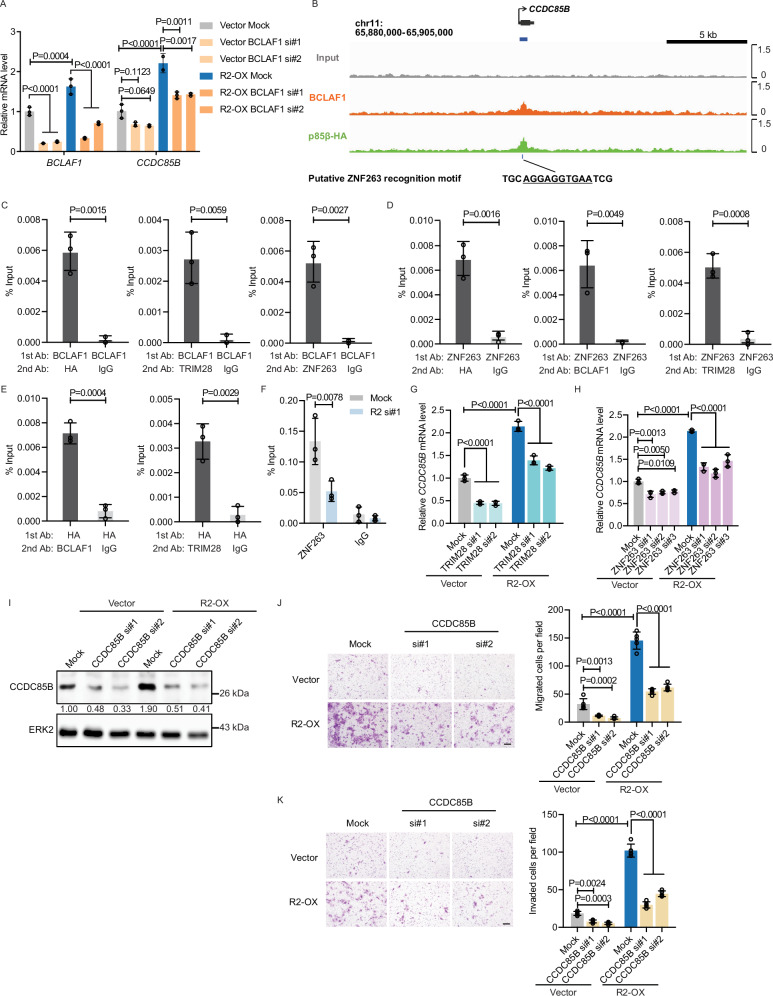
p85β is a regulatory subunit of the phosphoinositide 3-kinase (PI3K). Emerging evidence suggests that p85β goes beyond its role in the PI3K and is functional in the nucleus. In this study, we discover that nuclear p85β is enriched at gene loci and regulates gene transcription and that this regulatory role contributes to the oncogenic potential of nuclear p85β. A multi-omics approach reveals the physical interaction and functional cooperativity between nuclear p85β and a transcription factor BCLAF1. We observe genome-wide co-occupancy of p85β and BCLAF1 at gene targets associated with transcriptional responses. Intriguingly, the targetome includes BCLAF1 of which transcription is activated by p85β and BCLAF1, indicating a positive autoregulation. While BCLAF1 recruits p85β to BCLAF1 loci, p85β facilitates the assembly of BCLAF1, the scaffold protein TRIM28 and the zinc finger transcription factor ZNF263, which together act in concert to activate BCLAF1 transcription. Collectively, this study provides functional evidence and mechanistic basis to support a role of nuclear p85β in modulating gene transcription.


Conflict of interest statement

Competing interests: The authors declare no competing interests.

Figures

Fig. 1
Fig. 1. Nuclear p85β is oncogenic.
A Immunofluorescence staining of p85β (red; left panel), p85α (green; right panel) in OVCAR8 and SKOV3 cells. Nuclei (blue) were stained with DAPI. Scale bar, 10 µm. B Subcellular fractions were isolated and immunoblotted for p85β and p85α. GAPDH and lamin A/C served as markers of the cytoplasm and nucleus respectively. DOV13 or SKOV3 cells stably expressing PIK3R2 (R2-OX) or PIK3R2 with nuclear export signal (NES) at N-terminal (NES-R2-OX) or empty vector control (Vector) were subjected to (C) total protein harvest and western blotting with ERK2 as loading control, (D) subcellular fractionation, (E) cell viability assay, (F) colony formation assay, or transwell assay for (G) cell migration and (H) cell invasion capabilities. Scale bar, 200 μm (DOV13) or 100 μm (SKOV3). Assays in (E) were done in triplicates and data are shown as mean ± SD. The numbers of cells on the transwell membrane were counted in 5 random fields and data represent mean ± SD (G, H). All data and images shown are representative of 3 independent experiments, except that the bar graph in (F) shows the mean colony number ± SD from three independent experiments. The numbers below the western blots are densitometry values normalized to the loading control, except for those in (B), which are normalized to the cytosolic level. The P-values shown were calculated using one-way ANOVA with Tukey’s post hoc test. Source data are provided as a Source Data file.
Fig. 2
Fig. 2. Multi-omics analysis identifies BCLAF1 as potential downstream effector of nuclear p85β.
A Outline of the analyses to identify potential downstream effectors that mediate the transcriptional changes induced by p85β. B Heatmap showing the 13 transcription factor candidates from transcription factor enrichment analysis and with total and/or phosphorylated protein level changes after PIK3R2 knockdown. Names of the transcription factors are listed on the left of the heatmap and the detected phosphosites are on the right. Phosphosites with antibodies commercially available are marked with asterisks. C Transcription factor candidates with phosphorylation changes determined by mass spectrometry were examined by western blotting with cells transfected with 4 independent sequences of PIK3R2 siRNA for 72 h. ERK2 was loading control. D Total protein lysates of OVCAR8 and SKOV3 cells transfected with PIK3R2 siRNA for 72 h or DOV13 cells stably expressing PIK3R2 (R2-OX) or vector control were subjected to western blotting. E, F Subcellular fractionation was performed with (E) DOV13 stable cells or (F) SKOV3 cells transfected with PIK3R2 siRNA for 72 h prior to western blotting with GAPDH and lamin A/C as markers of the cytoplasm and nucleus respectively. G OVCAR8 cells were transfected with two PIK3R2 siRNA targeting the 5’ UTR for 24 h prior to lentivirus-mediated overexpression of PIK3R2 for another 48 h. H DOV13 or SKOV3 cells stably expressing PIK3R2 (R2-OX) or PIK3R2 with nuclear export signal (NES) at N-terminal (NES-R2-OX) or vector control were subjected to western blotting. I Serous ovarian tumor samples (n = 49) were examined by immunohistochemical staining for p85β and BCLAF1. Left, representative images and their magnified areas are shown. Scale bar, 50 μm. Right, immunostaining scores of BCLAF1 and nuclear p85β or cytoplasmic p85β were analyzed for Pearson’s correlation coefficient r with two-tailed P-value and are depicted in scatter plot. The western blots are representative of n = 3 biological replicates and densitometry values normalized to the loading control are shown (CH). Source data are provided as a Source Data file.
Fig. 3
Fig. 3. BCLAF1 is an oncogene that contributes to p85β oncogenicity.
AC DOV13 stable cells expressing vector or PIK3R2 (R2-OX) were transfected with BCLAF1 siRNA for 72 h, followed by (A) western blotting for the knockdown efficiency with ERK2 as loading control, or (B) cell migration assay, or (C) cell invasion assay. DF OVCAR8 cells were transfected with PIK3R2 siRNA or BCLAF1 siRNA alone or in combination for 72 h. Cells were harvested for (D) western blotting, (E) cell migration or (F) invasion assay. G, H DOV13 stable cells expressing vector or PIK3R2 (R2-OX) were transfected with BCLAF1 siRNA. Cells were subjected to (G) cell viability assay or (H) cell cycle analysis. IL DOV13 and OVCAR8 cells stably expressing BCLAF1 (BCLAF1-OX) or vector control were harvested for (I) western blotting, (J) cell viability assay, (K) cell migration assay, or (L) invasion assay. Assays in (G, J) were done in triplicates and data are shown as mean ± SD. The numbers of cells on the transwell membrane were counted in 5 random fields and data represent mean ± SD (B, C, E, F, K, L). Data and images shown are representative of 3 independent experiments, except data in H which shows the mean of 3 independent experiments ± SD. The numbers below the western blots are densitometry values normalized to the loading control. Scale bar, 200 μm (B, C, K, L); 100 μm (E, F). The P-values shown were calculated using two-way ANOVA with Tukey’s post hoc test (B, C, EH) or two-tailed t-test (JL). Source data are provided as a Source Data file.
Fig. 4
Fig. 4. Regulation of BCLAF1 by p85β is at transcriptional level.
A SKOV3 cells were transfected with PIK3R2 siRNA for 60 hr, followed by treatment of 20 μg/mL cycloheximide (CHX) for the indicated time course. ERK2 was a loading control. The mean densitometry values ± SD of BCLAF1 or AXL levels normalized with that of ERK2 from three independent experiments are plotted. B Real-time PCR analysis of BCLAF1 mRNA expression in (left) ovarian cancer cell lines with PIK3R2 silencing (R2 si) for 72 h or (right) DOV13 stable cells expressing vector (Vector) or PIK3R2 (R2-OX). C Left, OVCAR8, OVCAR4 and SKOV3 cells were transfected with PIK3R2 siRNA for 48 h prior to co-transfection of pRL-TK Renilla luciferase plasmid and human BCLAF1 promoter luciferase plasmid or pGL3-Basic plasmids for another 48 h. Right, SKOV3 stable cells expressing vector or PIK3R2 (R2-OX) were transfected with the luciferase plasmids for 48 h. D Real-time PCR analysis of BCLAF1 mRNA expression in DOV13 cells stably expressing PIK3R2 (R2-OX) or PIK3R2 with nuclear export signal (NES) at N-terminal (NES-R2-OX) or vector control. E SKOV3 R2-OX or NES-R2-OX or vector-expressing cells were transfected with pRL-TK Renilla luciferase plasmids and human BCLAF1 promoter luciferase plasmid or pGL3-Basic plasmids for 48 h prior to dual luciferase reporter assay. F Cross-linked chromatin from DOV13 cells stably expressing PIK3R2 was immunoprecipitated with anti-HA antibody or rabbit IgG control. The precipitated DNA was analyzed by real-time PCR using BCLAF1 promoter-specific primers. The blots in (A) and data shown in (B, D) are representative of three independent experiments and data represent mean ± SD. Each individual data point in (C, E, F) represents the average of triplicates from one independent experiment; therefore, the data shown (mean ± SD) are from three independent experiments. P-values were calculated using two-way ANOVA with Bonferroni multiple comparison test (A), one-way ANOVA with Tukey’s post hoc test (B left, C left, D, E) or two-tailed t-test (B right, C right, F). Source data are provided as a Source Data file.
Fig. 5
Fig. 5. p85β and BCLAF1 co-occupy BCLAF1 loci.
A The dots in the scatterplot of Andromeda scores (at an arbitrarily cut-off of 10) represent p85β-interacting proteins detected with one or more unique peptides by mass spectrometry and with reported roles in transcriptional regulation in the nucleus. B Total protein lysates of OVCAR8 and SKOV3 cells were subjected to immunoprecipitation (IP) with anti-p85α antibody or anti-p85β antibody. IP with normal IgG was control. C Nuclear extract of DOV13 stably expressing PIK3R2 were subjected to IP with anti-p85β antibody. D ChIP-seq was performed using anti-HA antibody or anti-BCLAF1 antibody in DOV13 cells stably expressing PIK3R2. ChIP-seq tracks for HA and BCLAF1 over the BCLAF1 gene and input signal are shown. E Cross-linked chromatin from DOV13 cells stably expressing PIK3R2 was immunoprecipitated with anti-HA antibody or anti-BCLAF1 antibody or rabbit IgG. DNA fragments were amplified with primers for (left) BCLAF1 promoter, (middle) locus 1 and (right) locus 2. F ChIP-PCR analysis of chromatin enrichment of HA (p85β) at the BCLAF1 loci in DOV13 stably expressing PIK3R2 transfected with BCLAF1 siRNA for 72 h. G, H re-ChIP experiments were performed using (G) anti-BCLAF1 antibody and anti-HA antibody or IgG control, or (H) anti-HA antibody and anti-BCLAF1 antibody or IgG control. I Cells were transfected with PIK3R2 siRNA or BCLAF1 siRNA alone or in combination for 48 h prior to co-transfection of Renilla luciferase plasmid and BCLAF1 promoter luciferase reporter or pGL3-Basic plasmid for another 48 h. The blots in (B, C) are representative of three independent experiments. The ChIP-seq data in (D) are from triplicates and the experiment was done once. Each individual data point in (EI) represents the average of triplicates from one independent experiment; therefore, the data shown (mean ± SD) are from three independent experiments. P-values were calculated using two-tailed t-test (E left, G, H) or one-way ANOVA with Tukey’s post hoc test (E middle and right, I) or two-way ANOVA with Tukey’s post hoc test (F). Source data are provided as a Source Data file.
Fig. 6
Fig. 6. Genome-wide analysis of the cooperativity between p85β and BCLAF1 in transcriptional control.
A ChIP-seq was performed using anti-BCLAF1 antibody or anti-HA antibody in DOV13 cells stably expressing PIK3R2. Average plot (top) and heatmap (bottom) of BCLAF1 or HA-p85β ChIP-seq read density within ±3 kb from an annotated transcription start site (TSS) are shown. B Top, distribution of BCLAF1 or HA-p85β ChIP-seq peaks relative to the closest TSS. Bottom, pie charts showing distribution of annotated genomic features of BCLAF1 or HA-p85β ChIP-seq peaks. C Venn diagram of overlapping binding regions between BCLAF1 and HA-p85β. D Top, distribution of BCLAF1 and HA-p85β overlapping ChIP-seq peaks relative to the closest TSS. Bottom, distribution of annotated genomic features of BCLAF1 and HA-p85β overlapping ChIP-seq peaks. E Average plot (top) and heatmap view (bottom) of BCLAF1 and HA-p85β overlapping ChIP-seq peaks within TSS ± 3 kb regions. F De novo motif enrichment on BCLAF1 and HA-p85β overlapping ChIP-seq peaks using MEME and TOMTOM. Shown are matches ranked top 3 by statistical significance. P-values were obtained by two-sided likelihood ratio test. G DOV13 cells stably expressing vector or PIK3R2 (R2-OX) were mock-transfected or transfected with BCLAF1 siRNA for 72 hr prior to RNA-seq. The heatmaps show log2-transformed fold changes of p85β-induced differentially expressed genes (DEGs) mediated by BCLAF1, which were defined when the changes observed in R2-OX were reversed upon BCLAF1 depletion (R2-OX+BCLAF1si). H Overlap between genes associated with p85β and BCLAF1 overlapping ChIP-seq peaks and p85β-induced DEGs mediated by BCLAF1. I Gene Ontology (GO) classification of the potential p85β and BCLAF1 co-regulated genes (n = 102). Y-axis represents GO biological process terms and X-axis represents the gene ratio (the number of DEGs against the number of genes associated with the GO term). Classified processes with gene ratio>0.1 are shown. J mRNA levels of CCND1, ADAMTS1 and ALCAM from RNA-seq data. Data represent mean ± SD. P-values were obtained using two-way ANOVA with Tukey’s post hoc test. These ChIP-seq and RNA-seq data were generated from biological triplicates. Source data are provided as a Source Data file.
Fig. 7
Fig. 7. A protein complex containing p85β/BCLAF1/TRIM28/ZNF263 binds to and regulates BCLAF1 promoter.
A A schematic of the BCLAF1 gene showing the putative ZNF263 recognition motif within locus 1, locus 2 and promoter region. The mutated nucleotides within the motif in the mutant BCLAF1 promoter reporter are highlighted in red. B Cytoplasmic and nuclear extracts of OVCAR8 cells were subjected to immunoprecipitation (IP) with anti-p85β antibody, anti-ZNF263 antibody or anti-TRIM28 antibody. IP with IgG was control and input represents total cell lysate. C Lysates of SKOV3 stably expressing vector or PIK3R2 (R2-OX) were subjected to IP with anti-BCLAF1 antibody. BCLAF1 protein levels were normalized prior to IP by using proportional amounts of lysates. The numbers below the blots are densitometry values relative to vector control. The bar graphs display the mean relative densitometry values from three independent experiments. D SKOV3 cells were subjected to proximity ligation assay with anti-ZNF263 and anti-BCLAF1 antibodies. The individual antibody alone served as negative control. The number of signals per nucleus of 200 cells from three independent experiments is presented as mean ± SD. Scale bars, 9 μm. E, F Cross-linked chromatin from DOV13 cells stably expressing PIK3R2 was immunoprecipitated with (E) anti-TRIM28 antibody or (F) anti-ZNF263 antibody or rabbit IgG. DNA fragments were amplified with primers for BCLAF1 promoter. GI re-ChIP was performed with the indicated sequence of antibodies, with the first antibody against (G) BCLAF1, (H) ZNF263 or (I) HA. Normal rabbit IgG in second ChIP served as control. J DOV13 or SKOV3 cells were transfected with human WT (pGL3-BCLAF1-luc) or mutant (pGL3-BCLAF1-mut-luc) BCLAF1 promoter luciferase reporter or pGL3-Basic plasmid for 48 h. K ChIP-PCR for ZNF263 at BCLAF1 promoter in SKOV3 cells transfected with PIK3R2 siRNA for 72 h. The blots in (B, C) are representative of three independent experiments. Each individual data point in (EK) represents the average of triplicates from one independent experiment; therefore, the data shown (mean ± SD) are from three independent experiments. P-values were obtained using two-tailed t-test (CI) or two-way ANOVA with Tukey’s post hoc test (J, K). Source data are provided as a Source Data file.
Fig. 8
Fig. 8. ZNF263 and TRIM28 activate BCLAF1 transcription.
AD DOV13 stable cells expressing vector or PIK3R2 (R2-OX) were transfected with (A, B) TRIM28 siRNA or (C, D) ZNF263 siRNA for 72 h, followed by (A, C) real-time PCR and (B, D) western blotting with ERK2 as loading control. OVCAR8 and SKOV3 cells were transfected with (E) BCLAF1 siRNA or TRIM28 siRNA alone or in combination or (F) BCLAF1 siRNA or ZNF263 siRNA alone or in combination for 48 hr prior to co-transfection of Renilla luciferase plasmid and human BCLAF1 promoter reporter or pGL3-Basic plasmid for another 48 h. GJ DOV13 stable cells expressing vector or PIK3R2 (R2-OX) were transfected with ZNF263 siRNA for 72 h, followed by (G) cell viability assay, (H) colony formation assay, or transwell assay for (I) cell migration or (J) cell invasion capabilities. Scale bar, 100 μm. Data (mean ± SD) in (A, C, G, I, J) and images in (B, D, H) are representative of three independent experiments. The bar graph in (H) shows the mean colony number ± SD from three independent experiments. The bar graph in (B) displays the mean relative densitometry values from three independent experiments. The numbers below the blots in (B, D) are densitometry values of the representative blots. Each individual data point in (E, F) represents the average of triplicates from one independent experiment; therefore, the data shown (mean ± SD) are from three independent experiments. The numbers of cells on the transwell membrane were counted in 5 random fields and data represent mean ± SD (I, J). P-values were calculated using two-way ANOVA with Tukey’s post hoc test (AC, GJ) or one-way ANOVA with Tukey’s post hoc test (E, F). Source data are provided as a Source Data file.
Fig. 9
Fig. 9. CCDC85B is co-regulated by p85β, BCLAF1, TRIM28 and ZNF263.
A DOV13 stable cells expressing vector or PIK3R2 (R2-OX) were transfected with BCLAF1 siRNA for 72 h, followed by real-time PCR. B A schematic of the CCDC85B gene showing the locations of putative ZNF263 recognition motif. CE re-ChIP experiments were performed with the indicated sequence of antibodies. The first ChIP was performed using antibody against (C) BCLAF1 or (D) ZNF263 or (E) HA (p85β). Normal rabbit IgG in second ChIP served as control. F ChIP-PCR analysis of chromatin enrichment of ZNF263 at CCDC85B locus in SKOV3 cells transfected with PIK3R2 siRNA for 72 h. G, H DOV13 stable cells expressing vector or PIK3R2 (R2-OX) were transfected with (G) TRIM28 siRNA or (H) ZNF263 siRNA for 72 h, followed by real-time PCR. IK DOV13 stable cells expressing vector or PIK3R2 (R2-OX) were transfected with CCDC85B siRNA for 72 h, followed by (I) western blotting for the knockdown efficiency of CCDC85B with ERK2 as loading control, or (J) cell migration assay, or (K) cell invasion assay. Scale bar, 100 μm. Data and images in (A, GK) are representative of three independent experiments with the bar graphs showing mean ± SD. Each individual data point in (CF) represents the average of triplicates from one independent experiment; therefore, the data shown (mean ± SD) are from three independent experiments. The numbers below the western blots are densitometry values normalized to the loading control (I). The numbers of cells on the transwell membrane were counted in 5 random fields and data represent mean ± SD (J, K). P-values were calculated using two-way ANOVA with Tukey’s post hoc test (A, FH, J, K) or two-tailed t-test (CE). Source data are provided as a Source Data file.

References

    1. Engelman, J. A., Luo, J. & Cantley, L. C. The evolution of phosphatidylinositol 3-kinases as regulators of growth and metabolism. Nat. Rev. Genet.7, 606–619 (2006). - PubMed
    1. Ito, Y., Hart, J. R., Ueno, L. & Vogt, P. K. Oncogenic activity of the regulatory subunit p85beta of phosphatidylinositol 3-kinase (PI3K). Proc. Natl Acad. Sci. USA111, 16826–16829 (2014). - PMC - PubMed
    1. Luo, J. et al. Modulation of epithelial neoplasia and lymphoid hyperplasia in PTEN+/- mice by the p85 regulatory subunits of phosphoinositide 3-kinase. Proc. Natl Acad. Sci. USA102, 10238–10243 (2005). - PMC - PubMed
    1. Cortes, I. et al. p85beta phosphoinositide 3-kinase subunit regulates tumor progression. Proc. Natl Acad. Sci. USA109, 11318–11323 (2012). - PMC - PubMed
    1. Cariaga-Martinez, A. E. et al. Phosphoinositide 3-kinase p85beta regulates invadopodium formation. Biol. Open3, 924–936 (2014). - PMC - PubMed

MeSH terms

Substances

LinkOut - more resources