. 2025 Feb 27;16(1):2021.
doi: 10.1038/s41467-025-57308-5.

Circulating miR-126-3p is a mechanistic biomarker for knee osteoarthritis

Affiliations

Circulating miR-126-3p is a mechanistic biomarker for knee osteoarthritis

Thomas G Wilson et al. Nat Commun. .

Abstract

Osteoarthritis is a major contributor to pain and disability worldwide, yet there are currently no validated soluble biomarkers or disease-modifying treatments. Given that microRNAs are promising mechanistic biomarkers that can be therapeutically targeted, in this study, we aimed to identify and prioritize reproducible circulating microRNAs associated with radiographic knee osteoarthritis. Across four independent cohorts, we find circulating miR-126-3p is elevated in knee osteoarthritis versus controls. Across six primary human knee osteoarthritis tissues, miR-126-3p is highest in subchondral bone, fat pad and synovium, and lowest in cartilage. Following both intravenous and intra-articular miR-126-3p mimic treatment in a surgical mouse model of knee osteoarthritis, we show reduced disease severity in males. In human knee osteoarthritis biospecimens, miR-126-3p mimic treatment reduces genes and markers associated with angiogenesis, as well as genes linked to osteogenesis, adipogenesis, and synovitis-processes secondary to angiogenesis. Our findings indicate that miR-126-3p is elevated in knee osteoarthritis and mitigates disease severity, supporting its potential as a biomarker and therapeutic target.


Conflict of interest statement

Competing interests: The authors declare no competing interests.

Figures

Fig. 1
Fig. 1. Circulating miR-126-3p is elevated in knee OA versus non-OA in two independent microRNA-sequencing datasets.
A Overview of secondary analysis of two microRNA-sequencing datasets analyzed according to a customized analysis pipeline. Left and right columns show details from the original analyses of Cohort 1 and Cohort 2, respectively, while the center column highlights our modifications and results. KL Kellgren-Lawrence grade, TJA total joint arthroplasty, CPM counts-per-million, TMM trimmed mean of m-values. B Three differentially expressed (DE) microRNAs in knee OA versus non-OA were common in both datasets. LogCPM log2 counts-per-million, logFC log2 fold-change, unadjusted p-values determined by two-sided quasi-likelihood F-test.
Fig. 2
Fig. 2. Circulating miR-126-3p distinguishes radiographic knee OA with excellent accuracy.
A Relative miR-126-3p levels in plasma samples collected from the Henry Ford Health (HFH) OA Cohort, stratified by joint and KL grade (Non-OA: n = 20, KL 0 Knee: n = 20, KL 1 Knee: n = 10, KL 2 Knee: n = 10, KL 3 Knee: n = 30, KL 4 Knee: n = 30, KL ≥ 3 Hip: n = 25 biological replicates). Values represent fold-change relative to the mean value of non-OA controls. Bars represent mean fold-change ± 95% confidence interval, statistical significance determined by two-sided Mann–Whitney U test with Benjamini-Hochberg correction, *p < 0.05 versus non-OA. B Multiple linear regression analysis assessing the association of each variable with plasma miR-126-3p levels in knee OA. BMI body mass index, 95% CI 95% confidence interval. Statistical significance for regression coefficients determined by two-sided t-tests. C Receiver operating characteristic curve analysis of a test cohort of HFH OA plasma samples displaying the accuracy of two models in distinguishing radiographic knee and hip OA. Black line represents a model consisting of age, sex and BMI; red line represents a model consisting of age, sex, BMI and relative miR-126-3p plasma levels. AUC area under the receiver operating characteristic curve, p = versus age, sex, BMI only, statistical significance determined by two-sided DeLong’s test. Source data are provided as a Source Data file. P-values: A p = 0.214 (KL 0 Knee), p = 0.214 (KL 1 Knee), p = 0.010 (KL 2 Knee), p = 0.000 (KL 3 Knee), p = 0.000 (KL 4 Knee), p = 0.244 (KL ≥ 3 Hip).
Fig. 3
Fig. 3. Knee OA fat pad is a putative source of miR-126-3p and subchondral bone a putative sink.
A Mature miR-126-3p levels in six primary human knee OA tissues (n = 7 biological replicates). Data represent fold-change values relative to mean cartilage expression. Bars represent mean fold-change ± 95% confidence interval. Statistical significance determined by one-way ANOVA with two-sided Dunnett’s post hoc test, *p < 0.05 versus cartilage. B Pearson correlation analysis between miR-126-3p levels in matched tissue and plasma samples from knee OA individuals (n = 18 biological replicates). R = correlation coefficient. P-values determined by two-sided t-test for Pearson correlation. C Overview of miR-126-3p production showing key factors measured in six primary human knee OA tissues, including (D) pri-mir-126, (E) DROSHA, (F) pre-mir-126 and (G) DICER1. Created in BioRender. Wilson, T. (2025) https://BioRender.com/q28v824. DG Data represent fold-change values relative to mean cartilage expression (n = 7 biological replicates). Bars represent mean ± 95% confidence interval. Statistical significance determined by one-way ANOVA with two-sided Dunnett’s post hoc test, *p < 0.05 versus cartilage. H Overview of experimental design for assessing miR-126-3p secretion over time. Created in BioRender. Wilson, T. (2025) https://BioRender.com/b86a692. I Secretion of miR-126-3p from knee OA tissues. Data fitted from miR-126-3p fold-change values relative to a reference microRNA (miR-24-3p) at each timepoint [n = 4 biological replicates (cartilage, meniscus, ligament), n = 7 biological replicates (synovium, fat pad, subchondral bone)], black line = fitted linear model, grey region = 95% confidence interval. Source data are provided as a Source Data file. P-values: A p = 0.003 (meniscus), p = 0.000 (ligament), p = 0.000 (synovium), p = 0.000 (fat pad), p = 0.000 (subchondral bone). D p = 0.770 (meniscus), p = 0.005 (ligament), p = 0.000 (synovium), p = 0.000 (fat pad), p = 0.118 (subchondral bone). E p = 0.996 (meniscus), p = 0.992 (ligament), p = 1.000 (synovium), p = 0.040 (fat pad), p = 0.948 (subchondral bone). F p = 0.991 (meniscus), p = 0.993 (ligament), p = 0.994 (synovium), p = 0.001 (fat pad), p = 0.998 (subchondral bone). G p = 0.721 (meniscus), p = 0.771 (ligament), p = 0.560 (synovium), p = 0.000 (fat pad), p = 1.000 (subchondral bone).
Fig. 4
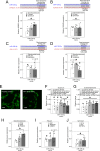
Fig. 4. miR-126-3p improves outcomes in a surgical mouse model of knee OA.
A Overview of experimental design for mouse surgery, treatments and endpoints. w weeks-old, PMX partial medial meniscectomy, IV intravenous. Created in BioRender. Wilson, T. (2025) https://BioRender.com/x45j911. B Plasma miR-126-3p levels in PMX versus sham mice at 4-weeks post-surgery (16w) relative to pre-surgery (12w) in negative control groups (n = 5 biological replicates). Bars represent mean ± 95% confidence interval, *p < 0.05. C Representative coronal sections of mouse operated knee stained with Safranin-O. Scale bars = 1 mm. Insets show magnified regions (scale bars = 100 µm, arrows = examples of cartilage damage). D OARSI scoring by blinded observers of PMX and sham mice following miR-126-3p treatments (n = 5 biological replicates). Bars represent mean maximal quadrant score ± 95% confidence interval, *p < 0.05. E Representative sections of synovium from mouse operated knee. Scale bars = 100 µm, arrows = examples of synovitis. F Krenn synovitis scoring by blinded observers (n = 5 biological replicates). Bars represent mean synovitis score ± 95% confidence interval, *p < 0.05. G Representative sections of mouse operated knee stained for cluster of differentiation (CD31). Scale bars = 200 µm. Insets show magnified regions of synovium (“S”) and subchondral bone (“B”); scale bars = 50 µm, arrows = examples of CD31 staining corresponding to endothelial cells. Source data are provided as a Source Data file. All statistical significance determined by unadjusted two-sided Student’s t-test. P-values: B p = 0.018. D p = 0.030 (miR-126-3p mimic vs. negative control), p = 0.046 (miR-126-3p mimic vs. miR-126-3p inhibitor). F p = 0.150 (miR-126-3p mimic vs. negative control), p = 0.029 (miR-126-3p mimic vs. miR-126-3p inhibitor).
Fig. 5
Fig. 5. miR-126-3p shows anti-angiogenic effects in primary human knee OA tissues.
AD Seed sequence binding site locations and gene expression fold-changes in direct gene targets of miR-126-3p in knee OA tissue explants following transfection with miR-126-3p mimic (n = 5 biological replicates). E Representative images of primary human endothelial cells from knee OA subchondral bone stained with fluorescent dye to visualize 3D tube formation following transfection with miR-126-3p mimic. Scale bars = 200 µm. F, G Metrics associated with angiogenesis measured following transfection with miR-126-3p mimic in endothelial cells isolated from primary knee OA tissues (n = 5 biological replicates). HJ Gene expression fold-changes in knee OA subchondral bone, fat pad and synovium tissue explants following transfection with miR-126-3p mimic (n = 5 biological replicates). Data represented relative to negative control treated tissues/cells (dashed line, set to 1.0). Bars represent mean ± 95% confidence interval, *p < 0.05 versus matched negative control. SPRED1 sprouty related EVH1 domain containing 1, ADAM9 a disintegrin and metalloproteinase domain 9, IRS1 insulin receptor substrate 1, VEGFA vascular endothelial growth factor A, OSX osterix, OCN osteocalcin, RUNX2 runt-related transcription factor 2, CEBPA CCAAT/enhancer-binding protein-alpha, ADIPOQ adiponectin, LEP leptin, IL1b interleukin 1 beta, IL6 interleukin 6, TNFa tumor necrosis factor alpha. Source data are provided as a Source Data file. All statistical significance determined by paired two-sided Student’s t-test. P-values: A p = 0.007 (subchondral bone), p = 0.006 (fat pad), p = 0.008 (synovium). B p = 0.001 (subchondral bone), p = 0.026 (fat pad), p = 0.034 (synovium). C p = 0.026 (subchondral bone), p = 0.033 (fat pad), p = 0.177 (synovium). D p = 0.130 (subchondral bone), p = 0.002 (fat pad), p = 0.030 (synovium). F p = 0.035 (junctions density), p = 0.029 (total number of junctions), p = 0.046 (vessels percentage area), p = 0.051 (total vessels length), p = 0.034 (total number of end points). G p = 0.010 (junctions density), p = 0.034 (total number of junctions), p = 0.045 (vessels percentage area), p = 0.049 (total vessels length), p = 0.011 (total number of end points). H p = 0.000 (OCN), p = 0.023 (OSX), p = 0.047 (RUNX2). I p = 0.000 (LEP), p = 0.013 (ADIPOQ), p = 0.106 (CEPBA). J p = 0.009 (IL1b), p = 0.001 (IL6), p = 0.031 (TNFa).
Fig. 6
Fig. 6. Proposed mechanism of action of miR-126-3p in knee OA.
Our data suggest circulating levels of miR-126-3p become elevated in KL ≥ 2 knee OA via increased production and secretion by endothelial cells within the fat pad (A), and to a lesser extent, from the synovium (B). From circulation, miR-126-3p is then able to act distally, including in endothelial cells in the subchondral bone (C). Within each tissue, miR-126-3p regulates its direct gene targets including SPRED1, ADAM9, IRS1, and VEGFA, leading to a net reduction in angiogenesis. This anti-angiogenic effect in turn leads to secondary effects on adipogenesis in fat pad, synovitis in synovium, and osteogenesis in subchondral bone. Created in BioRender. Wilson, T. (2025) https://BioRender.com/d38r039.

References

    1. Collaborators GBDO. Global, regional, and national burden of osteoarthritis, 1990-2020 and projections to 2050: a systematic analysis for the Global Burden of Disease Study 2021. Lancet Rheumatol.5, e508–e522 (2023). - PMC - PubMed
    1. Buckwalter, J. A. & Mankin, H. J. Articular cartilage: degeneration and osteoarthritis, repair, regeneration, and transplantation. Instr. Course Lect.47, 487–504 (1998). - PubMed
    1. Loeser, R. F., Goldring, S. R., Scanzello, C. R. & Goldring, M. B. Osteoarthritis: a disease of the joint as an organ. Arthritis Rheum.64, 1697–1707 (2012). - PMC - PubMed
    1. Kolasinski, S. L. et al. 2019 American college of rheumatology/arthritis foundation guideline for the management of osteoarthritis of the hand, hip, and knee. Arthritis Care Res.72, 220–233 (2020). - PMC - PubMed
    1. Rocha, F. A. C. & Ali, S. A. Soluble biomarkers in osteoarthritis in 2022: year in review. Osteoarthr. Cartil.31, 167–176 (2023). - PubMed

LinkOut - more resources