. 2025 Feb 27;8(1):324.
doi: 10.1038/s42003-025-07754-0.

FABP5 is a key player in metabolic modulation and NF-κB dependent inflammation driving pleural mesothelioma

Affiliations

FABP5 is a key player in metabolic modulation and NF-κB dependent inflammation driving pleural mesothelioma

Eleonora Vecchio et al. Commun Biol. .

Abstract

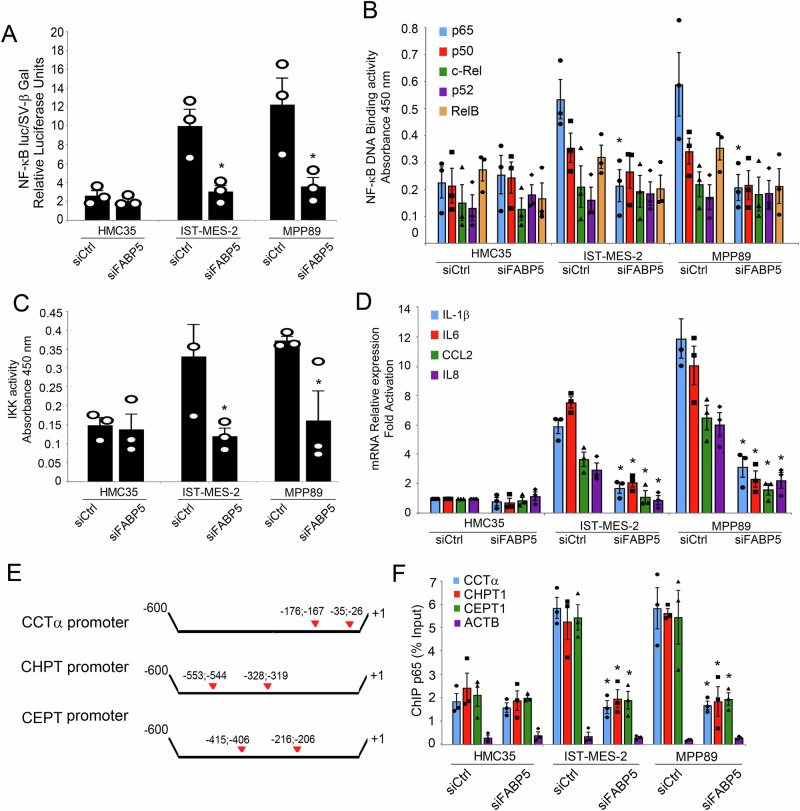
Pleural mesothelioma (PM) poses a significant challenge in oncology due to its intricate molecular and metabolic landscape, chronic inflammation, and heightened oxidative stress, which contribute to its notorious resilience and clinical complexities. Despite advancements, the precise mechanisms driving PM carcinogenesis remain elusive, impeding therapeutic progress. Here, we explore the interplay between tumor growth dynamics, lipid metabolism, and NF-κB dysregulation in malignant pleural mesothelioma, shedding light on novel molecular mechanisms underlying its pathogenesis. Our study reveals distinctive growth dynamics in PM cells, characterized by heightened proliferation, altered cell cycle progression, and resistance to apoptosis. Intriguingly, PM cells exhibit increased intracellular accumulation of myristic, palmitic, and stearic acids, suggestive of augmented lipid uptake and altered biosynthesis. Notably, we identify FABP5 as a key player in driving metabolic alterations and inflammation through NF-κB dysregulation in mesothelioma cells, distinguishing them from normal mesothelial cells. Silencing of FABP5 leads to significant alterations in cell dynamics, metabolism, and NF-κB activity, highlighting its potential as a therapeutic target. Our findings unveil a reciprocal relationship between lipid metabolism and inflammation in PM, providing a foundation for targeted therapeutic strategies. Overall, this comprehensive investigation offers insights into the intricate molecular mechanisms driving PM pathogenesis and identifies potential avenues for therapeutic intervention.


Conflict of interest statement

Competing interests: The authors declare no competing interests. Informed consent: All authors have read and approved the final version of the manuscript.

Figures

Fig. 1
Fig. 1. Mesothelioma cell lines showed an impaired metabolic landscape.
A ADP/ATP Ratio Assay of IST-Mes-2, MPP89, and HMC35 cells was assessed. B NAD + /NADH ratio assay of IST-Mes-2, MPP89, and HMC35 cells was shown. C A bar diagram showing mitochondrial activity measured by Mitotracker assay. HMC5, IST-Mes-2, or MPP89 cells were stained with mitotracker red for 30 min and then analyzed by flow cytometry. The values were represented by MFI ± SE. D Confocal Fluorescence Images showing a higher number of Lipid Droplets per cell in IST-Mes2 and MPP89 compared to HMC35 cells. Images are representative of at least two experiments. Scale bar = 10 μm. E Lipid Droplet numbers were normalized to the number of nuclei per analysed image. Statistically significant differences were determined by Student’s t-test. Asterisk indicate a value of p ≤ 0.01. HMC35 N = 223, IST-Mes-2 N = 168, MPP89 N = 235. F A bar diagram showing ROS levels presented as MFI values ± SE. G A schematic diagram describes phospholipid biosynthesis pathway. H Total RNA of IST-Mes-2, MPP89, and HMC35 cells was analyzed by quantitative real-time PCR for the expression of the key enzymes in phospholipid biosynthesis CCTα, CHPT1, CEPT1. Values were normalized using GAPDH as the housekeeping gene. Data were statistically analyzed by Student’s t-test and are reported as mean values ± SE of three independent experiments. The asterisk indicate statistically significant differences between mesothelioma cell lines and primary mesothelial cells.
Fig. 2
Fig. 2. Altered NF-κB activity in mesothelioma cell lines Ist-Mes2 and MPP89 compared to normal mesothelial cells HMC35.
A IST-Mes-2, MPP89, and HMC35 cells (3 × 106) cells were stimulated or not with TNF-α. After 24 h, cells were co-transfected with pSV-β-Gal (0.2 µg) and pκBluc, (0.2 µg), then were followed for additional 48 h. The ratio of firefly luciferase activity to β-galactosidase activity was expressed as relative light units. Mean values ± SE of 3 independent experiments are shown. B The binding of p65, p50, p52, c-Rel, and RelB proteins to the NF-κB double-stranded oligonucleotide was measured in nuclear extracts using the NF-κB Combo Transcription Factor ELISA assay kit. Values are the mean ± SE of three independent experiments. C IST-Mes-2, MPP89, and HMC35 cells (3 × 106) cells were stimulated or not with TNF-α for 24 h. p65 was detected by Western blotting of nuclear cell extracts (30 μg). Histone-H1 was included as control of protein loading. Phosphorylated form of IKK and total form of IKK were detected by Western blotting of cytosolic cell extracts (30 μg). Vinculin was included as control of protein loading. D Cells were stimulated or not with TNF-α for 24 h and the IKK activity was measured in cytosolic cell extracts (30 μg) using the HTScan IKK kinase assay kit. Values are the mean ± SE of three independent experiments. The asterisks indicate statistically significant differences between stimulated and unstimulated cells, according to Student’s t-test (p < 0.05).
Fig. 3
Fig. 3. The expression of FABP5 increases in mesothelioma cell lines.
A Total RNA of IST-Mes-2, MPP89, and HMC35 cells was analyzed by quantitative real-time PCR for the expression of the key fatty acid transporters Slc27a1, Slc27a4, Slc27a5, Fabp1, Fabp3, Fabp4, Fabp5, and CD36. Values were normalized using GAPDH as the housekeeping gene. Data were statistically analyzed by Student’s t-test and are reported as mean values ± SE of three independent experiments. B Total RNA of IST-Mes-2, MPP89, and HMC35 cells stimulated or not with TNF-α for 24 h was analyzed by quantitative real-time PCR for the expression of FABP5. Values were normalized using GAPDH as the housekeeping gene. Data were statistically analyzed by Student’s t-test and are reported as mean values ± SE of three independent experiments. The asterisk indicates statistically significant differences between mesothelioma cell lines and primary mesothelial cells. C Volcano plot indicates the gene expression profile of MPP89 mesothelioma compared to normal mesothelial HMC35 cells. Lower expressed genes were indicated with blue, while higher expressed genes were indicated with red.
Fig. 4
Fig. 4. FABP5 depletion affects Mesothelioma Cell Dynamics and Metabolism.
A Total RNA of IST-Mes-2, MPP89, and HMC35 cells were transfected with siRNA FABP5 or scrambled siRNA (200 pmoles) and analyzed by quantitative real-time PCR for the expression of FABP5. Values were normalized using GAPDH as the housekeeping gene. Data were statistically analyzed by Student’s t-test and are reported as mean values ± SE of three independent experiments. The asterisks indicate statistically significant differences between cells transfected with siRNA FABP5 or scrambled siRNA, according to Student’s t-test (p < 0.05). B Western blotting analysis of HMC35, IST-Mes-2, and MPP89, transfected with siRNA FABP5 or scrambled siRNA (200 pmoles), whole cell extracts (50 µg) by using FABP5 or GAPDH antibodies. C Cell proliferation of IST-Mes-2, MPP89, and HMC35 cells transfected with siRNA FABP5 or scrambled siRNA (200 pmoles) was measured after 24, 48, and 72 h by Trypan Blue dye exclusion. D Apoptotic cells (Annexin V positive cells) were assessed by Annexin V binding assay. Values (mean ± SE; n = 3) are shown. Statistically significant difference was determined by Student’s t-test and was indicated by the asterisks (p < 0.05). E A bar diagram showing mitochondrial activity measured by Mitotracker assay. HMC5, IST-Mes-2, or MPP89 cells transfected with siRNA FABP5 or scrambled siRNA were stained with mitotracker red for 30 min and then analyzed by flow cytometry. The values were represented by MFI ± SE. F ADP/ATP Ratio Assay of IST-Mes-2, MPP89, and HMC35 cells transfected with siRNA FABP5 or scrambled siRNA was assessed. G NAD+/NADH ratio assay of IST-Mes-2, MPP89, and HMC35 cells transfected with siRNA FABP5 or scrambled siRNA (200 pmoles) was shown. H A bar diagram showing lipid droplets was assessed by Bodipy assay and represented as MFI values ± SE. Values (mean ± SE; n = 3) are shown. Statistically significant difference was determined by Student’s t-test. I Total RNA of IST-Mes-2, MPP89, and HMC35 cells transfected with siRNA FABP5 or scrambled siRNA (200 pmoles) was analyzed by quantitative real-time PCR for the expression of the key enzymes in phospholipid biosynthesis CCTα, CHPT1, CEPT1. Values were normalized using GAPDH as the housekeeping gene. Data were statistically analyzed by Student’s t-test and are reported as mean values ± SE of three independent experiments. The asterisk indicates statistically significant differences between mesothelioma cell lines and primary mesothelial cells.
Fig. 5
Fig. 5. FABP5 depletion affects NF-κB activity.
A HMC35, IST-Mes-2, and MPP89 cells (3 × 106) were transfected with siRNA FABP5 or scrambled siRNA (200 pmoles) in presence of pSV-β-Gal (0.2 mg) and pκBluc, (0.2 mg). Forty-eight hours later, firefly luciferase activity and β-galactosidase activity were measured. The ratio of firefly luciferase activity to β-galactosidase activity was expressed as relative light units. Mean values ± SE of 3 independent experiments are shown. B HMC35, IST-Mes-2, and MPP89 cells (3 × 106) were transfected with siRNA FABP5 or scrambled siRNA (200 pmoles). The binding of p65, p50, p52, c-Rel, and RelB proteins to the NF-κB double-stranded oligonucleotide was measured in nuclear extracts using the NF-kB Combo Transcription Factor ELISA assay kit. Values are the mean ± SE of three independent experiments. C HMC35, IST-Mes-2, and MPP89 cells (3 × 106) were transfected with siRNA FABP5 or scrambled siRNA. IKK activity was measured in cytosolic cell extracts (30 μg) using the HTScan IKK kinase assay kit. Values are the mean ± SE of three independent experiments. The asterisks indicate statistically significant differences between stimulated and unstimulated cells, according to Student’s t-test (p < 0.05). D HMC35, IST-Mes-2, and MPP89 cells (3 × 106) were transfected with siRNA FABP5 or scrambled siRNA (200 pmoles). Total RNA of IST-Mes-2, MPP89, and HMC35 cells was analyzed by quantitative real-time PCR for the expression of NF-κB dependent genes IL-1β, IL6, CCL2, and IL8. E Schematic representation of CCTα, CHPT1, and CEPT1 promoters. Red arrows indicate the NF-κB enhancers with the related positions. F HMC35, IST-Mes-2, and MPP89 cells (3 x 106) were transfected with siRNA FABP5 or scrambled siRNA (200 pmoles). 48 h later, ChIP was performed with anti-p65 antibody. Real-time PCR was performed with primers specific for the indicated promoters. Values (mean ± SE, n  =  3) are shown. The asterisks indicate statistically significant differences compared to the control (siControl) according to the Student’s t-test (p <  0.05).

References

    1. Guo, D. et al. An LXR agonist promotes glioblastoma cell death through inhibition of an EGFR/AKT/SREBP-1/LDLR-dependent pathway. Cancer Discov.1, 442–456 (2011). - PMC - PubMed
    1. Guo, D. et al. EGFR signaling through an Akt-SREBP-1-dependent, rapamycin-resistant pathway sensitizes glioblastomas to antilipogenic therapy. Sci. Signal.2, ra82 (2009). - PMC - PubMed
    1. Cheng, C. et al. Glucose-mediated N-glycosylation of SCAP is essential for SREBP-1 activation and tumor growth. Cancer Cell28, 569–581 (2015). - PMC - PubMed
    1. Srinivasan, S., Guha, M., Kashina, A. & Avadhani, N. G. Mitochondrial dysfunction and mitochondrial dynamics-The cancer connection. Biochim. Biophys. Acta Bioenerg.1858, 602–614 (2017). - PMC - PubMed
    1. Mannella, C. A. The relevance of mitochondrial membrane topology to mitochondrial function. Biochim. Biophys. Acta1762, 140–147 (2006). - PubMed

MeSH terms