. 2025 Feb 27;15(1):7069.
doi: 10.1038/s41598-025-90574-3.

The MEK inhibitor trametinib is effective in inhibiting the growth of canine oral squamous cell carcinoma

Affiliations

The MEK inhibitor trametinib is effective in inhibiting the growth of canine oral squamous cell carcinoma

William P Katt et al. Sci Rep. .

Abstract

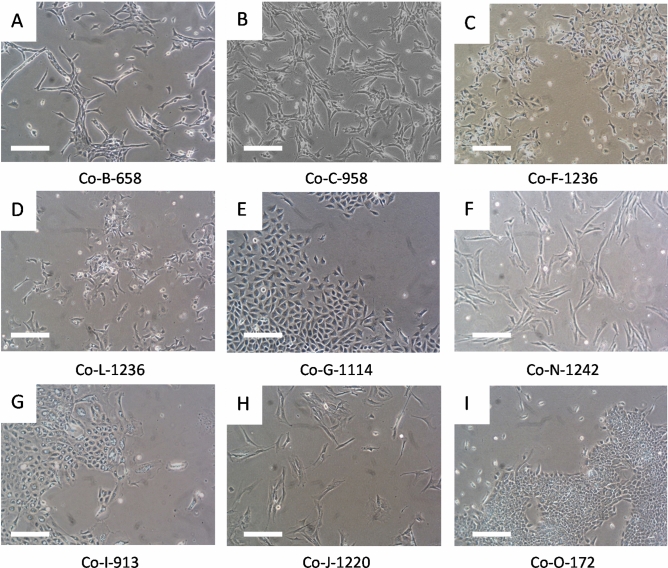
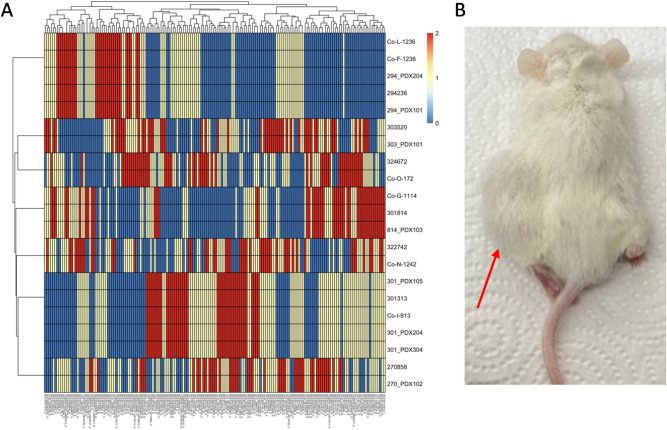
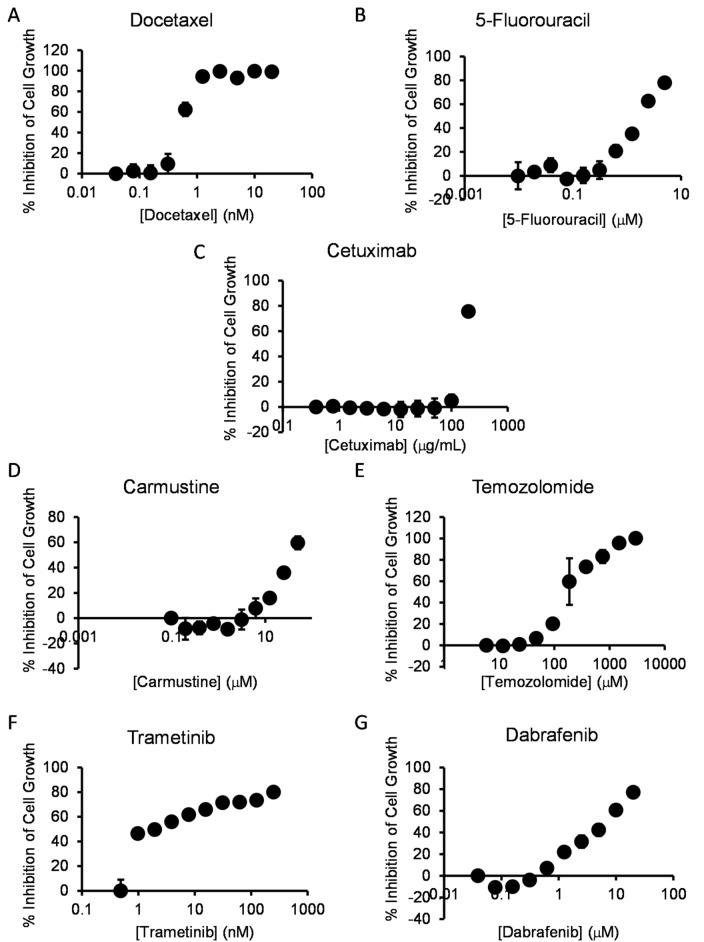
Oral tumors are relatively common in dogs, and canine oral squamous cell carcinoma (COSCC) is the most prevalent oral malignancy of epithelial origin. COSCC is locally aggressive with up to 20% of patients showing regional or distant metastasis at the time of diagnosis. The treatment of choice most typically involves wide surgical excision. Although long-term remission is possible, treatments are associated with considerable morbidity and can negatively impact functionality and quality of life. OSCCs have substantial upregulation of the RAS-RAF-MEK-MAPK signaling axis, and we had previously hypothesized that small-molecule inhibitors that target RAS signaling might effectively inhibit tumor growth and progression. Here, we demonstrate that the MEK inhibitor trametinib, an FDA-approved drug for human cancers, substantially inhibits the growth of six COSCC cell lines established from current patient tumor samples. We further show preliminary clinical evidence that the drug is able to cause ~ 40% and ~ 80% tumor regression in two out of four patients with spontaneously occurring COSCC, a partial response according to commonly used RECIST criteria. Given the limited treatment options available and the number of dogs for which standard of care is not acceptable, these preliminary findings provide new hope that more suitable treatment options may soon enter the veterinary clinic.

Keywords: Canine cancer; Oral squamous cell carcinoma; RAS signaling; Trametinib.


Conflict of interest statement

Declarations. Competing interests: The authors declare no competing interests.

Figures

Fig. 1
Fig. 1
PDX Model Characterization. Representative 10X light photomicrograph images of formalin-fixed and paraffin-embedded samples taken from three primary COSCCs corresponding to the (A) basaloid (bOSCC; tumor 270,858,), (B) conventional (cOSCC; tumor 294,246) and (C) papillary (pOSCC, tumor 301,313) histological subtypes, and corresponding patient-derived xenograft (PDX) samples. Except for sample 270_PDX301 (P3) (panel A), which corresponded to a murine tumor that formed at the implantation site upon second passage, note the consistent neoplastic epithelial cell (arrows) invasion of the mesenchymal stroma (asterisks) in the primary tumor and PDX samples observed on hematoxylin and eosin (H&E) and pan-cytokeratin stains. Also, scattered Ki67 nuclear immunoreactivity of proliferating neoplastic epithelial cells (arrows) in the primary tumor samples is similar to the corresponding PDX samples.
Fig. 2
Fig. 2
Micrographs of COSCC cell lines. Photographs of cells (AI) were taken on a phase contrast microscope. Cells did not noticeably change morphology over ~ 10 passages/2–3 months. A different cell line is shown in each panel A-I, and the cell line name is labeled immediately underneath the photograph. Scale bar = 200 µM.
Fig. 3
Fig. 3
Characterization of COSCC cell lines. (A) Cell lysates were resolved via SDS-Page, and blotted for murine cyclophilin A (CyPA), phospho-ERK (p.ERK), or vinculin (loading control). 4T1 and E0741 are murine breast cancer cell lines, which show a signal for the CyPA protein, while U87 is a human glioblastoma cell line which is negative for the protein. Three of the novel cell lines show signal for murine protein. All of the novel cell lines have some phospho-ERK signal, suggesting intact RAS signaling. (B) For each cell line, 1000 cells were plated into a 10 cm plate, and allowed to grow for 10–20 days. The plates were stained with crystal violet to visualize colony formation.
Fig. 4
Fig. 4
Further characterization of COSCC cell lines. (A) Select SNPs were chosen from genotyping data in order to develop a ‘fingerprint’ for each COSCC cell line. Colors represent genotypes (0 = blue, 1 = yellow, 2 = red). (B) Co-F-1236 cells were suspended in Matrigel and implanted into the left flank of NSG mice. The mice grew large tumors (indicated by red arrow) at the injection site.
Fig. 5
Fig. 5
Dose curves for assorted drugs vs. COSCC cell line Co-F-1236. Cells were plated at low density (2000 cells per well) in 96 well plates and treated for 6 days with the indicated amounts of each inhibitor (A) docetaxel, (B) 5-fluorouracil, (C) cetuximab, (D) carmustine, (E) temozolomide, (F) trametinib, (G) dabrafenib). The cells were then treated with PrestoBlue reagent, and cell viability was determined. %Inhibition was determined by comparison to no-drug controls (representing max growth) and cell-free lanes (representing 100% cell death). Each data point represents the average measurement from three samples, and the error bars represent the standard deviation from the mean. The lowest-concentration data point for each graph is a no-drug control and is given a non-zero value to be visible on the semi-log plot.
Fig. 6
Fig. 6
Sensitivity of COSCC to assorted drug approaches. (AG) The determined IC50 value for each drug (A) docetaxel, (B) 5-fluorouracil, (C) cetuximab, (D) carmustine, (E) temozolomide, (F) trametinib, (G) dabrafenib) for each COSCC cell line was plotted against data from the NCI-60. For each graph, the canine cell lines are highlighted as red bars, and the y-axis crosses the x-axis at the average IC50 value across all NCI-60 cell lines. Notably, the data for carmustine included an extended set of cell lines, so more bars are present than for the other drugs. (H) Co-F-1236 or Co-O-172 cells were treated with trametinib (125 nM or 315 nM respectively) and the indicated amounts of dabrafenib (Dab: 0, 2.5, 5, or 10 µM) for 6 days, and %inhibition of cell growth was determined, as scaled to wells containing zero cells (100% inhibition) and wells containing cells not exposed to any drug (100% growth). Inhibition was only minimally additive for Co-F-1236 cells, while combination treatment actively reduced inhibition rate in Co-O-172 cells. (I) As (H), except the data for each bar is scaled to wells containing dabrafenib alone (100% growth for that condition) to examine the effects of trametinib alone. Here, as the concentration of dabrafenib is increased, the effect due to trametinib appears to decrease.
Fig. 7
Fig. 7
In vivo potency of trametinib against COSCC. (A, B) MRI images of tumor-bearing mice before and after treatment with trametinib. Tumors are shown in red. (C, D) MRI images of tumor-bearing mice before and after treatment with carrier control. Tumors are shown in red. (E) Mouse tumors were measured (length and width) with calipers twice a week. Tumor volume was estimated as 0.5 * width (shorter measurement) * width * length (longer measurement). The drug treatment began at 0.5 mg/kg but was increased to 0.75 mg/kg on day 12 (marked with ¥). Datapoints represent the mean value from all six mice in each group, with error bars representing the standard deviation from the mean. The * represents data for which the p-value between treated and untreated samples is < 0.05. The exact p-value for the first statistically significant datapoint is shown. (F) Individual growth curves for each mouse tumor. Curves are grouped into ‘vehicle’ (V) or ‘treated’ (T) groups. One mouse (V1, indicated with a red arrow) was treated only with carrier control, but had a comparatively slow growing tumor. (G) Individual tumors removed from untreated and trametinib treated mice. Tumors from untreated mice are substantially larger than those from treated mice. (H) The weights of tumors in (G) were determined. (I) The body weight of each mouse was determined immediately before drug was injected. Drug treatment had no noticeable impact on body weight, and untreated mice grew slightly heavier throughout the course of the experiment. (J) Individual body weight plots for each mouse. One mouse in the drug treated group (T5, indicated with red arrow) was consistently lighter than all other mice, and died of treatment complications on the final day of the experiment, resulting in desiccation and body weight loss. (K) The weight of each mouse’s tumor was subtracted from its total weight, and then the weights of the treated and untreated mice were compared. There is no statistical difference between their body weights on the final day of the experiment once tumor weights are controlled for.
Fig. 8
Fig. 8
Preliminary clinical trial results. (A) Chart showing initial tumor volumes when patients arrived for diagnosis (black bars), and at terminal point of trial (white bars). Disease progress is labeled via RECIST criteria as progressive disease (PD, > 20% increase in tumor size) or partial response (PR, > 30% reduction in tumor size, but not complete disappearance). (B) Photograph of patient 4 (see Supplemental Tables S4-S5 and Figures S3-S4) at the time of pre-enrollment, (C) photograph of the same patient following 14 days of treatment with trametinib, (D) photograph of the same patient at 56 days, upon exiting the trial. (E) CT bone window slice of patient 3 showing osseous tumor invasion at initial diagnosis, and (F) corresponding CT bone window slice of following 4 weeks of treatment with trametinib, exhibiting tumor size reduction and osseous regeneration.

References

    1. Fulton, A. J., Nemec, A., Murphy, B. G., Kass, P. H. & Verstraete, F. J. M. Risk factors associated with survival in dogs with nontonsillar oral squamous cell carcinoma 31 cases (1990–2010). J. Am. Vet. Med. Assoc.243, 696–702. 10.2460/javma.243.5.696 (2013). - PubMed
    1. Peralta, S., Grenier, J. K., McCleary-Wheeler, A. L. & Duhamel, G. E. Ki67 labelling index of neoplastic epithelial cells differentiates canine acanthomatous ameloblastoma from oral squamous cell carcinoma. J. Comput. Pathol.171, 59–69. 10.1016/j.jcpa.2019.08.001 (2019). - PubMed
    1. Mestrinho, L. A. et al. Comparison of histological and proliferation features of canine oral squamous cell carcinoma based on intraoral location: 36 Cases. J. Vet. Dent.34, 92–99. 10.1177/0898756417713979 (2017). - PubMed
    1. Grimes, J. A. et al. Histologic evaluation of mandibular and medial retropharyngeal lymph nodes during staging of oral malignant melanoma and squamous cell carcinoma in dogs. J. Am. Vet. Med. Assoc.254, 938–943. 10.2460/javma.254.8.938 (2019). - PubMed
    1. Mestrinho, L. A. Current status and future perspectives in canine oral squamous cell carcinoma. Vet. Pathol.55, 200–201. 10.1177/0300985817732114 (2018). - PubMed

MeSH terms