. 2025 Feb 27;15(1):7104.
doi: 10.1038/s41598-025-90504-3.

Integration of Euclidean and path distances in hippocampal maps

Affiliations

Integration of Euclidean and path distances in hippocampal maps

Loes Ottink et al. Sci Rep. .

Abstract

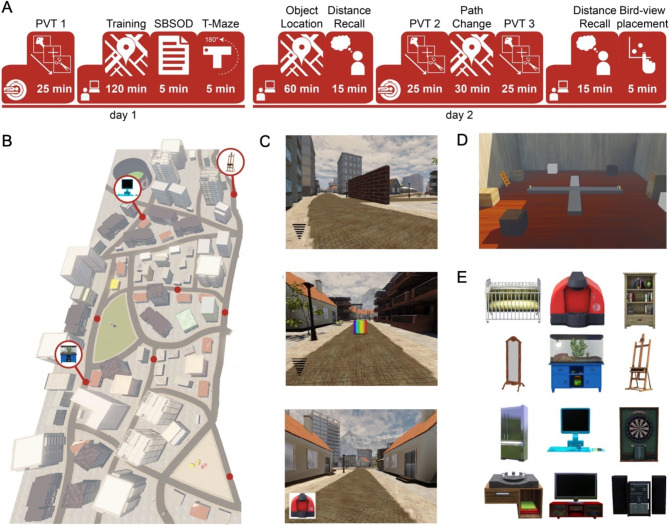
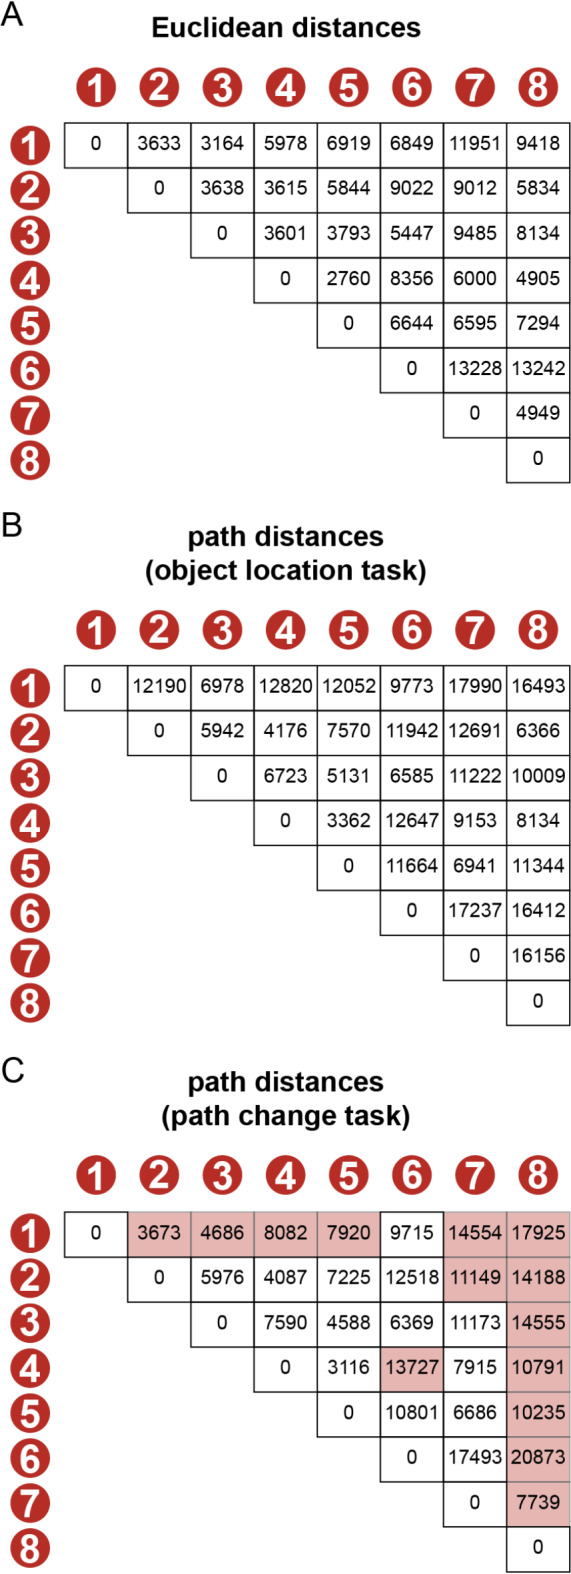
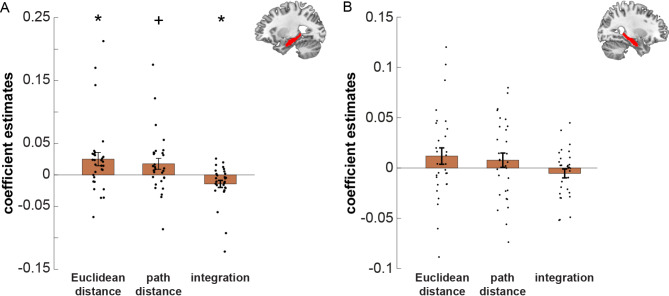
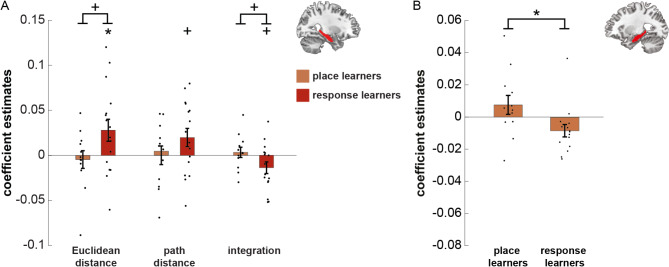
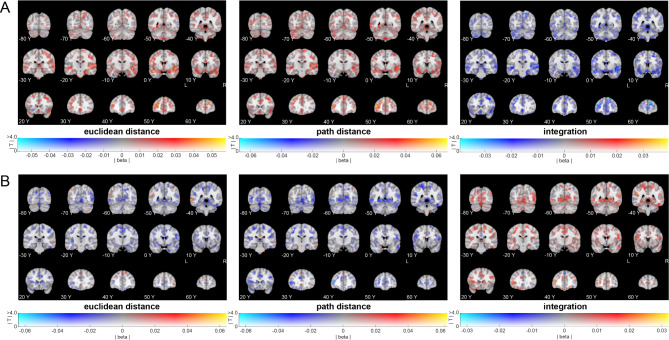
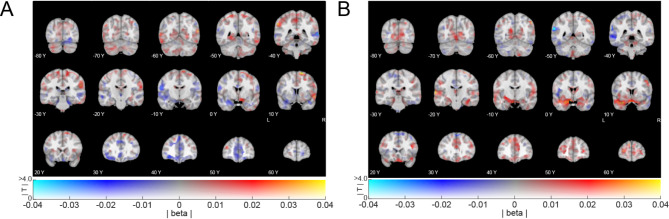
The hippocampus is a key region for forming mental maps of our environment. These maps represent spatial information such as distances between landmarks. A cognitive map can allow for flexible inference of spatial relationships that have never been directly experienced before. Previous work has shown that the human hippocampus encodes distances between locations, but it is unclear how Euclidean and path distances are distinguished. In this study, participants performed an object-location task in a virtual environment. We combined functional magnetic resonance imaging with representational similarity analysis to test how Euclidean and path distances are represented in the hippocampus. We observe that hippocampal neural pattern similarity for objects scales with distance between object locations, and suggest that the hippocampus integrates Euclidean and path distances. One key characteristic of cognitive maps is their adaptive and flexible nature. We therefore subsequently modified path distances between objects using roadblocks in the environment. We found that hippocampal pattern similarity between objects adapted as a function of these changes in path distance, selectively in route learners but not in map learners. Taken together, our study supports the idea that the hippocampus creates integrative and flexible cognitive maps.


Conflict of interest statement

Declarations. Competing interests: The authors declare no competing interests.

Figures

Fig. 1
Fig. 1
Experimental sessions and VR environment. (A) Overview of the experimental sessions on day 1 and day 2. Day 1 started with a picture viewing task (PVT) during an fMRI session, followed by a behavioural session including the training task, Santa Barbara Sense of Direction scale and a T-maze task. On day 2, participants performed the object location task, followed by a distance recall task. The second PVT, path change task and third PVT were performed in the MRI-scanner. At last, participants performed a second distance recall and a bird-view task. (B) Birdview of the virtual city. Object-locations are indicated with a red dot. Three example objects are shown. (C) Screenshots of the navigation task. Top: navigation phase of the training task and first half of object-location task. The wifi-like signal indicates how close the participant is to the goal-location. The brick wall is one of the roadblocks. Middle: the box of the location would turn from black to multicoloured if it is the goal-location of the current trial. Bottom: Navigation phase during the second half of the object-location task, and the path change task. Instead of the wifi-like signal, participants are cued by the object of the goal-location. (D) Screenshot of the T-maze task environment (shown here as a double T-maze, one rotated 180˚ compared to the other). During normal trials, the dark gray elevated platform was the T-maze, with a multicoloured box at the left and right arm. During probe trials, the T-maze was rotated 180˚, and the light grey arm became the starting arm of the T. (E) Eight out of twelve objects were randomly chosen for each participant. Each object was associated with one of the eight goal-locations in the virtual environment. The objects were: a baby bed, a coffee maker, a bookshelf, a mirror, a terrarium, a canvas stand, a fridge, a computer, a dart board, a sink, a TV and a stereo.
Fig. 2
Fig. 2
Disentangling Euclidean and path distances. (A) Birdview of the virtual city, including numbered object-locations and three examples of objects. Roadblock locations during the object-location task are indicated by light bars, and roadblock locations during the path change task are indicated by dark bars. One roadblock was used in both tasks (light/dark bar). Two examples of object-to-object Euclidean distances are indicated by black lines. The dashed lines represent two examples of shortest object-to-object path distances during the object-location task (light) and path change task (dark). (B) Predictions based on the Euclidean and path distances of the original map, during the object-location task. Examples are shown for three object-locations. If Euclidean distance is represented, we expect that objects 7 and 8 show a higher change in similarity when subtracting pattern similarity of PVT 1 from PVT 2, than objects 1 and 8, because the Euclidean distance is lower between 7 and 8 than between 1 and 8. However, because of the roadblocks, the path distance between 7 and 8 is higher than between 1 and 8. Therefore, if path distance is represented, we expect a lower similarity between 7 and 8 than between 1 and 8. (C) Predictions based on the change in path distance during the path change task. Path distance between object 1 and 8 increases in the path change task, so we expect a decrease in pattern similarity when subtracting PVT 2 from PVT 3. We expect the opposite for object 7 and 8, where the path distance decreases in the path change task. (D) Overview of the RSA and multiple linear regression analyses for each subject. First, object-to-object correlation of representions in the left and right hippocampus were obtained. Subsequently, we measured how these correlations change from PVT to PVT (pre to post navigation tasks). Finally, we applied a multiple linear regression model with the distance types as predictors. In these predictors, an example is given for an object-pair with high Euclidean ánd high path distance (dark gray), of low Euclidean ánd low path distance (light grey), and intermediate.
Fig. 3
Fig. 3
Distances between goal-locations, in virtual distance points. (A) Euclidean distances between objects. These distances were the same during the object-location and path change task. (B) Path distances between objects during the object-location task. (C) Path distances during the path change task. Distances that were subject to a meaningful change (1000 virtual distance points) are marked pink.
Fig. 4
Fig. 4
Behavioural results. (A) Mean percentage of trials in which participants took the shortest route during the four blocks of the training task. Errorbars denote standard deviations. Small dots are individual data points. (B) Mean percentage of correctly placed boxes at the end of the four blocks of the training task. Errorbars denote standard deviations. Small dots are individual data points. (C) Results of the distance recall tasks before (left) and after (right) the path-change task. Errorbars denote SEM, dots are individual data points. (D) Results of the bird-view placement task. Diamonds indicate the true locations, and large dots the mean placed locations. Circles indicate standard deviations around the mean placed location. Small dots are individual data points. (E) Mean error of the bird-view task, as a proportion of total map length. The dashed line indicates the error radius of 2.6% that was allowed in the training task. Errorbars indicate SEM, dots are individual data points.
Fig. 5
Fig. 5
ROI analysis results for left and right hippocampus. Results of the ROI analyses for representation of Euclidean and path distances and their integration after the object-location task, using representational similarity analysis. Coefficient estimates are the result of the multiple linear regression analysis we performed on the object-to-object correlations within each ROI, with the Euclidean distance, path distance, and their integration as predictors. The change in neural similarity is shown from before (PVT 1) to after (PVT 2) the object-location task. Bars indicate mean ± SEM. (A) Results in the left hippocampus. We found a significant effect for Euclidean distance and integration, and a trend effect for path distance, using multiple linear regression. (B) Results in the right hippocampus. We found no significant effects. +p < 0.1 (trend), * p < 0.05.
Fig. 6
Fig. 6
Post-hoc results of differences between place and response learners. (A) Results of the post-hoc analyses on the right hippocampus after the object-location task. Coefficient estimates are the result of the multiple linear regression analysis we performed on the object-to-object correlations within each ROI, with the Euclidean distance, path distance, and their integration as predictors. We found trend differences between the place and response learners in the right hippocampus, for Euclidean distance and integration. The change in neural similarity is shown from before (PVT 1) to after (PVT 2) the object-location task. Bars indicate mean ± SEM. (B) Results of the post-hoc analyses on the left hippocampus after the path change task. We found a significant difference between the place and response learners in representation of change in path distances. The change in neural similarity is shown from before (PVT 2) to after (PVT 3) the path change task, for object pairs with decreased path length subtracted from object pairs with increased path length. Bars show mean ± SEM. * p < 0.05.
Fig. 7
Fig. 7
Whole brain searchlight results for effects from PVT1 to PVT2 (uncorrected whole brain effects). (A) Whole brain effects of distance categories on change in neural similarity from before (PVT 1) to after (PVT 2) the object-location task. Left: effects of Euclidean distance categories. Middle: effects of path distance categories. Right: effects of integration distance categories. No effects survived whole-brain correction. (B) Whole brain effects for differences between response and place learners in distance representations, from before (PVT 1) to after (PVT 2) the object-location task. Left: effects of Euclidean distance categories. Middle: effects of path distance categories. Right: effects of integration distance categories. No effects survived whole-brain correction. All images were created using a dual-coded design,. This allowed showing both the mean beta coefficient (blue-red) and the T-stats (opacity). Y-coordinates are in MNI space.
Fig. 8
Fig. 8
Whole brain searchlight results for effects from PVT2 to PVT3 (uncorrected whole brain effects). (A) Whole brain effects of changes in neural pattern similarity from before (PVT 2) to after (PVT 3) the path change task, as a function of change in path distance. No effects survived whole-brain correction. (B) Differences between path and response learners for representing change in path distance (measured as in A). Coefficients depict effects of response learners minus those of path learners. No effects survived whole-brain correction. All images were created using a dual-coded design,. This allowed showing both the mean beta coefficient (blue-red) and the T-stats (opacity). Y-coordinates are in MNI space.

References

    1. Tolman, E. C. Cognitive maps in rats and men. Psychol. Rev.55, 189–208 (1948). - PubMed
    1. O’Keefe, J. & Nadel, L. The Hippocampus as a Cognitive Map (Oxford University Press, 1978).
    1. Maguire, E. A. et al. Knowing where and getting there: A human navigation network. Science280, 921–924 (1998). - PubMed
    1. Burgess, N., Maguire, E. A. & O’Keefe, J. The human Hippocampus and spatial and episodic memory. Neuron35, 625–641 (2002). - PubMed
    1. McNaughton, B. L., Battaglia, F. P., Jensen, O., Moser, E. I. & Moser, M. B. Path integration and the neural basis of the ‘cognitive map’. Nat. Rev. Neurosci.7, 663–678 (2006). - PubMed

LinkOut - more resources