. 2025 Mar;28(3):499-516.
doi: 10.1038/s41593-025-01877-7. Epub 2025 Feb 27.

Nasal anti-CD3 monoclonal antibody ameliorates traumatic brain injury, enhances microglial phagocytosis and reduces neuroinflammation via IL-10-dependent Treg-microglia crosstalk

Affiliations

Nasal anti-CD3 monoclonal antibody ameliorates traumatic brain injury, enhances microglial phagocytosis and reduces neuroinflammation via IL-10-dependent Treg-microglia crosstalk

Saef Izzy et al. Nat Neurosci. 2025 Mar.

Abstract

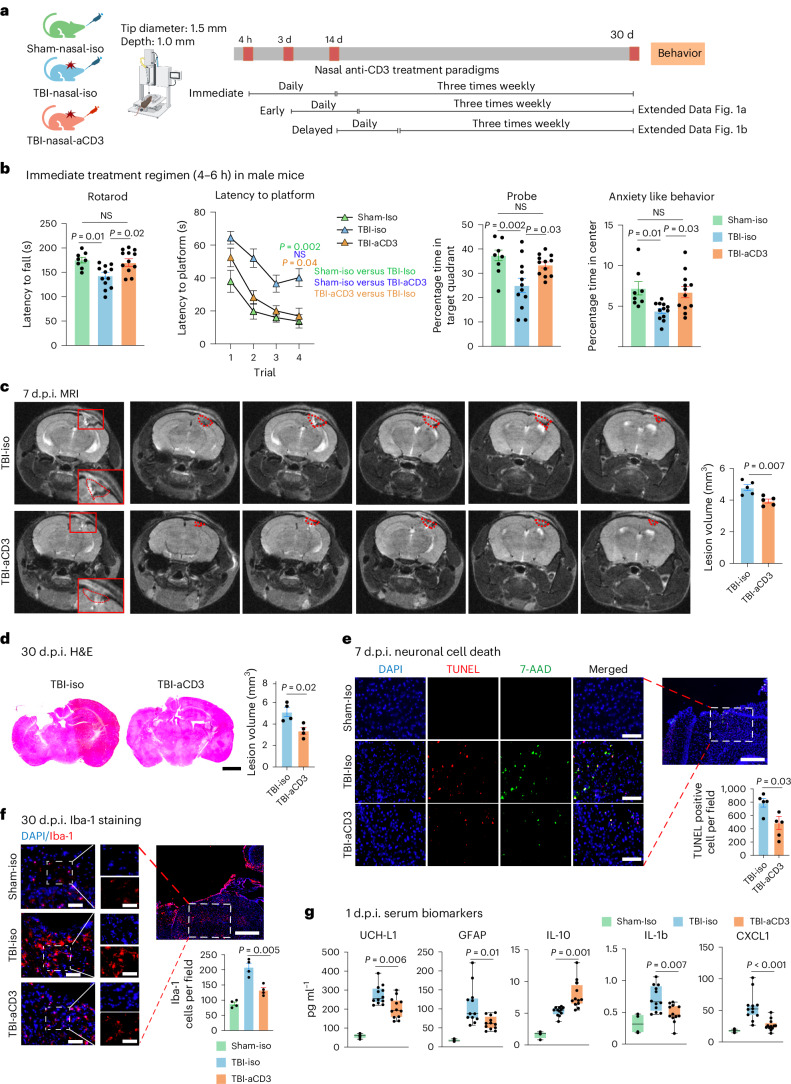
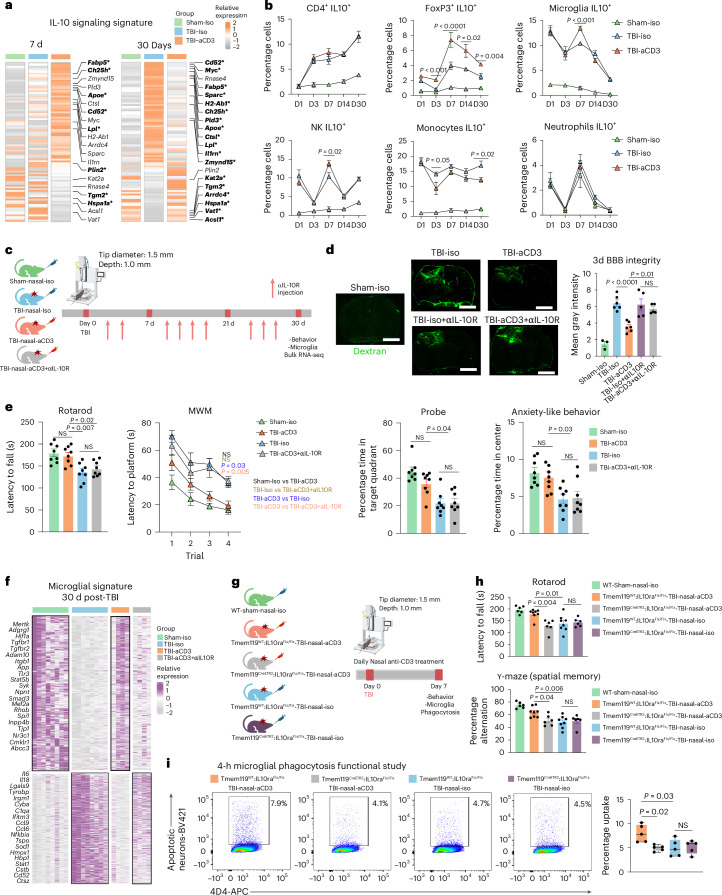
Neuroinflammation plays a crucial role in traumatic brain injury (TBI), contributing to both damage and recovery, yet no effective therapy exists to mitigate central nervous system (CNS) injury and promote recovery after TBI. In the present study, we found that nasal administration of an anti-CD3 monoclonal antibody ameliorated CNS damage and behavioral deficits in a mouse model of contusional TBI. Nasal anti-CD3 induced a population of interleukin (IL)-10-producing regulatory T cells (Treg cells) that migrated to the brain and closely contacted microglia. Treg cells directly reduced chronic microglia inflammation and regulated their phagocytic function in an IL-10-dependent manner. Blocking the IL-10 receptor globally or specifically on microglia in vivo abrogated the beneficial effects of nasal anti-CD3. However, the adoptive transfer of IL-10-producing Treg cells to TBI-injured mice restored these beneficial effects by enhancing microglial phagocytic capacity and reducing microglia-induced neuroinflammation. These findings suggest that nasal anti-CD3 represents a promising new therapeutic approach for treating TBI and potentially other forms of acute brain injury.


Conflict of interest statement

Competing interests: H.L.W. is on the scientific advisory board of Tiziana Life Sciences.

Figures

Fig. 1
Fig. 1. Nasal aCD3 improves behavioral outcomes and ameliorates neuropathological outcomes in the CCI model of TBI.
a, Experimental timeline schematic for treatment regimens (created with BioRender.com). b, Behavioral testing (rotarod, MWM test, probe trial, open field for anxiety-like behavior) in the immediate treatment group (sham-iso n = 8, TBI-iso n = 12, TBI-aCD3 n = 12). The MWM test was analyzed by two-factor, repeated-measure, two-way ANOVA (group × time) and others by one-way ANOVA with Tukey’s multiple comparisons. Data are shown as mean ± s.e.m. c, MRI lesion volume 7 d post-TBI (TBI-iso n = 5, TBI-aCD3 n = 5), analyzed by two-sided, unpaired Student’s t-test. Data are shown as mean ± s.e.m. The red dashes indicate the lesion area. d, Lesion volume from H&E-stained brain sections 30 d post-TBI measured with ImageJ (TBI-iso n = 4, TBI-aCD3 n = 4), analyzed by two-sided, unpaired Student’s t-test. Data are shown as mean ± s.e.m. Scale bars, 1,000 µm. e, Immunofluorescence of neuronal death 7 d post-TBI at pericontusional cortex (DAPI, blue; TUNEL, red; 7-AAD, green). Scale bars, 200 µm (500 µm for zoomed out). TUNEL-positive cells were quantified using ImageJ (TBI-iso n = 5, TBI-aCD3 n = 5) and analyzed using two-sided, unpaired Student’s t-test. Data are shown as mean ± s.e.m. f, Immunofluorescence of Iba-1 at 30 d post-TBI in pericontusional cortex (DAPI, blue; Iba-1, red). Scale bars, 200 µm (500 µm for zoomed out). Iba-1+ cells quantified using ImageJ (sham-iso n = 4, TBI-iso n = 4, TBI-aCD3 n = 4), analyzed by one-way ANOVA with Tukey’s multiple comparisons. Data are shown as mean ± s.e.m. g, Serum biomarkers 1 d post-TBI measured by Quanterix SiMoA and V-Plex proinflammatory assays (sham-iso n = 4, TBI-iso n = 12, TBI-aCD3 n = 12), analyzed by one-way ANOVA with Tukey’s multiple comparisons. Data are shown as box plots (min., max., interquartile range (IQR), median). d.p.i., d post-injury; NS, non-significant. All data represent biological replicates from two independent experiments.
Fig. 2
Fig. 2. Nasal aCD3 expands FoxP3 Treg cells and modulates the adaptive immune response.
a,b, Flow cytometry analysis and quantification of CD4+ (a) and CD4+FoxP3+ (b) Treg cells in the meninges and ipsilateral hemisphere at 1, 3, 7, 14 and 30 d (D) after TBI and treatment. c, Quantification of CD4+ subsets at the same time points. d, Analysis of CD11b+-infiltrated cells across these intervals. Groups included sham-iso (n = 4), TBI-iso (n = 6) and TBI-aCD3 (n = 6). Data are analyzed by one-way ANOVA with Tukey’s multiple comparisons for every individual timepoint. Data are shown as mean ± s.e.m. representing biological replicates from two independent experiments per timepoint for ad. e, Immunofluorescence of meninges (2 d post-TBI) and brain (7 d post-TBI) samples from FoxP3-GFP mice with DAPI (blue), CD3 (pink), FoxP3 (green). Scale bars, 100 µm. IHC, immunohistochemistry. f, PCA plot of brain and blood Treg cells 7 d post-TBI. Brain and blood samples are pools of 5 mice and sham-iso brain samples are pools of 20 mice. Due to the low number of FoxP3⁺ cells recruited to the brain and ethical considerations, we limited the study to two biological replicates, following practices from previous studies in the field. Despite this limitation, the consistent and robust results observed support the validity of our findings. g,h, Heatmaps of DEGs from blood (g) and brain (h) Treg cells at 7 d post-TBI using DESeq2 (FDR-corrected P < 0.05, n = 2 pooled samples per group). i, GSEA of GOBP 7 d post-TBI for brain Treg cells. The asterisks indicate enriched terms (q < 0.05). NES, normalized enrichment score. j, IPA analysis of DEGs from brain Treg cells in TBI-aCD3 versus TBI-iso using DESeq2 analysis (two-sided Wald’s test, FDR-corrected P < 0.05). One-sided Fisher’s exact test was used: *P < 0.05, **P < 0.01, ***P < 0.001. Results with FDR-corrected P < 0.05 were selected. k, Predicted upstream regulators using IPA for TBI-aCD3 versus TBI-iso. l, Quantification of FoxP3+IL-10+ Treg cells in the ipsilateral hemisphere 7 d post-TBI. Groups included sham-iso (n = 4), TBI-iso (n = 6) and TBI-aCD3 (n = 6). Data are shown as box plots (min., max., IQR, median), analyzed by one-way ANOVA with Tukey’s multiple comparisons. Data are from biological replicates and represent two independent experiments.
Fig. 3
Fig. 3. Nasal aCD3 modulates the microglial inflammatory response after TBI.
a, Immunofluorescence of ipsilateral brain lesion (7 d post-TBI) from FoxP3-GFP mice for DAPI (blue), CD3 (pink), FoxP3 (green) and Iba-1 (red) showing FoxP3 Treg cells in close proximity to Iba-1. Scale bars, 100 μm and 50 μm for the enlarged image. b, Experimental timeline schematic for microglial bulk RNA-seq at 7 and 30 d after TBI and treatment (created with BioRender.com). c, Heatmap of DEGs from microglia at 7 and 30 d post-TBI identified using DESeq2 analysis (two-sided LRT, n = 4 mice per group, FDR-corrected P < 0.05). d, Microglial core sensome genes at 7 and 30 d in TBI-aCD3 versus TBI-iso. Genes are colored by their function,,. Emboldened DEGs have an asterisk: FDR-corrected P < 0.05; *P < 0.05 (DESeq2 analysis, two-sided Wald’s test, n = 4 mice per group). e, GSEA of GOBP at 7 and 30 d post-TBI based on the following pairwise comparisons: TBI-iso versus sham-iso and TBI-aCD3 versus sham-iso; the asterisk indicates enriched terms (q-value < 0.05). NES, normalized enrichment score. f, Heatmap of genes involved in inflammatory response from microglia at 30 d post-TBI. Genes identified with an FDR-corrected P < 0.05 using DESeq2 analysis are indicated by an asterisk (two-sided LRT, n = 4 mice per group). Genes were identified from the GOBP term inflammatory response as well as microglial inflammatory genes. g, Heatmap of DAM and MGnD genes at 30 d post-TBI. Genes identified with an FDR-corrected P < 0.05 using DESeq2 analysis are indicated by an asterisk (two-sided LRT, n = 4 mice per group). Genes were identified based on the previous work of our group and others,. h, RT–qPCR of microglia sorted from the ipsilateral hemisphere at 7 and 30 d post-TBI. Expression was normalized to glyceraldehyde 3-phosphate dehydrogenase (GAPDH) and presented relative to that of sham-iso animals (sham-iso n = 4, TBI-iso n = 5, TBI-aCD3 n = 5), analyzed by one-way ANOVA with Tukey’s multiple comparisons. Data are shown as mean ± s.e.m. All data are biological replicates and represent two independent experiments.
Fig. 4
Fig. 4. Nasal aCD3 increased microglial phagocytic capacity after TBI in an IL-10-dependent manner.
a, Heatmap of microglial phagocytosis genes 7 d after TBI. Genes identified with FDR-corrected P < 0.05 using DESeq2 analysis are indicated by an asterisk (two-sided LRT, n = 4 mice per group). Genes were identified from the GOBP term phagocytosis and microglial phagocytosis genes,. b, Schematic presenting a phagocytosis functional study (created with BioRender.com). c, Immunofluorescence of lesion (7 d post-TBI) for apoptotic neurons (blue) and P2ry12 (red) showing engulfment of apoptotic neurons by P2ry12. Scale bars, 100 μm and 50 μm for the enlarged image. d, Phagocytosis experiment where mice were injected with labeled apoptotic neurons and sacrificed 4 h post-injection. The gating strategy shows phagocytic positive microglia and data are shown as box plots (min., max., IQR, median) and n = 5 mice per group were used. Data were analyzed by two-sided, unpaired Student’s t-test. e, Clustered heatmap of DEGs of aggregated samples for phagocytic (+P) and nonphagocytic (−P) microglia 7 d post-TBI and 4 h post-injection of apoptotic neurons identified using DESeq2 analysis (two-sided LRT, n = 3-4 mice per group, FDR-corrected P < 0.05). f, Bar plots with log2(fold-changes) of genes from e pertinent to microglial phagocytosis and related functions in the following comparisons: TBI-iso (+P) versus TBI-iso (−P) and TBI-aCD3 (+P) versus TBI-Iso (−P). g, GSEA analysis of GOBP 7 d post-TBI and 4 h post-injection of apoptotic neurons based on pairwise comparisons: TBI-iso (+P) versus TBI-Iso (−P), TBI-aCD3 (+P) versus TBI-Iso (−P) and TBI-aCD3 (−P) versus TBI-Iso (−P). The asterisk indicates enriched terms (q-value < 0.05). h, Selected top canonical pathways from IPA analysis of DEGs in phagocytic TBI-aCD3 microglia compared with phagocytic and nonphagocytic TBI-iso microglial groups at 7 d post-TBI and 4 h post-injection of apoptotic neurons. i, Predicted upstream regulator in TBI-aCD3 (+P) versus TBI-iso (−P). j, Phagocytosis experiment with similar design to b. Data are shown as box plots (min., max., IQR, median) and n = 5 mice per group were used. The data were analyzed by one-way ANOVA with Tukey’s multiple comparisons. All data are biological replicates and represent two independent experiments.
Fig. 5
Fig. 5. Nasal aCD3 ameliorates TBI microglial inflammation and functional outcomes in an IL-10-dependent manner.
a, Heatmap of genes of aggregated samples involved in the IL-10 pathway for microglia at 7 and 30 d post-TBI. Genes identified with an FDR-corrected P < 0.05 using DESeq2 analysis are emboldened and indicated by an asterisk (two-sided LRT, n = 4 mice per group). Genes were identified from the literature. b, IL-10 expression (flow cytometry) in different cells at different time points post-TBI and treatment in the ipsilateral hemisphere (sham-iso n = 4, TBI-iso n = 6, TBI-aCD3 n = 6), analyzed by one-way ANOVA with Tukey’s multiple comparisons for individual time points. Data are shown as mean ± s.e.m. NK, natural killer cell. c, Experimental timeline of anti-IL-10R-blocking mAbs (aIL-10R) (created with BioRender.com). d, Dextran 70-kDa (green) for measurement of BBB permeability (3 d post-TBI). Scale bars, 1,000 μm. Data are shown as mean ± s.e.m. (sham-iso n = 3, n = 6 for the rest of the groups), analyzed by one-way ANOVA with Tukey’s multiple comparisons. e, Behavioral testing (rotarod, MWM, probe trial, OF for anxiety-like behavior). The MWM was analyzed by two-factor, repeated-measures, two-way ANOVA (group × time) and the others by one-way ANOVA with Tukey’s multiple comparisons. Data are shown as mean ± s.e.m. (n = 8 mice per group). f, Clustered heatmap DEGs at 30 d post-TBI identified using DESeq2 analysis (two-sided LRT, n = 4–8 mice per group, FDR-corrected P < 0.05). The microglial data at 30 d post-TBI from Fig. 3c were integrated. g, Experimental timeline for the microglia-specific IL-10ra KO (created with BioRender.com). h, Behavioral testing of rotarod and Y-maze assessed between the groups. Data are shown as mean ± s.e.m. (WT sham-nasal-iso n = 6, Tmem119WT:IL-10raFlx/Flx-TBI-Nasal-aCD3 n = 8, Tmem119CreETR2:IL-10raFlx/Flx-TBI-Nasal-aCD3 n = 6, Tmem119WT:IL-10raFlx/Flx-TBI-nasal-iso n = 8, Tmem119 CreETR2:IL-10raFlx/Flx-TBI-nasal-iso n = 6). Analysis was by one-way ANOVA with Tukey’s multiple comparisons. i, Phagocytosis experiment with a similar design to Fig. 4b. Data are shown as box plots (min., max., IQR, median; n = 5 mice per group), analyzed by one-way ANOVA with Tukey’s multiple comparisons. All data are biological replicates and represent two independent experiments.
Fig. 6
Fig. 6. Nasal aCD3-induced CD4+FoxP3+ Treg cells attenuate the CNS inflammatory response, increase microglial phagocytosis and improve behavioral outcomes after TBI.
a, Experimental timeline of adoptive transfer (created with BioRender.com). b, Behavioral testing of rotarod and Y-maze assessed. Data are shown as mean ± s.e.m. (sham-DPBS n = 6, TBI-aCD3-FoxP3 n = 8, TBI-iso FoxP3 n = 8, TBI-aCD3-FoxP3 n = 8) and analyzed by one-way ANOVA with Tukey’s multiple comparisons. c, Clustered heatmap of unique and shared DEGs of aggregated samples from microglia at 7 d post-TBI on the following comparisons: TBI-iso FoxP3 versus TBI-aCD3-FoxP3 and TBI-aCD3-FoxP3 versus TBI-aCD3-FoxP3. Clusters were functionally annotated using enriched GOBP terms (q-value < 0.05). DEGs were identified using DESeq2 analysis (two-sided Wald’s test, n = 3 mice per group, FDR-corrected P < 0.05). d, GSEA analysis of Hallmark pathways at 7 d post-TBI for the following: TBI-iso FoxP3 versus TBI-aCD3-FoxP3 and TBI-aCD3-FoxP3 versus TBI-aCD3-FoxP3. The asreisk indicates enriched terms (q-value < 0.05). e, Predicted upstream regulators (IPA analysis) in TBI-aCD3-FoxP3 versus TBI-aCD3-FoxP3. f, GSEA analysis of Hallmark pathways comparing TBI-aCD3-FoxP3 versus TBI-iso FoxP3. g, Predicted upstream regulator (IPA analysis) in TBI-aCD3-FoxP3 versus TBI-Iso FoxP3. h, RT–qPCR of microglia sorted from the ipsilateral hemisphere 7 d post-TBI. Expression was normalized to GAPDH and presented relative to sham-DPBS mice. Data are shown as mean ± s.e.m., n = 3–4 mice per group and analyzed by one-way ANOVA with Tukey’s multiple comparisons. i, Phagocytosis experiment with similar design to Fig. 4b. Data are shown as box plots (min., max., IQR, median), n = 4 mice per group and analyzed by one-way ANOVA with Tukey’s multiple comparisons. j, Schematic representing microglia and Treg cell transwell co-culture (created with BioRender.com). Microglia were isolated 24 h post-TBI and cultured with FoxP3 Treg cells from either nasal aCD3 or isotype-treated TBI mice for 7 d. j, RT–qPCR of microglia, expression normalized to GAPDH. Data are shown as mean ± s.e.m., n = 4 conditions per group and analyzed by one-way ANOVA with Tukey’s multiple comparisons. All data and conditions are biological replicates and represent two independent experiments.
Fig. 7
Fig. 7. IL-10-producing Treg cells play a critical role in modulating microglia and improving recovery post-TBI.
a, Experimental timeline of FoxP3-DTR Treg cell depletion (created with BioRender.com). b, Behavioral testing of rotarod and Y-maze was assessed between the groups. Data are shown as mean ± s.e.m., n = 6 mice per group and analyzed by one-way ANOVA with Tukey’s multiple comparisons. c, RT–qPCR of microglia sorted from the ipsilateral hemisphere 7 d post-TBI. Expression was normalized to GAPDH. Data are shown as mean ± s.e.m., n = 4 mice per group and analyzed by one-way ANOVA with Tukey’s multiple comparisons. d, Phagocytosis experiment with similar design to Fig. 4b. Data are shown as box plots (min,. max., IQR, median), n = 5 mice per group and analyzed by one-way ANOVA with Tukey’s multiple comparisons. e, Schematic representing validation of Il10 expression (created with BioRender.com). RT–qPCR of Il10 expression was done for FoxP3+Thy1.1+- and FoxP3+Thy1.1-sorted cells and expression was normalized to GAPDH. Data are shown as mean ± s.e.m., n = 3 mice per group and analyzed by two-sided, unpaired Student’s t-test. f, Schematic representing adoptive transfer experiment (created with BioRender.com). Expression of Thy1.1 on FoxP3 was analyzed between the two groups. Data are shown as mean ± s.e.m., n = 3 sample per group and analyzed by two-sided, unpaired Student’s t-test. Each sample was a pool of five injured hemispheres. g, Schematic representing experimental timeline of adoptive transfer experiment. h, Behavioral testing of rotarod and Y-maze assessed between the groups. Data are shown as mean ± s.e.m, n = 6 mice per group and analyzed by one-way ANOVA with Tukey’s multiple comparisons. i, RT–qPCR of microglia sorted from the ipsilateral hemisphere 7 d post-TBI. Expression was normalized to GAPDH. Data are shown as mean ± s.e.m., n = 4 mice per group and analyzed by one-way ANOVA with Tukey’s multiple comparisons. j, Phagocytosis experiment with similar design to Fig. 4b. Data are shown as box plots (min., max., IQR, median), n = 4 mice per group and analyzed by one-way ANOVA with Tukey’s multiple comparisons. All data are biological replicates and represent two independent experiments.
Extended Data Fig. 1
Extended Data Fig. 1. Nasal anti-CD3 improves behavioral outcomes at different treatment regimens and TBI severities.
(a) Behavioral testing in the early treatment regimen for males of rotarod, Morris water maze, probe trial, and anxiety like behavior that is measured by the open field was assessed between (Sham-Iso n = 8, TBI-Iso n = 12, and TBI-aCD3 n = 12) groups in the early and (b) delayed treatment regimen for males and (c) immediate for females. Morris water maze analyzed by two-factor repeated measures two-way ANOVA (group x time); others by one-way ANOVA with Tukey’s multiple comparisons. Data shown as mean ± SEM. (d) Behavioral testing in the immediate treatment regimen for males in severe TBI (Depth: 1.5 mm, Diameter: 3.0 mm of the impact tip) of rotarod, Morris water maze, probe trial, and anxiety like behavior that is measured by the open field was assessed between (Sham-Iso n = 8, TBI-Iso n = 12, and TBI-aCD3 n = 12) groups in males and (e) females. Morris water maze analyzed by two-factor repeated measures two-way ANOVA (group x time); others by one-way ANOVA with Tukey’s multiple comparisons. Data shown as mean ± SEM. All data are biological replicates and are representative from two independent experiments. n.s. = non-significant.
Extended Data Fig. 2
Extended Data Fig. 2. Nasal anti-CD3 ameliorates pathological outcomes at different treatment regimens and TBI severities.
(a) Unedited 3-Tesla serial images Magnetic resonance imaging (MRI) taken 7 days post-TBI of (Fig. 1c). (b) Dextran 70-kDa (Green) for measurement of blood-brain barrier permeability between the groups (3days post-TBI). Scale bars are 1000 um. Data is shown as mean ± SEM, (Sham-Iso n = 3, TBI-Iso n = 4, and TBI-aCD3 n = 4) and analyzed by one-way ANOVA with Tukey’s multiple comparisons. (c) Brain edema was analyzed on day 3 post-TBI and % water content was measured between the ipsilateral and contralateral hemispheres. Data shown as mean ± SEM and n = 3-4 mice/group were used. Data was analyzed by two-sided unpaired Student’s t-test. (d) Immunofluorescence staining of Iba-1 30-days post-TBI for early treatment in males at the peri-contusional cortex for DAPI (blue) and Iba-1 (red). Scale bars are 250 um. Five sections of each sample were prepared and the area around the contusion was captured and the number of Iba-1 positive cells around the contusion were quantified by Image J. Data shown as mean ± SEM and n = 5 mice/group were used. Data was analyzed by two-sided unpaired Student’s t-test. (e) Brain sections were stained with DAPI (blue) at 30 days post severe TBI in females and lesion volume was measured by image J software. Data shown as mean ± SEM and n = 4 mice/group were used. Data was analyzed by two-sided unpaired Student’s t-test. Scale bars are 1000 um. (f) Immunofluorescence staining of Iba-1 30 days post severe TBI in females in the at the peri-contusional cortex for DAPI (blue) and Iba-1 (red). Scale bars are 250 um. Five sections of each sample were prepared and the area around the contusion was captured and the number of Iba-1 positive cells around the contusion were quantified by Image J. Data shown as mean ± SEM and n = 4 mice/group were used. Data was analyzed by two-sided unpaired Student’s t-test. All data are biological replicates and are representative from two independent experiments. n.s. = non-significant. DPI indicates Days Post Injury.
Extended Data Fig. 3
Extended Data Fig. 3. Nasal anti-CD3 ameliorates adaptive immune response following TBI.
(a) Flow cytometry analysis and quantification of CD4 + T cells, CD4+FoxP3 +  and (b) CD8 + T cells, CD4 + LAP + , Th1, and Th17 at 1,3,7,14, and 30 days post TBI and nasal anti-CD3 treatment in the cervical lymph nodes, meninges, and Ipsilateral brain hemisphere. (Sham-Iso n = 4, TBI-Iso n = 6, TBI-aCD3 n = 6). Data shown as mean ± SEM and analyzed by one-way ANOVA with Tukey’s multiple comparisons for every individual timepoint (c) Flow cytometry analysis and quantification of neutrophils, monocytes, classical monocytes (7 days post-TBI), and NK cells at 1,3,7,14, and 30 days post TBI and nasal anti-CD3 treatment in Ipsilateral brain hemisphere. (Sham-Iso n = 4, TBI-Iso n = 6, TBI-aCD3 n = 6). Data shown as mean ± SEM and analyzed by one-way ANOVA with Tukey’s multiple comparisons for every individual timepoint. All data are biological replicates and are representative from two independent experiments.
Extended Data Fig. 4
Extended Data Fig. 4. Gating strategy of different immune cells in TBI.
(a) Gating strategy used to identify the different T-cell substypes. (b) Gating strategies used to identify different CD11b+ infiltrating cells and (c) CD11b+Ly6Chi monocytes.
Extended Data Fig. 5
Extended Data Fig. 5. Nasal anti-CD3 induces a unique immune modulatory signature in FoxP3 Tregs.
(a) Gating strategy used to identify and sort CD4+FoxP3(GFP)+ from the ipsilateral hemisphere of the brain and blood. (b) Overlap in differentially expressed genes in injured brain vs. sham blood Treg cells after injury with another study investigating the transcriptomic effects of stroke in brain vs. blood Treg cells. (c) Selected top predicted regulators using IPA based on DEGs in TBI-aCD3 vs. TBI-Iso blood Treg cells at 7 days post-TBI identified using DESeq2 analysis (two-sided Wald test, FDR-corrected P < 0.05). One-sided Fisher’s exact test. * P < 0.05, ** P < 0.01, *** P < 0.001. Results with FDR-corrected P < 0.05 were selected. (d) Predicted upstream regulator using IPA analysis based on DEGs of brain Tregs in TBI-aCD3 vs. TBI-Iso identified using DESeq2 analysis (two-sided Wald test, FDR-corrected P < 0.05). Due to the low number of FoxP3⁺ cells recruited to the brain, and ethical considerations, we limited the study to two biological replicates, following practices from previous studies in the field. Despite this limitation, the consistent and robust results observed support the validity of our findings.
Extended Data Fig. 6
Extended Data Fig. 6. Nasal anti-CD3 modulates chronic microglial response after TBI for different treatment regimens and TBI severities.
(a) Gating strategy for microglia. (b) Relative expression of cell types in Sham-Iso microglia (n = 3). (c) RT- qPCR of ipsilateral hemisphere 7 and 30 days post-TBI (immediate treatment males). Expression was normalized to GAPDH and presented relative to Sham-Iso. Data shown as mean ± SEM, (Sham-Iso n = 6, TBI-Iso n = 8, TBI-aCD3 n = 8) and analyzed by one-way ANOVA with Tukey’s multiple comparisons. (d) Heatmap signature of DEGs 30 days post-TBI (early treatment males) identified using DESeq2 analysis (two-sided likelihood ratio test, n = 5 mice/group, FDR-corrected P < 0.05). (e) Heatmap of genes in inflammatory response and genes of disease-associated microglia (DAM) and neurodegenerative microglia (MGnD) 30 days post-TBI (early treatment males). Genes identified with an FDR-corrected p-value < 0.05 using DESeq2 analysis are bolded (two-sided likelihood ratio test, n = 5 mice/group). (f) GSEA analysis of GO Biological Processes (BP) comparing TBI-aCD3 vs. TBI-Iso groups 30 days post-TBI (early treatment male mice). NES, normalized enrichment score. (g) RT- qPCR of ipsilateral hemisphere 30 days post-TBI (early treatment males). Expression normalized to GAPDH and presented relative to Sham-Iso. Data shown as mean ± SEM, (Sham-Iso n = 5, TBI-Iso n = 6, TBI-aCD3 n = 6) and analyzed by one-way ANOVA with Tukey’s multiple comparisons. (h) Venn diagram of DEGs in comparisons with Sham-Iso microglia group as baseline 30 days post-severe TBI (immediate treatment female mice): TBI-Iso, and TBI-aCD3. (i) Heatmap genes involved in inflammatory response and (DAM) and (MGnD) at 30 days following severe TBI (immediate treatment females). Genes identified with FDR-corrected p-value < 0.05 using DESeq2 analysis are bolded (two-sided likelihood ratio test, n = 5 mice/group). (j) RT- qPCR of ipsilateral hemisphere 30 days post-severe TBI (immediate treatment female). Expression was normalized to GAPDH and presented relative to Sham-Iso. Data shown as mean ± SEM, (Sham-Iso n = 5, TBI-Iso n = 6, TBI-aCD3 n = 6) and analyzed by one-way ANOVA with Tukey’s multiple comparisons. All data are biological replicates and are representative from two independent experiments. n.s. = non-significant.
Extended Data Fig. 7
Extended Data Fig. 7. Nasal anti-CD3 increases expression of phagocytosis machinery at 16 hours post injection of apoptotic neurons.
(a) Schematic presenting phagocytosis functional study. Created with BioRender.com. (b) In-vivo phagocytosis functional experiment where mice were injected with labelled apoptotic neurons and sacrificed 16 h post injection. Gating strategy showing phagocytic positive microglia in TBI-Iso and TBI-aCD3 animals. Data shown as box plots (min, max, interquartile range, median) and n = 5 mice/group were used. Data was analyzed by two-sided unpaired Student’s t-test. (c) Clustered heatmap of select DEGs of aggregated samples for phagocytic ( + P) and non-phagocytic (-P) microglia at 7 days following TBI and 16 hours post-injection of apoptotic neurons using DESeq2 analysis (two-sided likelihood ratio test, n = 5-6 mice/group, FDR-corrected P < 0.05). Identified genes pertinent to microglial phagocytosis and related functions are visualized through bar plots with log2-fold changes in phagocytic TBI-aCD3 microglia compared to non-phagocytic TBI-Iso microglia. (d) GSEA analysis of GO Biological Process (BP) comparing phagocytic TBI-aCD3 microglia to phagocytic TBI-Iso microglia at 7 days following TBI and 16 hours post-injection of apoptotic neurons. NES, normalized enrichment score. (e) Bar plots of select microglial homeostatic and neurodegenerative microglia (MGnD) markers in phagocytic TBI-aCD3 microglia compared to phagocytic TBI-Iso microglia at 7 days following TBI and 16 hours post-injection of apoptotic neurons. DEGs indicated with an asterisk: FDR-corrected P < 0.05; DEGs indicated with “*P”: P < 0.05 (DESeq2 analysis, two-sided Wald test, n = 5 mice/group). (f) Gating strategy showing how phagocytic microglia cells were identified. All data are biological replicates and are representative from two independent experiments. n.s. = non-significant.
Extended Data Fig. 8
Extended Data Fig. 8. Gating strategy of IL-10 production, tamoxifen induced microglia specific IL10ra reduction in gene expression, and FoxP3(GFP)+ gating strategy.
(a) Gating strategy for IL-10 expression on CD4 + , FoxP3 + , 4D4+ microglia, NK1.1 + , Ly6C + , and Ly6G+ cell and their fluorescence minus one (FMO) control. (b) Bar plot of Quantitative PCR of microglia sorted from the ipsilateral hemisphere at 7 days post TBI for microglia specific IL-10ra knockout Tmem119CreETR2:IL-10raFlx/Flx and their littermate controls Tmem119WT:IL-10raFlx/Flx. Mice were treated with tamoxifen for 5 straight days and were given a 2-week rest period before TBI. Expression was normalized to GAPDH. Data shown as mean ± SEM, n = 3 mice/group. Data was analyzed by two-sided unpaired Student’s t-test. The data are biological replicates and are representative from three independent experiments. (c) Gating strategy showing CD4+FoxP3 GFP+ and the population of CD4+FoxP3 GFP- from the spleen/cLN that was selected for the adoptive transfer experiments in Fig. 6 and Extended Data Fig. 9.
Extended Data Fig. 9
Extended Data Fig. 9. Nasal anti-CD3 induced Total CD4 + T-cells ameliorate microglial response and improved behavioral outcomes at chronic TBI.
(a) Schematic representing experimental timeline of adoptive transfer experiment. Created with BioRender.com. (b) Behavioral testing of rotarod, Morris water maze, probe trial, and anxiety like behavior (measured by the open field) was assessed between WT Sham (DPBS treated, baseline), Iso-total CD4+, aCD3-total CD4+, and aCD3-FoxP3-GFP groups. Morris water maze analyzed by two-factor repeated measures two-way ANOVA (group x time); others by one-way ANOVA with Tukey’s multiple comparisons. Data shown as mean ± SEM. (c) Visual representing an experiment where splenic CD4+ cells from 7 days treated TBI (FoxP3-GFP) animals were injected into untreated, but TBI-injured (CD45.1) animals and the %CD45.2 cells were analyzed by fluorescence-activated cell sorting (FACS) at 3 days after injection. Flow cytometry gating of brain, cervical lymph node, and spleen of (CD45.1) animals showing the percent of CD45.2 cell infiltration. n = 5 mice and the brain was a pool of 5 ipsilateral hemispheres. Created with BioRender.com. (d) Heatmap of DEGs from microglia 30 days following TBI and adoptive transfer identified using DESeq2 analysis (two-sided likelihood ratio test, n = 4 mice/group, FDR-corrected P < 0.05). Clusters of genes were functionally annotated using enriched GO Biological Process (BP) terms (q-value < 0.05). (e) GSEA analysis of GO Biological Process (BP) 30 days post-TBI based on the following comparisons: aCD3-Total CD4+ vs. Iso-Total CD4+, and aCD3-FoxP3-GFP vs. Iso-total CD4+. Asterisk (*) indicates enriched terms (q-value < 0.05). NES, normalized enrichment score; NS, not significant. (f) Volcano plot of DEGs in aCD3-total CD4+ vs. aCD3-FoxP3-GFP 30 days post-TBI identified using DESeq2 (two-sided Wald test, n = 4 mice/group). Labeled genes have an FDR-corrected P < 0.05. (g) GSEA analysis of GO Biological Process (BP) comparing aCD3-total CD4+ vs. aCD3-FoxP3-GFP 30 days post-TBI. NES, normalized enrichment score. (h) Predicted top upstream regulators using IPA analysis based on DEGs in aCD3-total CD4+ vs. aCD3-FoxP3-GFP 30 days post-TBI. (i) RT- qPCR of ipsilateral hemisphere 30 days post-TBI and expression normalized to GAPDH. Data shown as mean ± SEM, n = 5 mice/group and analyzed by one-way ANOVA with Tukey’s multiple comparisons. All data are biological replicates and are representative from two independent experiments. n.s. = non-significant.
Extended Data Fig. 10
Extended Data Fig. 10. Validation of FoxP3 depletion in FoxP3-DTR mice following Diphtheria toxin (DT) injection and Gating strategy of FoxP3+Thy1.1+ IL-10 producing FoxP3 Tregs.
(a) Flow cytometry gating showing depletion of FoxP3+ Tregs after DT injection compared to DPBS injected for FoxP3-DTR mice 7 days post-TBI in the ipsilateral brain hemisphere, cLN, and spleen. DT was injected 3 days prior to TBI and was given every third day to sustain FoxP3 depletion. Data shown as mean ± SEM, n = 3 mice/group. Data was analyzed by two-sided unpaired Student’s t-test. The data are biological replicates and are representative from three independent experiments. (b) Gating strategy showing FoxP3+Thy1.1+ and FoxP3+Thy1.1- from the spleen/cLN of dual reporter 10BiT.FoxP3GFP mice that was selected for the adoptive transfer experiments for Fig. 7.

References

    1. Faul, M. & Coronado, V. Epidemiology of traumatic brain injury. Handb. Clin. Neurol.127, 3–13 (2015). - PubMed
    1. Centers for Disease Control and Prevention. Surveillance Report of Traumatic Brain Injury-related Emergency Department Visits, Hospitalizations, and Deaths—United States, 2014 (CDC, 2019).
    1. Taylor C. A., Bell, J. M., Breiding, M. J. & Xu L. Traumatic brain injury-related emergency department visits, hospitalizations, and deaths, United States 2007 and 2013. MMWR Surveill. Summ.66, 1–16 (2017). - PMC - PubMed
    1. Shively, S., Scher, A. I., Perl, D. P. & Diaz-Arrastia, R. Dementia resulting from traumatic brain injury: what is the pathology? Arch. Neurol.69, 1245–1251 (2012). - PMC - PubMed
    1. Izzy, S. et al. Association of traumatic brain injury with the risk of developing chronic cardiovascular, endocrine, neurological, and psychiatric disorders. JAMA Netw. Open5, e229478 (2022). - PMC - PubMed

MeSH terms

LinkOut - more resources