

Spatio-temporal analysis of urban expansion and land use dynamics using google earth engine and predictive models
- PMID: 40016446
- PMCID: PMC11868624
- DOI: 10.1038/s41598-025-92034-4
Spatio-temporal analysis of urban expansion and land use dynamics using google earth engine and predictive models
Abstract
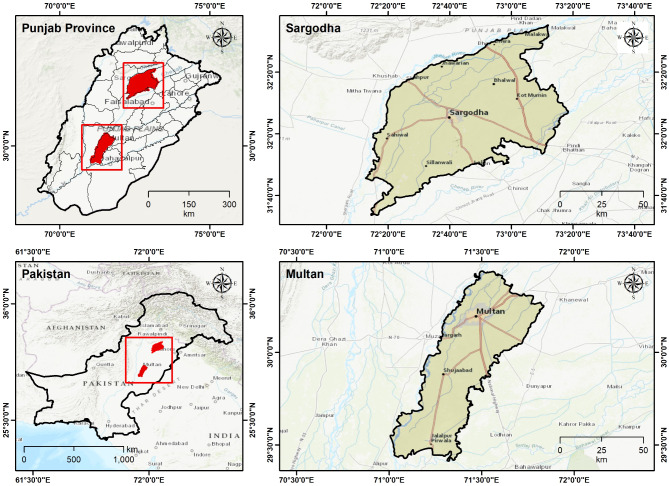
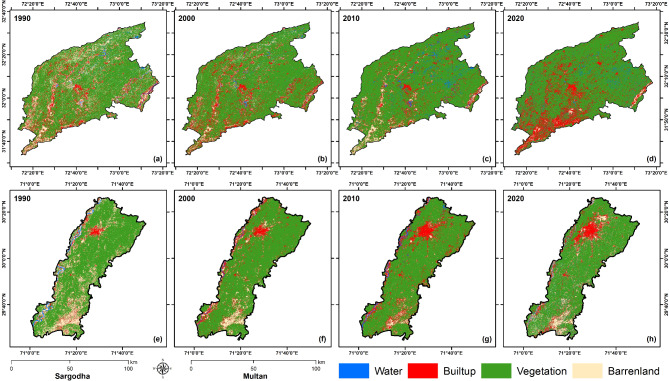
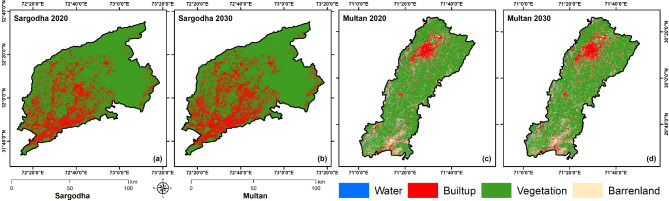
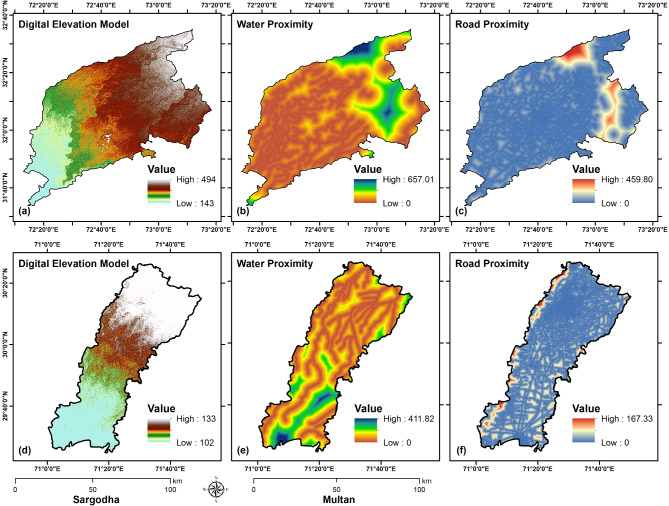
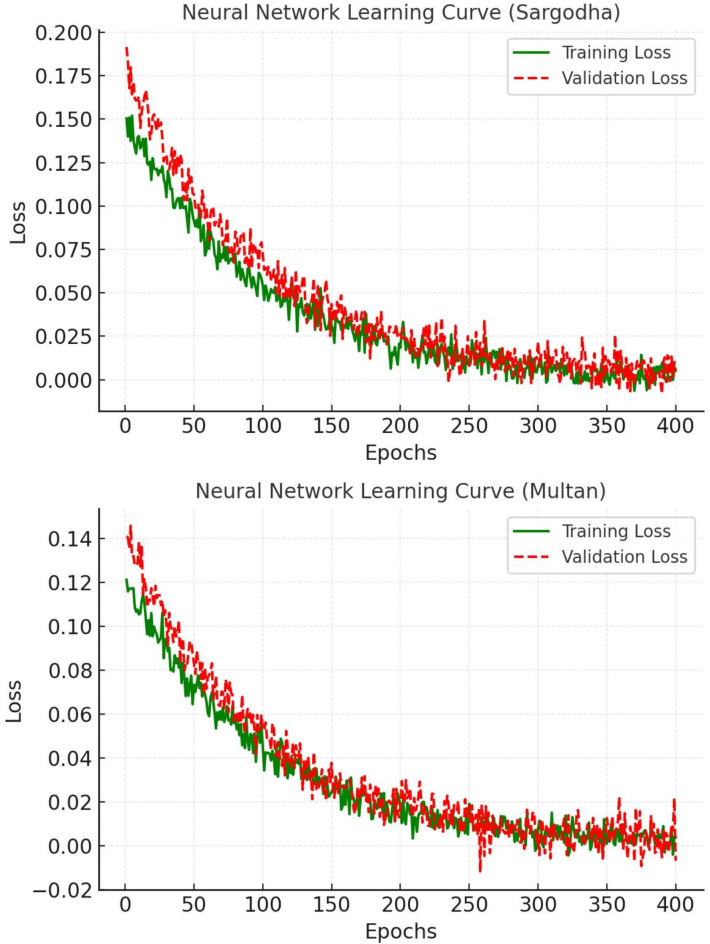
Urban expansion and changes in land use/land cover (LULC) have intensified in recent decades due to human activity, influencing ecological and developmental landscapes. This study investigated historical and projected LULC changes and urban growth patterns in the districts of Multan and Sargodha, Pakistan, using Landsat satellite imagery, cloud computing, and predictive modelling from 1990 to 2030. The analysis of satellite images was grouped into four time periods (1990-2000, 2000-2010, 2010-2020, and 2020-2030). The Google Earth Engine cloud-based platform facilitated the classification of Landsat 5 ETM (1990, 2000, and 2010) and Landsat 8 OLI (2020) images using the Random Forest model. A simulation model integrating Cellular Automata and an Artificial Neural Network Multilayer Perceptron in the MOLUSCE plugin of QGIS was employed to forecast urban growth to 2030. The resulting maps showed consistently high accuracy levels exceeding 92% for both districts across all time periods. The analysis revealed that Multan's built-up area increased from 240.56 km2 (6.58%) in 1990 to 440.30 km2 (12.04%) in 2020, while Sargodha experienced more dramatic growth from 730.91 km2 (12.69%) to 1,029.07 km2 (17.83%). Vegetation cover remained dominant but showed significant variations, particularly in peri-urban areas. By 2030, Multan's urban area is projected to stabilize at 433.22 km2, primarily expanding in the southeastern direction. Sargodha is expected to reach 1,404.97 km2, showing more balanced multi-directional growth toward the northeast and north. The study presents an effective analytical method integrating cloud processing, GIS, and change simulation modeling to evaluate urban growth spatiotemporal patterns and LULC changes. This approach successfully identified the main LULC transformations and trends in the study areas while highlighting potential urbanization zones where opportunities exist for developing planned and managed urban settlements.
Keywords: Cloud computing; LULC; MOLUSCE; Time series; Urban planning.
© 2025. The Author(s).
Conflict of interest statement
Declarations. Competing interests: The authors declare no competing interests. Software: Maps and spatial analyses in this study were generated using ArcGIS version 10.8 (Esri Inc., Redlands, CA, USA; https://www.esri.com/en-us/arcgis/about-arcgis/overview ).
Figures

References
-
- Asif, M. et al. Modelling of land use and land cover changes and prediction using CA-Markov and Random Forest. Geocarto Int.38, (2023).
-
- Asif, M., Kazmi, J. H. & Tariq, A. Traditional ecological knowledge based indicators for monitoring rangeland conditions in Thal and Cholistan Desert, Pakistan. Environ. Challenges13, 100754 (2023). - DOI
-
- Zhao, Z. et al. Comparison of three machine learning algorithms using google earth engine for land use land cover classification. Rangel. Ecol. Manag.92, 129–137 (2024). - DOI
LinkOut - more resources
Full Text Sources
