. 2025 Apr;54(4):92-102.
doi: 10.1038/s41684-025-01506-7. Epub 2025 Feb 27.

Use of HSALR female mice as a model for the study of myotonic dystrophy type I

Affiliations

Use of HSALR female mice as a model for the study of myotonic dystrophy type I

Marc Carrascosa-Sàez et al. Lab Anim (NY). 2025 Apr.

Abstract

HSALR mice are the most broadly used animal model for studying myotonic dystrophy type I (DM1). However, so far, HSALR preclinical studies have often excluded female mice or failed to document the biological sex of the animals. This leaves an unwanted knowledge gap concerning the differential development of DM1 in males and females, particularly considering that the disease has a different clinical presentation in men and women. Here we compared typical functional measurements, histological features, molecular phenotypes and biochemical plasma profiles in the muscles of male and female HSALR mice in search of any significant between-sex differences that could justify this exclusion of female mice in HSALR studies and, critically, in candidate therapy assays performed with this model. We found no fundamental differences between HSALR males and females during disease development. Both sexes presented comparable functional and tissue phenotypes, with similar molecular muscle profiles. The only sex differences and significant interactions observed were in plasma biochemical parameters, which are also intrinsically variable in patients with DM1. In addition, we tested the influence of age on these measurements. We therefore suggest including female HSALR mice in regular DM1 studies, and recommend documenting the sex of animals, especially in studies focusing on metabolic alterations. This will allow researchers to detect and report any potential differences between male and female HSALR mice, especially regarding the efficacy of experimental treatments that could be relevant to patients with DM1.


Conflict of interest statement

Competing interests: The authors declare no competing interests.

Figures
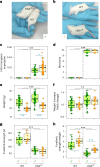
Fig. 1
Fig. 1. Organismal-level phenotypes.
a,b, The size of male (a) and female (b) HSALR animals is increased compared with control WT. c, The human HSA transgene is expressed in the quadriceps and gastrocnemius of HSALR mice, but not in the muscles of WT mice. Slight but significant differences are detected in HSA transgene expression between female and male HSALR muscles (n = 10, n = 15, n = 10, n = 23, for WT males and females and HSALR males and females respectively). This observation explains the effect of sex and interaction genotype × sex observed with ANOVA (Supplementary Fig. 2). d, Strong myotonia is observed in HSALR animals (n = 27, n = 3, n = 42, n = 11). e,f, Weight measurements show that females are smaller than males (n = 37, n = 15, n = 42, n = 19) (e), and normalization to WT weight shows that weight increases consistently in both male and female HSALR animals (f). g, Forelimb strength, measured in seconds, is comparable between males and females and significantly reduced in HSALR animals (n = 14, n = 15, n = 17, n = 19). h, Forelimb strength normalized to weight shows significant differences between sexes and genotypes. The boxes indicate the two central quartiles, the midline represents median values and the whiskers indicate the minimum and maximum data value, excluding outliers. Statistical analysis was performed using two-way ANOVA (WT versus HSALR, males versus females). Differences between WT and HSALR are represented as black asterisks. Differences between sexes were confirmed using the Wilcoxon test and are represented as blue asterisks. ***P < 0.001; **P < 0.01; *P < 0.05.
Fig. 2
Fig. 2. Muscle histology in male and female WT and HSALR mice.
a, Representative bright-field microscopy pictures (200× magnification; scale bar, 50 µm) of hematoxylin–eosin staining of quadriceps sections showing an increase in the amount of central nuclei (black arrows) in HSALR mice. b, The percentage of fibers with central nuclei is dramatically increased in HSALR muscles (quadriceps and gastrocnemius combined; WT males n = 21, WT females n = 19, HSALR males n = 37, HSALR females n = 24). c, Representative confocal images (gastrocnemius; 400× magnification) showing the detection of CUG repeats (green) and agglutinin (red) as a marker of cell membrane. d, The percentage of nuclei with foci in the muscles studied (quadriceps and gastrocnemius combined). The individual quantification of each slide is shown (seven slides per muscle per mouse; WT males n = 5, WT females n = 5, HSALR males n = 5, HSALR females n = 5). e, Representative confocal images (gastrocnemius; 400× magnification) where MBNL1 was stained (green). f, MBNL1 fluorescence was quantified (quadriceps and gastrocnemius combined). The mean quantification of the slides is shown (seven slides per muscle per mouse; WT males n = 5, WT females n = 5, HSALR males n = 5, HSALR females n = 5). The boxes indicate the two central quartiles, the midline represents median values and the whiskers indicate the minimum and maximum data value, excluding outliers. Statistical analysis was performed using two-way ANOVA (WT versus HSALR, males versus females). Differences between WT and HSALR are represented as black asterisks. Differences between sexes were confirmed using the Wilcoxon test and are represented as blue asterisks. ***P < 0.001; **P < 0.01; *P < 0.05.
Fig. 3
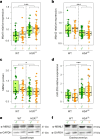
Fig. 3. Muscleblind family gene expression analysis.
a, Mbnl1 gene expression, measured by qRT–PCR, is significantly increased in HSALR muscles compared with WT. b, By contrast, Mbnl2 expression is reduced in HSALR muscles. c, MBNL1 protein levels, as measured by quantitative dot blot, show a significant decrease in HSALR muscles compared with WT. d, miR-218 levels are increased in the muscles of HSALR animals compared with WT. The boxes indicate the two central quartiles, the midline represents median values and the whiskers indicate the minimum and maximum data value, excluding outliers. e,f, Representative western blot membranes depicting MBNL1 protein levels in quadriceps (e) and gastrocnemius (f). Statistical analysis was performed using two-way ANOVA (black asterisks) ***P < 0.001; *P < 0.05. Sample sizes for the whole figure: n = 10, n = 15, n = 17 and n = 24 for WT males and females and HSALR males and females, respectively. Quadriceps and gastrocnemius were analyzed for each individual.
Fig. 4
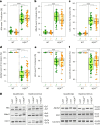
Fig. 4. Alternative splicing defects.
Comparison of typical missplicing events in HSALR muscles in males (green) and females (orange). af, Percentages of abnormal inclusion of exon 7 in Nfix (a), exon 5 in Mbnl1 (b) and exon 7a in Clcn1 (c) transcripts and abnormal exclusion of exon 22 in Atp2A1 (d), exon 11 in Bin1 (e) and exon 29 in Cacna1s (f). The boxes indicate the two central quartiles, the midline represents median values and the whiskers indicate the minimum and maximum data value, excluding outliers. g, Representative images of agarose gel electrophoresis from semiquantitative PCR determinations of the indicated alternative exons (Ex). Statistical analysis was performed using two-way ANOVA (black asterisks). Minor effects are observed due to the sex of the animals, which are confirmed only in Atp2a1 using the Wilcoxon test (blue asterisks) ***P < 0.001; **P < 0.01; *P < 0.05. Sample sizes for the whole figure: n = 10, n = 15, n = 17 and n = 24 for WT males and females and HSALR males and females, respectively, except Clcn1 (n = 7, n = 14, n = 17 and n = 24 for WT males and females and HSALR males and females, respectively). Quadriceps and gastrocnemius were both analyzed for each individual.
Fig. 5
Fig. 5. Plasma biochemical parameters.
af, Plasma levels of cholesterol (a), triglycerides (b), CPK (c), LDH (d), AST (e) and glucose (f) were analyzed in WT and HSALR mice. The boxes indicate the two central quartiles, the midline represents median values and the whiskers indicate the minimum and maximum data value, excluding outliers. Statistical analysis was performed using two-way ANOVA (black asterisks). Detected differences between sexes were confirmed using the Wilcoxon test (blue asterisks) ***P < 0.001; **P < 0.01; *P < 0.05. Sample sizes for the whole figure: n = 12, n = 13, n = 19 and n = 13 for WT males and females and HSALR males and females, respectively.

Similar articles

References

    1. Liao, Q., Zhang, Y., He, J. & Huang, K. Global prevalence of myotonic dystrophy: an updated systematic review and meta-analysis. Neuroepidemiology56, 163–173 (2022). - PubMed
    1. Brook, J. D. et al. Molecular basis of myotonic dystrophy: expansion of a trinucleotide (CTG) repeat at the 3′ end of a transcript encoding a protein kinase family member. Cell68, 799–808 (1992). - PubMed
    1. Mahadevan, M. et al. Myotonic dystrophy mutation: an unstable CTG repeat in the 3′ untranslated region of the gene. Science255, 1253–1255 (1992). - PubMed
    1. Thornton, C. A. Myotonic dystrophy. Neurol. Clin.32, 705–719 (2014). - PMC - PubMed
    1. LoRusso, S., Weiner, B. & Arnold, W. D. Myotonic dystrophies: targeting therapies for multisystem disease. Neurotherapeutics15, 872–884 (2018). - PMC - PubMed

LinkOut - more resources