. 2025 Mar;26(3):429-443.
doi: 10.1038/s41590-025-02090-1. Epub 2025 Feb 27.

Autophagy repression by antigen and cytokines shapes mitochondrial, migration and effector machinery in CD8 T cells

Affiliations

Autophagy repression by antigen and cytokines shapes mitochondrial, migration and effector machinery in CD8 T cells

Linda V Sinclair et al. Nat Immunol. 2025 Mar.

Abstract

Autophagy shapes CD8 T cell fate; yet the timing, triggers and targets of this process are poorly defined. Herein, we show that naive CD8 T cells have high autophagic flux, and we identify an autophagy checkpoint whereby antigen receptor engagement and inflammatory cytokines acutely repress autophagy by regulating amino acid transporter expression and intracellular amino acid delivery. Activated T cells with high levels of amino acid transporters have low autophagic flux in amino-acid-replete conditions but rapidly reinduce autophagy when amino acids are restricted. A census of proteins degraded and fueled by autophagy shows how autophagy shapes CD8 T cell proteomes. In cytotoxic T cells, dominant autophagy substrates include cytolytic effector molecules, and amino acid and glucose transporters. In naive T cells, mitophagy dominates and selective mitochondrial pruning supports the expression of molecules that coordinate T cell migration and survival. Autophagy thus differentially prunes naive and effector T cell proteomes and is dynamically repressed by antigen receptors and inflammatory cytokines to shape T cell differentiation.


Conflict of interest statement

Competing interests: The authors declare no competing interests.

Figures
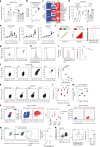
Fig. 1
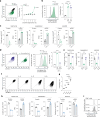
Fig. 1. Immune-activated T cells repress autophagy flux.
ad, Data are from naive, 24 h antigen-activated P14-CD8 T cells (TCR) and IL-2-maintained CTLs. a, MAP1LC3B protein copies per cell and mRNA (fragments per kilobase million (FPKM)). b, Summed copies of core autophagy proteins (Source Data Fig. 1). c, Heatmap of autophagy machinery. d, SQSTM1 protein copies and mRNA. e, MAP1LC3B, GABARAPL2 and SQSTM1 protein copies from naive and antigen-activated OT-1 CD8 T cells. f, Schematic flow cytometry data of cells expressing mCherry–GFP–LC3b autophagy reporters. Equivalent GFP and mCherry fluorescence indicates no autophagy; GFP fluorescence quenching indicates high autophagy. mCherry/GFP fluorescence-derived parameters plotted as histograms. g, GFP/mCherry fluorescence profiles of mCherry–GFP–LC3b CD8 T cells: naive (left) and CTL (right). h, Autophagy flux in mCherry–GFP–LC3b CD8 cells: naive (left) and CTL (right). i, Autophagy flux in mCherry–GFP–LC3b naive CD8 T cells maintained in IL-7 ± bafilomycin A (BAF, 200 nM) for 5 h. j, GFP/mCherry fluorescence and autophagy flux in naive, 4 h or 24 h, CD3/CD28-activated mCherry–GFP–LC3b CD8 T cells and CTLs. ko, Autophagy reporter mice were infected with OVA expressing Listeria monocytogenes (LmOVA). k, GFP/mCherry fluorescence of splenic CD8 cells from uninfected (naive) and day 1, 3 and 7 LmOVA-infected mCherry–GFP–LC3b mice. l, Autophagy flux of CD44+ CD8 T cells from day 1, 3 and 7 LmOVA-infected or uninfected mCherry–GFP–LC3b mice. m, Forward-scatter mean fluorescence intensity (MFI) of mCherry–GFP–LC3b CD8 T cells with high or repressed autophagy on day 1 and day 3 post LmOVA infection. n, CD62L/CD44 levels on mCherry–GFP–LC3b CD8 T cells on day 3 post LmOVA infection. o, Forward-scatter vs side-scatter profiles of GFP–mCherry–LC3b CD8 T cells with high or repressed autophagy on day 3 post LmOVA infection. p,q Flow cytometry analysis of tumor-infiltrating CD8 T cells (CD8-TILs) from MC38 tumors engrafted in GFP–mCherry–LC3b mice. p, GFP/mCherry fluorescence of mCherry–GFP–LC3b CD8-TILs (left) and forward-scatter analysis comparing high and repressed autophagy CD8-TILs (right). q, CD8-TIL autophagy flux and PD1 expression (left); autophagy flux of PD1 and PD1+ CD8-TIL vs naive CD8 T cells (right). Proteomic data in ad are from ref. or ref. ; mRNA data are from ref. . Data are from n = 3 (ae,j), n = 6 (g,h), n = 4 (i), n = 9 (ko) and n = 3 (p,q) mice or biological replicates per condition. Flow plots show representative data. Bar charts and violin plot data indicate biological replicates. Error bars, s.d. Source data
Fig. 2
Fig. 2. Pro-inflammatory but not memory cytokines repress autophagy flux.
a, Representative GFP/mCherry fluorescence profiles from mCherry–GFP–LC3b autophagy reporter CTLs maintained with and without IL-2 for 24 h (left) and autophagy flux over the expanded time course (right). b, Autophagy flux in mCherry–GFP–LC3b CTLs maintained with and without IL-2 or the JAK inhibitor ruxolitinib (rux, 1 µM) for 24 h (left) and mean autophagy flux (right). c, MAP1LC3B, GABARAP2L and SQSTM1 mean protein copies per cell and mRNA (shown as FPKM) from CTLs maintained with and without IL-2 over 24 h. d, GFP/mCherry fluorescence profiles (left), autophagy flux histogram (center) the mean autophagy flux (mCherry/GFP) values (right) from mCherry–GFP–LC3b CTLs maintained with IL-2, IL-12 + IL-18 or no cytokine for 24 h. e, MAP1LC3B, GABARAP2L and SQSTM1 protein copies per cell from CTLs maintained with IL-2, IL-12 + IL-18 or no cytokine for 24 h. f, GFP/mCherry fluorescence profiles of antigen-activated mCherry–GFP–LC3b CD8 T cells expanded with IL-2 (CTL) or switched into IL-4 or IL-21 for 24 h, or expanded with IL-15 (memory-like). g, Mean autophagy flux from mCherry–GFP–LC3b CTLs expanded with IL-2 or switched into IL-4 or IL-21 for 24 h, or antigen-activated CD8 T cells expanded with IL-15 (memory-like). h, MAP1LC3B, GABARAP2L and SQSTM1 protein copies per cell and mRNA (shown as transcripts per million (TPM)) from antigen-activated CD8 T cells expanded with IL-2 or IL-15. i, Autophagy flux in mCherry–GFP–LC3b CD8 T cells, either ex vivo or maintained in IL-7 for 4 h or 24 h; corresponding MFI is indicated. Data in c, e, and h are derived from refs. ,,, respectively. Data are from n = 3 mice or biological replicates per condition. Flow plots show representative data. Bar charts and violin plot data indicate biological replicates. Error bars, s.d.
Fig. 3
Fig. 3. Amino acid supply controls autophagy in CD8 T cells.
a, Kynurenine (KYN; System L substrate) uptake of antigen-activated CD8 T cells maintained in IL-2, IL-4, IL-21 and IL-15. b, Flow cytometry profiles of autophagy flux and kynurenine uptake of antigen-activated CD8 T cells maintained in indicated cytokines for 24 h. c, Protein copies per cell of SLC7A5, SLC1A5 and SLC7A1 in CTLs and antigen-activated OT-1 CD8 T cells. d, GFP/mCherry fluorescence of 24 h CD3/CD28-activated mCherry–GFP–LC3b CD8 T cells. Left panel, high and repressed autophagy flux is indicated; center panel, kynurenine uptake in IL-7 maintained, or high vs repressed autophagy of CD3/CD28-activated CD8 cells; right panel, kynurenine uptake in presence or absence of BCH (System L competitive substrate). e, Left panel, GFP/mCherry fluorescence of mCherry–GFP–LC3b CD8 T cells from day 3 LmOVA-infected mice; high and repressed autophagy populations indicated. Center and right panels, kynurenine uptake of high and repressed autophagy populations. UIC, uninfected control. f, Autophagy flux and kynurenine uptake of CD44+ mCherry–GFP–LC3b CD8 T cells from day 3 LmOVA-infected mice. g, Kynurenine uptake of CD44+ and CD44 mCherry–GFP–LC3b CD8 T cells from day 7 LmOVA-infected or control mice. h, Autophagy flux and KYN uptake of CD44+ mCherry–GFP–LC3b CD8 T cells from day 7 LmOVA-infected mice. i, Autophagy flux of IL-7 maintained or 24 h CD3/CD28-activated mCherry–GFP–LC3b CD8 T cells cultured in RPMI or HBSS. j, Autophagy flux of mCherry–GFP–LC3b CD8 T cells ex vivo or 24 h CD3/CD28-activated in RPMI/HBSS/RPMI lacking methionine (no Met), arginine (no Arg) or glutamine (no Gln). k, Left panel, GFP/mCherry fluorescence of mCherry–GFP–LC3b CTLs maintained in RPMI, or switched into HBSS ± 200 nM BAF for 24 h. Right panel, autophagy flux over experimental time course. l, Left panel, autophagy flux in mCherry–GFP–LC3b CTLs maintained in RPMI, switched into HBSS or RPMI lacking methionine, arginine or glutamine for 24 h. Right panel, autophagy flux time course for these conditions. m, Left panel, autophagy flux of mCherry–GFP–LC3b CTLs maintained in RPMI or HBSS (no amino acids (no AA)) for 12 h, and HBSS for 12 h followed by RPMI for 10 h. Right panel, autophagy flux in CTLs maintained in RPMI or HBSS for 12 h, followed by RPMI for 6 h, 8 h and 10 h. Proteomic data in c are from ref. . Data are from n = 5–6 (a,b), n = 3 (c,im), n = 4 (d), n = 3–9 (eh) and n = 5–6 (a,b) mice or biological replicates per condition. Flow plots show representative data. Bar charts and violin plot data indicate biological replicates. Error bars, s.d. Data in k and l were analyzed using two-way ANOVA with Fisher’s least significant difference test.
Fig. 4
Fig. 4. VPS34-dependent and AMPK and mTORC1-independent autophagy in CD8 T cells.
a, mCherry/GFP flow cytometry plots of mCherry–GFP–LC3b CTLs maintained in the presence of full amino acids (RPMI) ± VPS34 inhibitor (VPS34i) or depleted of amino acids (in HBSS) ± VPS34i for 24 h (left panels). Right panels show the corresponding autophagy flux histogram and means. b, Autophagy flux histogram (left) and the mean autophagy flux (right) of naive mCherry–GFP–LC3b CD8 T cells maintained in IL-7 ± VPS34i for 6 h. c, Representative mCherry/GFP plots (left) and corresponding mean autophagy flux (right) of mCherry–GFP–LC3b CTLs maintained in the presence of full amino acids (RPMI), depleted of amino acids (HBSS), switched into glucose-free RPMI (no Glu) or treated with rapamycin (Rap, 20 nM) for 24 h. d, Autophagy flux values over the expanded time course of mCherry–GFP–LC3b CTLs treated as in c. e, Autophagy flux histograms (left) and mean autophagy flux values (right) of CTLs from control (WT) mCherry–GFP–LC3b mice or CD4CreAMPKfl/fl (AMPK KO) mCherry–GFP–LC3b autophagy reporter mice maintained in the presence of full amino acids (RPMI), depleted of amino acids (HBSS) or switched into glucose-free RPMI (no glucose) for 24 h. f, Mean autophagy flux values of mCherry–GFP–LC3b CTLs maintained in the presence of full amino acids (RPMI), depleted of amino acids (HBSS) or treated with halofuginone (HF; 100 nM) for 24 h (left panel) and over the expanded time course (right panel). Data are from n = 3 mice or experimental replicates per condition. Bar chart and violin plots indicate biological replicates. Different experiments are indicated by different data points in the violin plot (e). Error bars, s.d. Time course data in d and f were analyzed using two-way ANOVA with Fisher’s least significant difference test.
Fig. 5
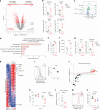
Fig. 5. VPS34 controls autophagy/protein degradation in amino-acid-starved CTLs.
a, Schematic diagram showing the four CTL treatment conditions (18 h) for subsequent proteomic analysis. b, Volcano plot showing ratio changes for proteins expressed in CTLs in RPMI with or without VPS34i treatment. P values below 0.05 and fold change above 1.5 are marked in red. c, Total protein content of CTLs in amino-acid-replete media (RPMI) or amino-acid-deprived media (HBSS) with or without VPS34i for 18 h. d, Volcano plot showing ratio changes for proteins in CTLs in RPMI compared with amino-acid-deprived (HBSS) CTLs. P values below 0.05 and fold change above 1.5 are marked in red. e, The proportion of the CTL proteome changed upon amino acid starvation (RPMI into HBSS; left) and the proportion of the amino-acid-starved CTL proteome that increased upon VPS34 inhibition (HBSS to VPS34i; right). f, Volcano plot showing ratio changes of proteins in amino-acid-deprived (HBSS) CTLs compared to amino-acid-deprived (HBSS) CTLs treated with VPS34i. P values below 0.05 and fold change above 1.5 are marked in red. g, Clustered enrichment analysis on proteins from amino-acid-deprived (HBSS) CTLs that were significantly increased with VPS34i treatment. UBL, ubiquitin and ubiquitin-like. hj Mean protein copy numbers per cell of RETREG1 (h), YIPF3 (i) and GZMB and perforin (PRF1) (j). k, Target cell killing capacity of CTLs maintained in IL-2 or deprived of IL-2 with or without VPS34i for 24 h. Data are from n = 4 (aj) and n = 6 (k) mice per condition. The full list of proteins and enrichment lists are available in Source Data Figs. 5, 6 and 7. Bar chart data indicate biological replicates. Error bars, s.d. Source data
Fig. 6
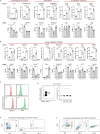
Fig. 6. VPS34 controls metabolic remodeling in amino-acid-starved CTLs.
a, Quantitative proteomics data showing mean protein copy numbers per cell of amino acid transporters SLC1A5, SLC7A1, SLC7A5 and SLC7A6 from CTLs in amino-acid-replete (RPMI) or amino-acid-deprived (HBSS) media with or without VPS34i for 18 h. b, SLC1A5 transport capacity as measured by azidohomoalanine (AHA) uptake (left) and SLC7A5 transport capacity as measured by KYN uptake (right) from CTLs in amino-acid-replete (RPMI) or amino-acid-deprived (HBSS) media with or without VPS34i for 18 h. c, Heatmap of mitochondrial proteins (Gene Ontology GO:0005739; MitoCarta3.0) from CTLs in amino-acid-replete (RPMI) or amino-acid-deprived (HBSS) media with or without VPS34i for 18 h. d, Summed protein copy number of electron transport chain (ETC; MitoCarta3.0 ‘OXPHOS’). e, Protein copies per cell of MPC2. f, Summed protein copy number of TCA cycle proteins (KEGG module M00009). gj, Protein copy numbers per cell of enzymes and regulators involved in fatty acid oxidation (g), amino acid metabolism (h), glucose transport (i) and lactate transport (j) as indicated. k,l, Predicted ATP generated from glycolysis (k) or OXPHOS (l) by CTLs maintained in amino-acid-replete (RPMI) or amino-acid-deprived (HBSS) media with or without VPS34i for 18 h. Data are from n = 4 (aj), n = 3 (k,l) mice per condition. The full list of proteins and enrichment lists are available in Source Data Figs. 5, 6 and 7. Bar chart and violin plots indicate biological replicates. Error bars, s.d. Source data
Fig. 7
Fig. 7. Survival programs in amino-acid-starved CTLs depend on VPS34.
a, Heatmap of the subset of proteins from CTLs that are significantly changed upon amino acid deprivation (HBSS) and with VPS34i. b, Clustered enrichment analysis on proteins from amino-acid-deprived (HBSS) CTLs that were significantly decreased with VPS34i treatment. c, Protein content of mitochondrial proteins relative to total cell mass. d, Protein copy numbers per cell of ABCB6, PRXD2 and MT1 from CTLs maintained in amino-acid-replete (RPMI) or amino-acid-deprived (HBSS) media with or without VPS34i. e, Proportion live CTLs in amino-acid-replete (RPMI) or amino-acid-deprived (HBSS) media with or without VPS34i or BAF for 18 h. f, Representative flow cytometry data showing Mitosox staining (left) and proportion of Mitosox-high cells (right) from CTLs in amino-acid-replete (RPMI) or amino-acid-deprived (HBSS) media with or without VPS34i for 18 h. Data are from n = 4 (ad), n = 6 (e) and n = 4 (f) mice per condition. The full list of proteins and enrichment lists are available in Source Data Figs. 5, 6 and 7. Bar chart and violin plots indicate biological replicates. Error bars, s.d. Source data
Fig. 8
Fig. 8. VPS34 control of autophagy and protein degradation in naive CD8 T cells.
a, Volcano plot showing ratio changes of proteins in IL-7-maintained CD8 T cells treated with VPS34i for 5 h. P values below 0.05 and fold change above 1.5 are marked in red. b, Protein copies per cell of SQSTM1, SEC62, RTN3 and CALCOCO1. c, Flow cytometry staining of IL-7Rα expression on CD8 T cells, either ex vivo or maintained in IL-7 with or without VPS34i for 4–24 h. MFI values are presented. d, Clustered enrichment analysis of proteins increased in naive CD8 T cells treated with VPS34i for 5 h ef, Mitochondrial protein content relative to total cell mass (e) and fluorescence intensity (MFI) values of MitoTracker Deep Red staining (f) of CD8 T cells maintained in IL-7 with or without VPS34i for 5 h. g, Protein copies per cell of ACLY and TOMM40 from IL-7-maintained CD8 T cells ± VPS34i for 5 h. h, Heatmap of mitochondrial proteins (GO:0005739; MitoCarta3.0). i, Mitophagy flux profiles of mitophagy reporter CD8 cells maintained in IL-7 or activated through the TCR (aCD3/CD28) for 6 h (left) and corresponding mean mitophagy flux values (right). j, Ranked expression of transcription factors (GO:00037000) detected by proteomics. A 1.5-fold decrease with VPS34i is shown in black, and a 1.5-fold increase with VPS34i is shown in red. k, Percentage live CD8 T cells maintained in IL-7 with or without VPS34i for 4–24 h. l, Protein copies per cell of SELL (CD62L) from CD8 T cells maintained in IL-7 ± VPS34i for 5 h. m, CD62L surface expression on CD8 T cells maintained in IL-7 with or without VPS34i for 6 h; corresponding MFI values are presented in the plot. n, Flow cytometry MFI values of CD62L surface staining from CD8 T cells maintained in IL-7 ± VPS34i or BAF for 6 h. Data are from n = 3 (aj,l), n = 6 (k) and n = 4–8 (m,n) mice per condition. The full list of proteins and enrichment lists are available in Source Data Fig. 8. Bar chart and violin plots indicate biological replicates. Error bars, s.d. Source data
Extended Data Fig. 1
Extended Data Fig. 1. Expression of autophagy related proteins during immune activation.
Related to Fig. 1. A, B Quantitative proteomics data showing mean protein copy number per cell and RNASeq data shown as FPKM from naïve, 24 h TCR activated P14 CD8 T cells and IL-2 maintained effector CD8 T cells (CTL) for A) ULK1, VPS34(PIK3C3), GABARAP, GABARAPL2, ATG5, ATG7 and WIPI2 and B) FUNDC1, TAX1BP1, BNIP3L, OPTN, FAM134B, SEC63, ATL3 and TEX264. C Representative flow cytometry data showing mCherry (left) and GFP (right) fluorescence profiles of ex vivo, naïve CD8 cells and IL-2 maintained effector CD8 T cells (CTL). D GFP:mCherry:LC3b autophagy reporter mice were infected with attenuated OVA expressing Listeria monocytogenes (LmOVA). Representative flow cytometry of CD44 and KLRG1 expression (left) and matched FSc MFI (right) from CD8 T cells on D7 post LmOVA infection. E, F Representative gating strategies for identification of single CD8 T cells with or without DAPI staining for viability. Proteomic data are from Howden et al. or Immpres.co.uk. mRNA data are from Spinelli et al.. Data are from a minimum of 3 experimental repeats. Bar charts data indicate biological replicates. Error bars represent means +/-SD.
Extended Data Fig. 2
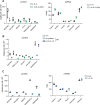
Extended Data Fig. 2. Expression of autophagy related proteins in response to pro-inflammatory or memory cytokines.
Related to Fig. 2. A Quantitative proteomics data of the indicated proteins showing mean protein copy number per cell (left) and RNASeq data shown as fragments per kilobase of transcript per million mapped reads (FPKM; right) from CTL maintained with or without IL-2 over 24 h. Data are from Spinelli et al.. B Quantitative proteomics data of the indicated proteins showing mean protein copy number per cell from CTL maintained with IL-2, with IL-12+IL-18, or no cytokine for 24 h. Data are available from Immpres.co.uk. C Quantitative proteomics data of the indicated proteins showing mean protein copy number per cell (left) and RNASeq data shown as transcripts per million (TPM; right) from CD8 T cells expanded with IL-2 (CTL) or expanded with IL-15 (memory-like). Data are from Marchingo et al.. Data points in bar charts are indicative of biological replicates. Error bars represent the mean +/- SD.
Extended Data Fig. 3
Extended Data Fig. 3. Expression of amino acid transporters in response to pro-inflammatory or memory cytokines.
Related to Fig. 3. A Quantitative proteomics data showing mean protein copy number per cell of the indicated proteins from CD8 T cells expanded with IL-2 (CTL) or expanded with IL-15 (memory-like). Data are from Marchingo et al.. B Quantitative proteomics data showing mean protein copy number per cell of the indicated proteins from CTL maintained with IL-2, with IL-12+IL-18, or no cytokine for 24 h. Data are available from Immpres.co.uk. Data points in bar charts are indicative of biological replicates. Error bars represent the mean +/- SD.
Extended Data Fig. 4
Extended Data Fig. 4. Nutrient regulation of mTORC1 and AMPK activity in CTL.
Related to Fig. 4. A Flow cytometry histograms (left) and MFI (right) of ribosomal protein S6 phosphorylation (pS6) in CTL maintained in amino acid replete media (RPMI) with or without rapamycin (Rap, 20 nM), in amino acid depleted media (HBSS) or in glucose free RPMI (no glucose) for 18 h. B Flow cytometry histograms (left) and MFI (right) of ACC phosphorylation (pACC) in CTL maintained in regular, glucose containing media (RPMI) or in glucose free RPMI (no glucose) for 18hr. Data points in bar charts are indicative of biological replicates.
Extended Data Fig. 5
Extended Data Fig. 5. VPS34 control of autophagy/protein degradation in amino-acid-deprived CTLs.
Related to Fig. 5. A Clustered enrichment analysis on proteins from amino acid replete (RPMI) CTL that were significantly increased with VPS34i treatment. The full enrichment table is available in Source Data Figs. 5, 6 and 7. B Quantitative proteomics data showing mean protein copy numbers per cell of SQSTM1, GABARAPL2 and MAP1LC3B. C Heatmap of ER proteins (GO:0005789) and Golgi proteins (GO:0005794) from CTL in replete amino acids (RPMI), or amino acid deprived (HBSS) with or without VPS34i for 18-hrs. D Heatmap of cytotoxicity related proteins from CTL in replete amino acids (RPMI), or amino acid deprived (HBSS) for 18-hrs. E Heatmap of cytotoxicity related proteins from amino acid deprived (HBSS) CTL +/- VPS34i for 18-hrs. Data points in bar charts are indicative of biological replicates. Error bars represent the mean +/- SD.
Extended Data Fig. 6
Extended Data Fig. 6. Amino-acid starvation induced mitochondrial remodelling and function.
Related to Fig. 6. A Summed protein copy number of Complex I-V proteins of the mitochondrial electron transport chain (annotations: MitoCarta3.0 ‘OXPHOS’). B Basal ECAR of CTL maintained in amino acid replete media (RPMI) or amino acid deprived (HBSS) with or without VPS34i for 18-hrs. C Basal and oligomycin treated OCR measurements of CTL maintained in amino acid replete media (RPMI) or amino acid deprived (HBSS) with or without VPS34i for 18-hrs. Data points in bar charts are indicative of biological replicates. Error bars represent the mean +/- SD.
Extended Data Fig. 7
Extended Data Fig. 7. VPS34-dependent proteome remodelling in response to amino-acid starvation.
Related to Fig. 7. A MRPL20 and MRPL24 expression as a percentage of all large mitochondrial ribosome subunits. B-F Protein copy numbers per cell of ERAL1 (B); proteins involved in mitochondrial transport (C); transferases (D); transcriptional regulation (E) and SLC7A3 (F). Data points in bar charts are indicative of biological replicates. Error bars represent the mean +/- SD.
Extended Data Fig. 8
Extended Data Fig. 8. Regulation of protein expression in CD8 T cells.
Related to Fig. 8. A Mean protein copy numbers of BAX and BAK1 from naïve and OT1 CD8 T cells activated with SIINFEKL for the indicated times. Data available on Immpres.co.uk. B Mean protein copy numbers of REL, RELA, NRF1 and KLF2 from CD8 T cells maintained in IL-7 with or without VPS34i. Data points in bar charts or violin plots are indicative of biological replicates. Error bars represent the mean +/- SD.

References

    1. Pua, H. H., Dzhagalov, I., Chuck, M., Mizushima, N. & He, Y.-W. A critical role for the autophagy gene Atg5 in T cell survival and proliferation. J. Exp. Med.204, 25–31 (2007). - PMC - PubMed
    1. Hubbard, V. M. et al. Macroautophagy regulates energy metabolism during effector T cell activation. J. Immunol.185, 7349–7357 (2010). - PMC - PubMed
    1. Jia, W. & He, Y.-W. Temporal regulation of intracellular organelle homeostasis in T lymphocytes by autophagy. J. Immunol.186, 5313–5322 (2011). - PubMed
    1. Kovacs, J. R. et al. Autophagy promotes T-cell survival through degradation of proteins of the cell death machinery. Cell Death Differ.19, 144–152 (2012). - PMC - PubMed
    1. Willinger, T. & Flavell, R. A. Canonical autophagy dependent on the class III phosphoinositide-3 kinase Vps34 is required for naive T-cell homeostasis. Proc. Natl Acad. Sci. USA109, 8670–8675 (2012). - PMC - PubMed

LinkOut - more resources