. 2025 Jul;21(7):1492-1506.
doi: 10.1080/15548627.2025.2472586. Epub 2025 Mar 16.

Mitochondrial dynamics and quality control regulate proteostasis in neuronal ischemia-reperfusion

Affiliations

Mitochondrial dynamics and quality control regulate proteostasis in neuronal ischemia-reperfusion

Garrett M Fogo et al. Autophagy. 2025 Jul.

Abstract

Mitochondrial damage and dysfunction are hallmarks of neuronal injury during cerebral ischemia-reperfusion (I/R). Critical mitochondrial functions including energy production and cell signaling are perturbed during I/R, often exacerbating damage and contributing to secondary injury. The integrity of the mitochondrial proteome is essential for efficient function. Mitochondrial proteostasis is mediated by the cooperative forces of mitophagy and intramitochondrial proteolysis. The aim of this study was to elucidate the patterns of mitochondrial protein dynamics and their key regulators during an in vitro model of neuronal I/R injury. Utilizing the MitoTimer reporter, we quantified mitochondrial protein oxidation and turnover during I/R injury, highlighting a key point at 2 h reoxygenation for aged/oxidized protein turnover. This turnover was found to be mediated by both LONP1-dependent proteolysis and PRKN/parkin-dependent mitophagy. Additionally, the proteostatic response of neuronal mitochondria is influenced by both mitochondrial fusion and fission machinery. Our findings highlight the involvement of both mitophagy and intramitochondrial proteolysis in the response to I/R injury.Abbreviations: cKO: conditional knockout; CLPP: caseinolytic mitochondrial matrix peptidase proteolytic subunit; DIV: days in vitro; DNM1L/DRP1: dynamin 1 like; ETC: electron transport chain; hR: hours after reoxygenation; I/R: ischemia-reperfusion; LONP1: lon peptidase 1, mitochondrial; mtUPR: mitochondrial unfolded protein response; OGD: oxygen glucose deprivation; OGD/R: oxygen glucose deprivation and reoxygenation; OPA1: OPA1 mitochondrial dynamin like GTPase; PINK1: PTEN induced kinase 1; PRKN: parkin RBR E3 ubiquitin protein ligase; ROI: region of interest; WT: wild-type.

Keywords: Fission; LONP1; PRKN; fusion; mitophagy; neuron.


Conflict of interest statement

No potential conflict of interest was reported by the author(s).

Figures

Figure 1.
Figure 1.
Neuron-specific expression of the fluorescent reporter MitoTimer. (A) MitoTimer protein is synthesized and trafficked to the mitochondrial matrix where it fluoresces green. Upon maturation over time, fluorescence shifts from green to red. The mix of MitoTimer green and red protein in mitochondria creates a spectrum of protein dynamics for visualization. Graphic made in BioRender. (B) infection rates of neurons after 7 days of exposure to varying doses of AAV8-HsSYN-gfp. Infection rates are quantified as the percentage of MAP2-positive neurons expressing GFP. (C) specificity of AAV8-HsSYN-gfp for neuronal transduction. Specificity is quantified as the percentage of GFP-positive cells that also express MAP2. (D) Representative images of neurons expressing GFP after infection with AAV8-HsSYN-gfp. (E) Representative images of neurons expressing MitoTimer. Scale bar: 50 μm. n = 3–4 biological replicates (2 experiments).
Figure 2.
Figure 2.
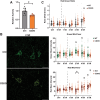
MitoTimer fluorescence dynamics following OGD/R. (A) Schematic overview of experimental timeline. Graphic made in BioRender. (B) Representative images of neuronal MitoTimer across timepoints throughout OGD/R. Scale bar: 20 μm. (C) Quantification of MitoTimer Red:Green ratio and fluorescent mean intensities in OGD/R. Measurements were restricted to segmented mitochondrial area in each image. Large symbols display biological replicates, small symbols represent individual images. Statistical tests were performed using biological replicates. n = 6–7 biological replicates (3 experiments). * indicates p < .05 in pair-wise comparison. $ indicates p < .05 compared to control.
Figure 3.
Figure 3.
Mitochondrial protease levels are not changed in OGD/R. (A) Representative western blots of mitochondrial proteases from neuronal whole cell lysates. (B) Quantification of mitochondrial matrix and inner membrane proteases in OGD/R corrected for mitochondrial content (TOMM20 expression) and normalized to normoxic control. n = 3–6 biological replicates (2–3 experiments). (C) Protease activity of mitochondrial lysates throughout OGD/R, normalized to control. n = 4–14 biological replicates (2–7 experiments).
Figure 4.
Figure 4.
LONP1 contributes to protein turnover during reoxygenation. (A) Protease activity of mitochondrial lysates with(out) CDDO-Me (0.5 μM) measured by FITC-casein proteolysis assay fit to trypsin standard curve and normalized to control. n = 7–10 biological replicates (3 experiments). (B) Representative images of MitoTimer signal at 2 hR for WT cells with(out) CDDO-Me treatment. Scale bar: 20 μm. (C) Quantification of MitoTimer red:green ratio, green intensity, and red intensity throughout OGD/R. Dotted line indicates administration of CDDO-Me at onset of reoxygenation. n = 5–7 biological replicates (3 experiments). * indicates p < .05 in pair-wise comparison. $ indicates p < .05 compared to respective control. Note that comparison WT data are identical to that presented in Figure 2.
Figure 5.
Figure 5.
PRKN regulates protein turnover during basal and stress conditions. (A) Representative images of MitoTimer signal from WT and prkn−/− cells at control conditions and 2 hR. Scale bar: 20 μm. (B) Quantification of MitoTimer red:green ratio, green intensity, and red intensity throughout OGD/R. n = 5–7 biological replicates (3 experiments). * indicates p < .05 in pair-wise comparison. $ indicates p < .05 compared to respective control. Note that comparison WT data are identical to that presented in Figure 2.
Figure 6.
Figure 6.
DNM1L and OPA1 differentially affect mitochondrial protein turnover. (A) Representative western blot of dnm1l cKO after cre expression. Control cells were transduced with a GFP vector. (B) Representative images of dnm1l cKO MitoTimer cells at baseline conditions and after OGD and 2 h reoxygenation. Scale bar: 20 μm. (C) Quantification of MitoTimer red:green ratio during OGD/R in WT and dnm1l cKO neurons. n = 3–8 biological replicates (2 experiments). (D) Representative western blot of Opa1 cKO after cre expression. Viral concentrations after listed in vg/mL. (E) Representative images of opa1 cKO MitoTimer cells at baseline conditions and after OGD and 2 h reoxygenation. Scale bar: 20 μm. (F) Quantification of MitoTimer red:green ratio during OGD/R in WT and opa1 cKO neurons. n = 3–7 biological replicates (3 experiments). * indicates p < .05 in pair-wise comparison. $ indicates p < .05 compared to respective control. Note that comparison WT data are identical to that presented in Figure 2.

References

    1. Anzell AR, Maizy R, Przyklenk K, et al. Mitochondrial quality control and disease: insights into ischemia-reperfusion injury. Mol Neurobiol. 2018. Mar;55(3):2547–2564. doi: 10.1007/s12035-017-0503-9. PMID: 28401475. - DOI - PMC - PubMed
    1. Willems PH, Rossignol R, Dieteren CE, et al. Redox homeostasis and mitochondrial dynamics. Cell Metab. 2015. Aug 4;22(2):207–218. doi: 10.1016/j.cmet.2015.06.006 - DOI - PubMed
    1. Sanderson TH, Reynolds CA, Kumar R, et al. Molecular mechanisms of ischemia–reperfusion injury in brain: pivotal role of the mitochondrial membrane potential in reactive oxygen species generation. Mol Neurobiol. 2013. Feb;47(1):9–23. doi: 10.1007/s12035-012-8344-z. PMID: 23011809. - DOI - PMC - PubMed
    1. Nunnari J, Suomalainen A.. Mitochondria: in sickness and in health. Cell. 2012. Mar 16;148(6):1145–1159. doi: 10.1016/j.cell.2012.02.035. PMID: 22424226. - DOI - PMC - PubMed
    1. Bomba-Warczak E, Edassery SL, Hark TJ, et al. Long-lived mitochondrial cristae proteins in mouse heart and brain. J Cell Biol. 2021. Sep 6;220(9):e202005193. doi: 10.1083/jcb.202005193. PMID: 34259807. - DOI - PMC - PubMed

Publication types