. 2025 Feb 27;23(1):124.
doi: 10.1186/s12916-025-03945-y.

MTHFD2 promotes osteoclastogenesis and bone loss in rheumatoid arthritis by enhancing CKMT1-mediated oxidative phosphorylation

Affiliations

MTHFD2 promotes osteoclastogenesis and bone loss in rheumatoid arthritis by enhancing CKMT1-mediated oxidative phosphorylation

Yujing Li et al. BMC Med. .

Abstract

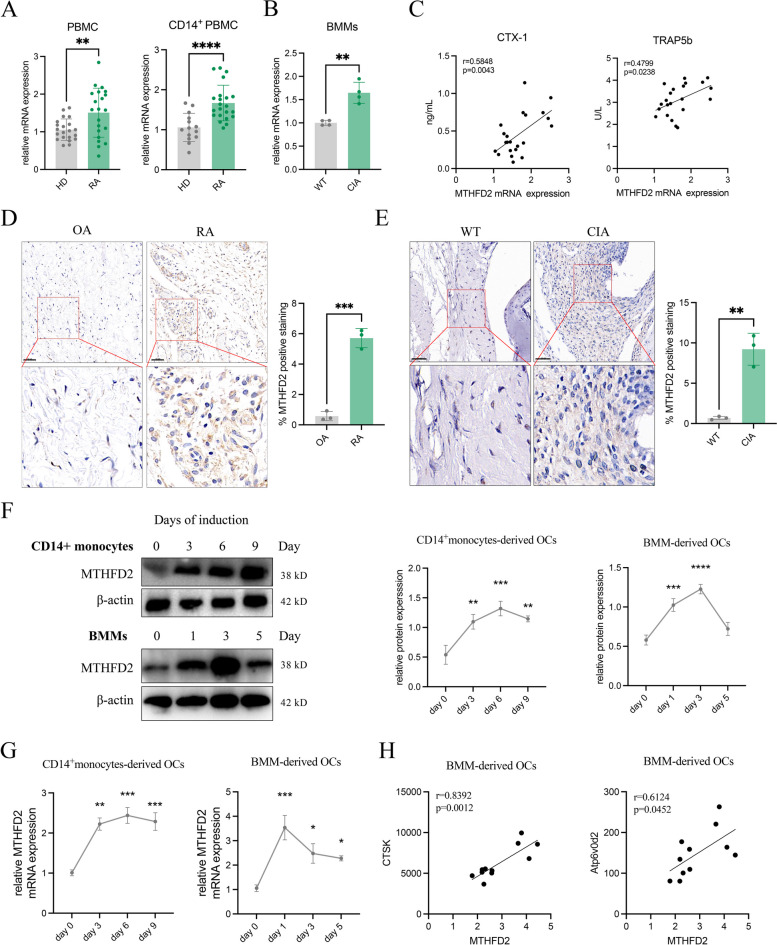
Background: Rheumatoid arthritis (RA) is a chronic autoimmune disease characterized by disrupted bone homeostasis. This study investigated the effect and underlying mechanisms of one-carbon metabolism enzyme methylenetetrahydrofolate dehydrogenase 2 (MTHFD2) on osteoclast differentiation and bone loss in RA.

Methods: The expression of MTHFD2 was examined in CD14 + monocytes and murine bone marrow-derived macrophages (BMMs). RNA-sequencing was performed to evaluate the regulatory mechanisms of MTHFD2 on osteoclastogenesis. Extracellular flux assay, JC-1 staining, and transmission electron microscopy were used to detect mitochondrial function and energy metabolism changes during osteoclast formation. Collagen-induced arthritis (CIA) mice were used to evaluate the therapeutic effect of MTHFD2 knockdown on bone loss. Bone volume and osteoclast counts were quantified by μCT and histomorphometry.

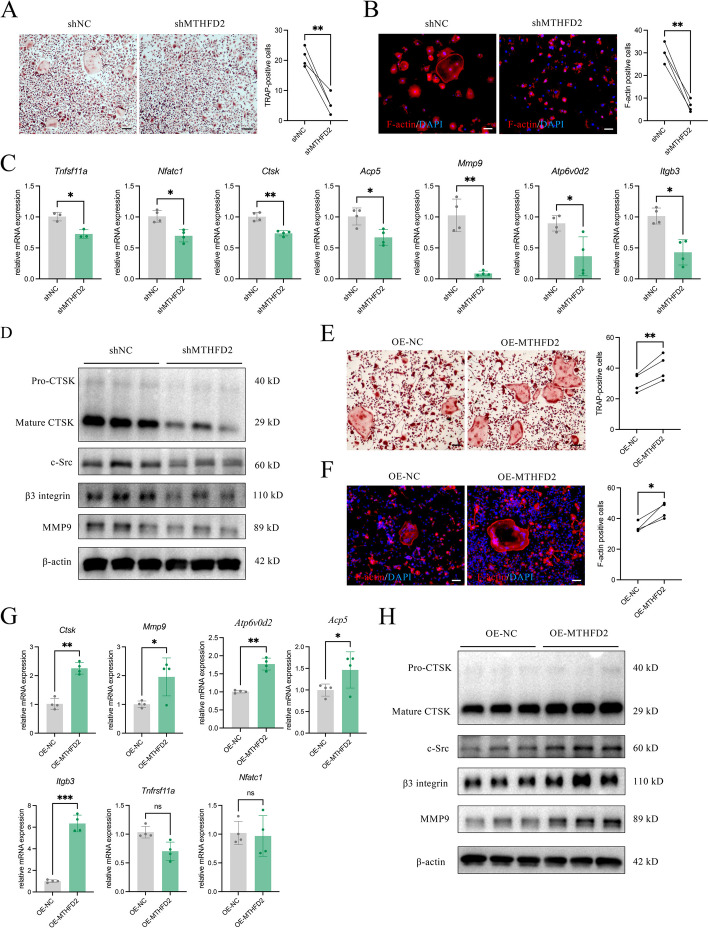
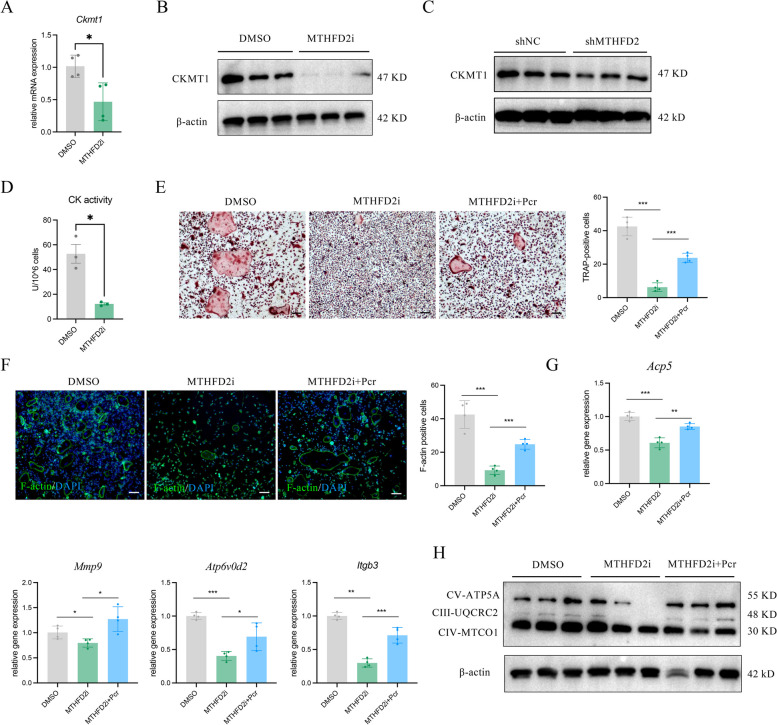
Results: Elevated MTHFD2 was observed in RA patients and CIA mice with a positive correlation to bone resorption parameters. During osteoclast formation, MTHFD2 was significantly upregulated in both human CD14 + monocytes and murine BMMs. The application of MTHFD2 inhibitor and MTHFD2 knockdown suppressed osteoclastogenesis, while MTHFD2 overexpression promoted osteoclast differentiation in vitro. RNA-sequencing revealed that MTHFD2 inhibition blocked oxidative phosphorylation (OXPHOS) in osteoclasts, leading to decreased adenosine triphosphate (ATP) production and mitochondrial membrane potential without affecting mitochondrial biogenesis. Mechanistically, inhibition of MTHFD2 downregulated the expression of mitochondrial creatine kinase 1 (CKMT1), which in turn affected phosphocreatine energy shuttle and OXPHOS during osteoclastogenesis. Further, a therapeutic strategy to knock down MTHFD2 in knee joint in vivo ameliorated bone loss in CIA mice.

Conclusions: Our findings demonstrate that MTHFD2 is upregulated in RA with relation to joint destruction. MTHFD2 promotes osteoclast differentiation and arthritic bone erosion by enhancing mitochondrial energy metabolism through CKMT1. Thus, targeting MTHFD2 may provide a potential new therapeutic strategy for tackling osteoclastogenesis and bone loss in RA.

Keywords: Methylenetetrahydrofolate dehydrogenase 2; Osteoclast differentiation; Oxidative phosphorylation; Rheumatoid arthritis.


Conflict of interest statement

Declarations. Ethics approval and consent to participate: All experiments were approved by the Medical Ethics Committee of the First Affiliated Hospital of University of Science and Technology of China (2023KY-438). Experiments were conducted in accordance with relevant institutional guidelines and regulations. Consent for publication: Not applicable. Competing interests: The authors declare no competing interests.

Figures

Fig. 1
Fig. 1
Expression of MTHFD2 in human and murine OCPs and MTHFD2 level during osteoclastogenesis. A Expression of MTHFD2 in peripheral blood mononuclear cell (PBMC) (n = 21) and CD14 + monocytes (n = 14–22) from HDs and RA patients measured by RT-qPCR. B BMMs MTHFD2 level of CIA mice compared to that of WT mice (n = 3). C Correlation between MTHFD2 level of CD14 + monocytes in RA patients with serum CTX-1 and TRAP5b (n = 22). D MTHFD2 expression in synovium of OA and RA patients detected by IHC and semi-quantitatively analyzed by ImageJ (n = 3). Scale bars = 50 μm. E MTHFD2 expression in synovium of WT and CIA mice detected by IHC and semi-quantitatively analyzed by ImageJ (n = 3). Scale bars = 50 μm. F, G Protein level (F) and mRNA level (G) of MTHFD2 during osteoclast formation in human- and mice-derived OCPs (n = 3). H Murine MTHFD2 mRNA level at day 5 after RANKL stimulation was assessed for correlation to Ctsk and Atp6v0d2 mRNA level (n = 11). Symbols represent individual subjects in independent analysis. Data are shown as mean ± SD. ** = P < 0.01; *** = P < 0.001, **** = P < 0.0001, by Student’s t-test (A, B, D, E) and one-way ANOVA (F, G)
Fig. 2
Fig. 2
Suppression of osteoclastogenesis through MTHFD2 inhibition. A, B Representative images of TRAP (A) and F-actin staining (B) of CD14 + monocyte-derived osteoclasts treated with DMSO or MTHFD2i (n = 4). Scale bars = 100 μm. C Expression of Tnfrsf11a, Nfatc1, Ctsk, Acp5, Mmp9, Atp6v0d2, and Itgb3 following 7.5 μM MTHFD2i treatment in CD14 + OCPs (n = 4). D, E Representative images of TRAP (D) and F-actin staining (E) of BMM-derived osteoclasts treated with DMSO or MTHFD2i (n = 4). Scale bars = 100 μm. F, G Protein level (n = 3) (F) and mRNA level (n = 4) (G) of osteoclast-associated markers following 10 μM MTHFD2i treatment in murine OCPs. H Bone resorption pits of BMMs-derived osteoclasts were detected by scanning electron microscopy. Scale bars = 1 mm. Data are shown as mean ± SD. * = P < 0.05; ** = P < 0.01; *** = P < 0.001, by Student’s t test
Fig. 3
Fig. 3
MTHFD2 level regulates the differentiation of osteoclasts. A Representative images of TRAP staining of BMMs from WT mice transfected with short hairpin RNA for MTHFD2 knockdown (sh-MTHFD2) compared to NC group (n = 4). Scale bars = 100 μm. B Representative images of F-actin staining of sh-MTHFD2 BMMs compared to NC group (n = 4). Scale bars = 50 μm. C, D Expression of osteoclast markers in murine osteoclasts with MTHFD2 knockdown and RANKL stimulation (n = 3–4). E Representative images of TRAP staining of BMMs transfected with lentivirus containing murine full-length MTHFD2 cDNA vector (OE-MTHFD2) (n = 4). Scale bars = 100 μm. F Representative images of F-actin staining of OE-MTHFD2 BMMs (n = 4). Scale bars = 50 μm. G, H Expression of osteoclast markers in murine osteoclasts with MTHFD2 overexpression and RANKL stimulation (n = 3–4). Data are shown as mean ± SD. * = P < 0.05; ** = P < 0.01; *** = P < 0.001, by Student’s t test
Fig. 4
Fig. 4
MTHFD2 controls OXPHOS and ATP production in RANKL-stimulated BMMs. A Volcano plot showing differentially expressed genes and decreased Ckmt1 mRNA in MTHFD2i-treated OCPs versus DMSO-treated OCPs (n = 4). B Downregulated KEGG pathway enrichment results from RNA sequencing data in murine OCPs supplemented or not with 10 μM MTHFD2i for 48 h (n = 4). C GSEA results indicating significant difference in OXPHOS comparing MTHFD2i versus DMSO group (n = 4). Pathways with an adjusted p-value less than 0.05 are considered significantly enriched. D Representative ETC markers in OCPs were detected by Western blot (n = 3). E, F OCR (E) and mitochondrial function parameters (F) were analyzed by extracellular flux assay in OCPs stimulated with RANKL for 72 h (n = 3). G ATP levels of OCPs treated with DMSO or MTHFD2i (n = 4). H Representative images of Mitotracker Green staining in OCPs at day 3 (n = 3). Scale bars = 10 μm. I Representative images of JC-1 staining in OCPs at day 3 (n = 3). Scale bars = 20 μm. J Phosphorylation of AMPK and mTOR after MTHFD2i treatment at indicated time (n = 3). Data are shown as mean ± SD. ns = not significant, * = P < 0.05; ** = P < 0.01; *** = P < 0.001, by Student’s t test
Fig. 5
Fig. 5
MTHFD2 regulates osteoclastic creatine kinases expression. A, B Relative mRNA (A) and protein (B) expression of CKMT1 following MTHFD2i treatment for 72 h (= 3). C Relative protein expression of CKMT1 in MTHFD2-knockdown OCPs (= 3). D Cellular creatine kinase activity of MTHFD2i-treated OCPs compared to control group (= 4). E, F Representative images of TRAP staining (E) and F-actin staining (F) of OCPs stimulated with DMSO, MTHFD2i, or MTHFD2i+Pcr (= 4). Scale bars = 100 μm. G Expression of osteoclast markers in murine osteoclasts with MTHFD2i, Pcr and RANKL stimulation (= 4). H Representative ETC markers in MTHFD2i-treated OCPs following Pcr rescue were detected by Western blot (n=3). Data are shown as mean ± SD. * = P < 0.05; ** = P < 0.01; *** = P < 0.001, by Student’s t test
Fig. 6
Fig. 6
MTHFD2 knockdown suppresses pathological bone resorption in vivo. A Schematic of CIA induction and intraarticular aav injection. B Arthritis scores were evaluated every three days (= 6). C, D Representative tibial μCT images (C) and quantification of BV/TV, Tb.N, Tb.Th, and Tb.Sp (D) in WT-naïve, aav-NC CIA, and aav-MTHFD2 CIA groups (= 5–6). E, F Representative images of TRAP staining (E) and quantification of Oc.N/BS and Oc.S/B.Pm of the tibia (F) (= 5–6). Scale bars=50 μm. G Representative toluidine blue staining images of the tibia and quantification of Ob.S/BS (= 6). Scale bars = 50 μm. H Representative OCN IHC sections of the tibia and quantitative analysis (= 6). Scale bars = 50 μm. Data are shown as mean ± SD. * = P < 0.05; ** = P < 0.01; *** = P < 0.001, by Student’s t test

References

    1. Smith MH, Berman JR. What Is Rheumatoid Arthritis? JAMA. 2022;12:1194. - PubMed
    1. Schett G, Gravallese E. Bone erosion in rheumatoid arthritis: mechanisms, diagnosis and treatment. Nat Rev Rheumatol. 2012;11:656–64. - PMC - PubMed
    1. Gough AK, et al. Generalised bone loss in patients with early rheumatoid arthritis. Lancet. 1994;8914:23–7. - PubMed
    1. Welsing PM, et al. The relationship between disease activity, joint destruction, and functional capacity over the course of rheumatoid arthritis. Arthritis Rheum. 2001;9:2009–17. - PubMed
    1. Svensson B, et al. Erosion-free rheumatoid arthritis: clinical and conceptional implications-a BARFOT study. BMC Rheumatol. 2022;1:88. - PMC - PubMed

MeSH terms

Substances

LinkOut - more resources