. 2025 Feb 27;16(1):14.
doi: 10.1186/s13229-025-00650-8.

Autistic behavior is a common outcome of biallelic disruption of PDZD8 in humans and mice

Affiliations

Autistic behavior is a common outcome of biallelic disruption of PDZD8 in humans and mice

Andreea D Pantiru et al. Mol Autism. .

Abstract

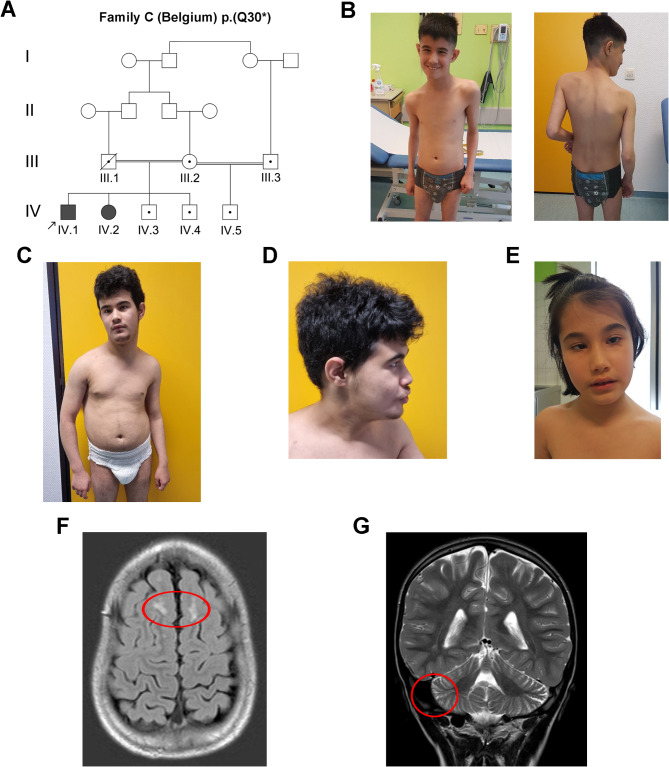
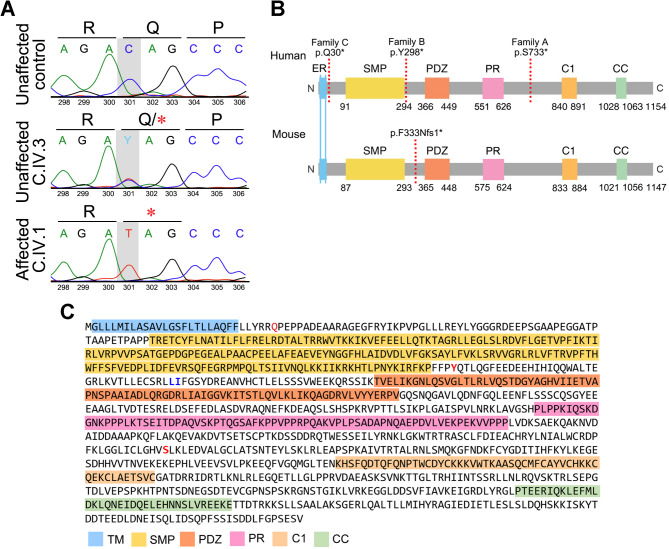
Background: Intellectual developmental disorder with autism and dysmorphic facies (IDDADF) is a rare syndromic intellectual disability (ID) caused by homozygous disruption of PDZD8 (PDZ domain-containing protein 8), an integral endoplasmic reticulum (ER) protein. All four previously identified IDDADF cases exhibit autistic behavior, with autism spectrum disorder (ASD) diagnosed in three cases. To determine whether autistic behavior is a common outcome of PDZD8 disruption, we studied a third family with biallelic mutation of PDZD8 (family C) and further characterized PDZD8-deficient (Pdzd8tm1b) mice that exhibit stereotyped motor behavior relevant to ASD.

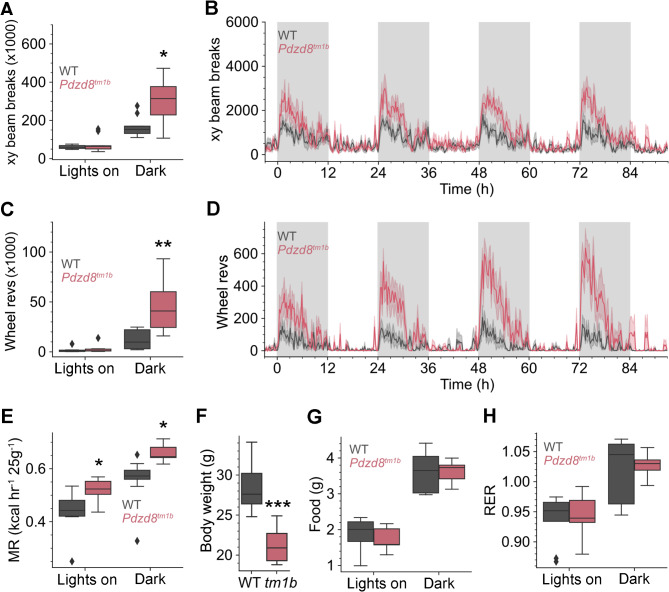
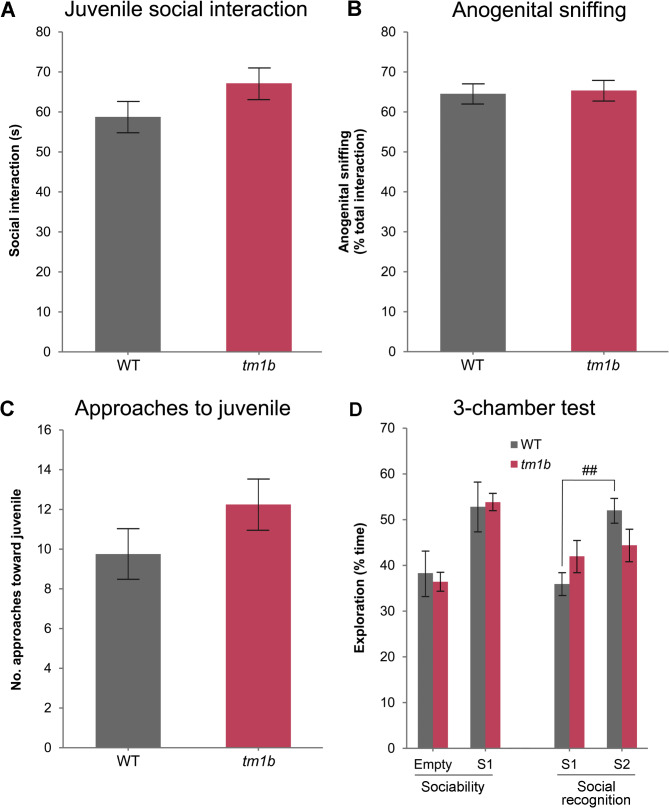
Methods: Homozygosity mapping, whole-exome sequencing, and cosegregation analysis were used to identify the PDZD8 variant responsible for IDDADF, including diagnoses of ASD, in consanguineous family C. To assess the in vivo effect of PDZD8 disruption on social responses and related phenotypes, behavioral, structural magnetic resonance imaging, and microscopy analyses were conducted on the Pdzd8tm1b mouse line. Metabolic activity was profiled using sealed metabolic cages.

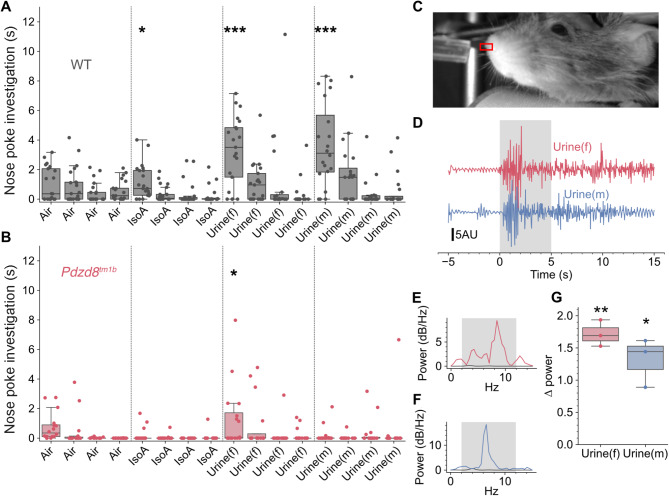
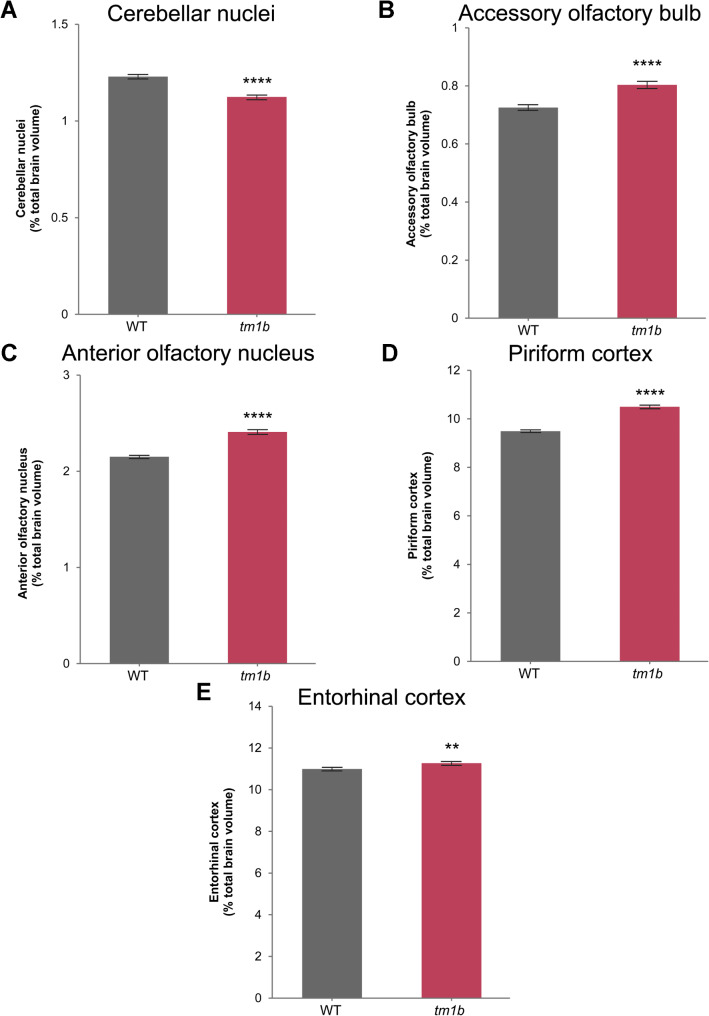
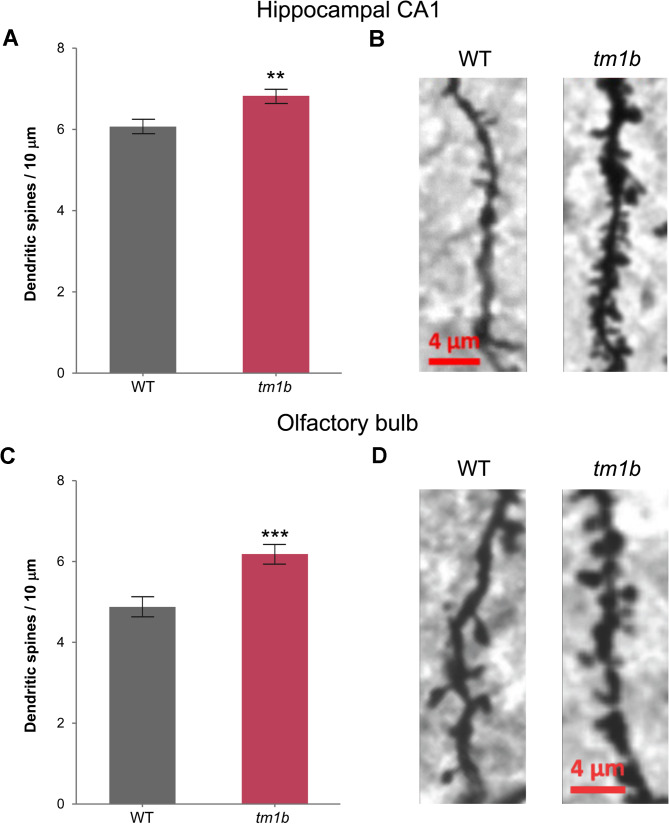
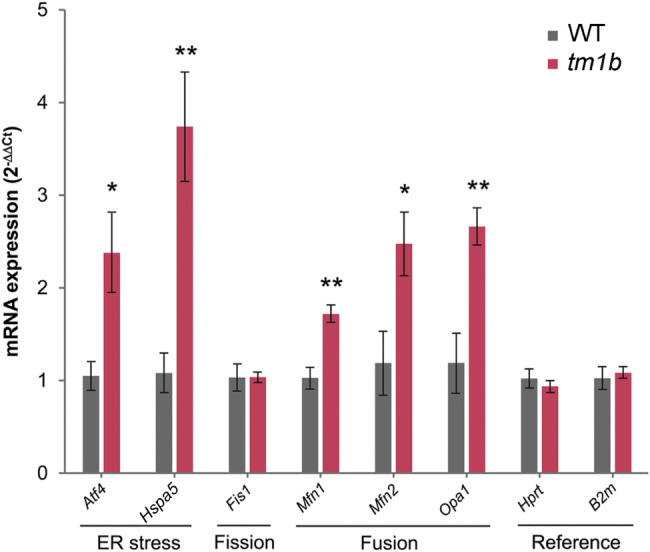
Results: The discovery of a third family with IDDADF caused by biallelic disruption of PDZD8 permitted identification of a core clinical phenotype consisting of developmental delay, ID, autism, and facial dysmorphism. In addition to impairments in social recognition and social odor discrimination, Pdzd8tm1b mice exhibit increases in locomotor activity (dark phase only) and metabolic rate (both lights-on and dark phases), and decreased plasma triglyceride in males. In the brain, Pdzd8tm1b mice exhibit increased levels of accessory olfactory bulb volume, primary olfactory cortex volume, dendritic spine density, and ER stress- and mitochondrial fusion-related transcripts, as well as decreased levels of cerebellar nuclei volume and adult neurogenesis.

Limitations: The total number of known cases of PDZD8-related IDDADF remains low. Some mouse experiments in the study did not use balanced numbers of males and females. The assessment of ER stress and mitochondrial fusion markers did not extend beyond mRNA levels.

Conclusions: Our finding that the Pdzd8tm1b mouse model and all six known cases of IDDADF exhibit autistic behavior, with ASD diagnosed in five cases, identifies this trait as a common outcome of biallelic disruption of PDZD8 in humans and mice. Other abnormalities exhibited by Pdzd8tm1b mice suggest that the range of comorbidities associated with PDZD8 deficiency may be wider than presently recognized.

Keywords: Autism spectrum disorder; Intellectual disability; Olfactory behavior; PDZD8; Social discrimination.


Conflict of interest statement

Declarations. Ethics approval and consent to participate: The human study was approved by Ghent University Ethical Committee. The affected individuals were recruited to the study with the informed consent of their mother using a process that adhered to the tenets of the Declaration of Helsinki. The mouse experiments were conducted in compliance with the UK Animals (Scientific Procedures) Act 1986 under UK Home Office licences and approved by the Animal Welfare and Ethical Review Body at the University of Leeds. Consent for publication: Written consent for publication of case reports and images pertaining to the affected individuals was obtained from their mother. Competing interests: The authors declare no competing interests.

Figures

Fig. 1
Fig. 1
Clinical features of syndromic ID in family C. A Pedigree of four-generation family C showing cosegregation of PDZD8 p.(Q30*) homozygosity with syndromic ID in 2 affected siblings. The obligate carrier status of the deceased father (C.III.1) of the affected siblings was not confirmed by genetic testing. Arrow, index case (C.IV.1); filled symbol, affected (symptomatic); open symbol, unaffected (asymptomatic); black dot, heterozygous carrier; diagonal line, deceased. B Scoliosis in index case (C.IV.1) aged 13 years. C Scoliosis in C.IV.1 aged 18 years. D Facial dysmorphism in C.IV.1 aged 18 years. E Facial dysmorphism including malar flattening in C.IV.2 aged 13 years. F Brain MRI scan showing demyelinating lesions in C.IV.1. G Brain MRI scan showing mild cerebellar hemispheric atrophy in C.IV.1
Fig. 2
Fig. 2
Overview of molecular findings in PDZD8-related IDDADF. A Sanger sequence chromatograms showing the PDZD8 nonsense mutation (c.88 C > T) identified in family C. B Schematic diagram depicting domain structure of PDZD8 in human (UniProtKB: Q8NEN9; top) and mouse (UniProtKB: B9EJ80; bottom). Broken vertical red lines indicate the location of PTC in family A (p.S733*), family B (p.Y298*) and family C (p.Q30*), and in Pdzd8tm1b mice (p.F333Nfs1*). Numbering is from reference [2]. C Location of the p.(Q30*), p.(Y298*) and p.(S733*) variants (red text) within protein sequence and domain organization of human PDZD8 (Q8NEN9). Blue text indicates the residues (L334 & I335) corresponding to F333 and I334 affected by p.(F333Nfs1*) in mouse PDZD8. C, carboxyl-terminus; C1, phorbol-ester/diacylglycerol-binding; CC, coiled-coil; ER, endoplasmic reticulum transmembrane; N, amino-terminus; PR, proline-rich; PDZ, PSD-95/DlgA/ZO-1-like; SMP, synaptotagmin-like mitochondrial lipid-binding
Fig. 3
Fig. 3
Enhanced locomotor activity and metabolic rate in Pdzd8tm1b mice. A Locomotor activity on the cage floor (xy beam breaks) was significantly different between Pdzd8tm1b mice (n = 9♂) and WT controls (n = 9♂) (two-way ANOVA: F = 8.292, p = 0.00705). Post-hoc pairwise corrected t-tests showed a significant difference only during the dark phase (t = 2.654, p = 0.035). B Locomotor activity on the cage floor (xy beam breaks) throughout the 12-hour light/dark cycle over 96 h. C Locomotor activity (in-cage running wheel revolutions) was significantly different between Pdzd8tm1b mice and WT controls (two-way ANOVA: genotype: F = 12.441, p = 0.001294). Post-hoc pairwise corrected t-tests showed a significant difference only during the dark phase (t = 3.451, p = 0.0066). D Locomotor activity (in-cage running wheel revolutions) throughout the 12-hour light/dark cycle over 96 h. E Metabolic rate measured as mean hourly heat production was elevated in Pdzd8tm1b mice (two-way ANCOVA: genotype: F = 4.783, p = 0.036). For an equivalent 25 g mouse, the metabolic rate was significantly elevated during both the lights-on phase (post-hoc pairwise corrected t-test: t = 2.461, p = 0.026) and dark phase (post-hoc pairwise corrected t-test: t = 3.073, p = 0.0073). F Reduced body weight (g) of male Pdzd8tm1b mice versus WT controls at 11 weeks of age (unpaired t-test: t = 5.8603, p = 0.000026). G Unaltered food intake (g) in Pdzd8tm1b mice versus WT controls. H Unaltered respiratory exchange ratio in Pdzd8tm1b mice versus WT controls (two-way ANOVA: genotype: F = 0.269, p = 0.607). g, grams; MR, metabolic rate; RER, respiratory exchange ratio; revs, revolutions; tm1b, Pdzd8tm1b homozygous; WT, wild-type. *p < 0.05, **p < 0.01, ***p < 0.001 versus WT
Fig. 4
Fig. 4
Decreased plasma triglyceride levels in male Pdzd8tm1b mice. Plasma triglyceride levels (mg/dL) in Pdzd8tm1b mice (n = 14; 7♂, 7♀) and C57BL/6NTac background strain controls (n = 280; 132♂, 148♀) (two-way ANOVA, genotype: F(1, 290) = 4.58, p = 0.033; sex: F(1, 290) = 5.50, p = 0.020; genotype × sex interaction: F(1, 290) = 2.65, p = 0.104). *p < 0.05 versus B6N ♂
Fig. 5
Fig. 5
Impaired social recognition in Pdzd8tm1b mice. A–C Juvenile social interaction in Pdzd8tm1b mice (n = 8♀) and WT controls (n = 8♀). A Duration of social interaction (s). B Duration of anogenital sniffing (% of total interaction time). C Number of approaches toward juvenile mouse. D Social approach testing in Pdzd8tm1b mice (n = 12♀) and WT controls (n = 10♀). Sociability: time (% total) spent exploring an empty container versus a novel mouse (two-way ANOVA, genotype: F(1, 40) = 0.01, p = 0.903; chamber: F(1, 40) = 19.16, p = 0.0001; genotype × chamber interaction: F(1, 40) = 0.16, p = 0.693). Social recognition: time (% total) spent exploring stranger 1 (previously explored mouse) versus a second novel mouse (two-way ANOVA, genotype: F(1, 40) = 0.06, p = 0.809; chamber: F(1, 40) = 8.50, p = 0.006; genotype × chamber interaction: F(1, 40) = 4.65, p = 0.037). Empty, empty cylinder; S1, stranger 1; S2, stranger 2; tm1b, Pdzd8tm1b homozygous; WT, wild-type. ##p < 0.01 versus stranger 1 within WT group
Fig. 6
Fig. 6
Social odour discrimination is altered in Pdzd8tm1b mice. A Cross-habituation assay for WT controls (n = 21; 13♂, 8♀) showing increased nose poke investigation times (s) when a new odor was presented after habituation (Friedman: F = 3.389, p = 0.000007). B Cross-habituation assay for Pdzd8tm1b mice (n = 16; 8♂, 8♀) showing investigation times lower than in WT controls but still significant (Friedman: F = 2.259, p = 0.0059). Asterisks indicate corrected post-hoc Wilcoxon tests. C A head-fixed Pdzd8tm1b mouse, the rectangle over the nose showing the region used for analysis. D Nasal movements measured from the rectangle in B for female and male urine, with stimuli delivered during shaded area. E, F Fourier transforms of the data in D, the gray traces showing the power for the pre-stimulus and the colored traces showing the power over the stimulus period. Shaded area shows frequency range of respiration. GPdzd8tm1b mice (n = 3; 2♂, 1♀) increased nasal movements in response to both female (corrected paired t-test: t = 14.507, p = 0.0094) and male urine (corrected paired t-test: t = 6.019, p = 0.027). dB, decibels; Hz, Hertz; IsoA, isoamyl acetate; Urine(f), urine from female mice; Urine(m), urine from male mice; WT, wild-type. *p < 0.05, **p < 0.01, ***p < 0.001
Fig. 7
Fig. 7
Relative (% total brain volume) volumetric differences in the cerebellar nuclei, accessory olfactory bulb, and components of the primary olfactory cortex in Pdzd8tm1b mice (n = 32; 10♂, 22♀) and WT controls (n = 17; 7♂, 10♀) determined by high-resolution structural magnetic resonance imaging. A Cerebellar nuclei relative volume is decreased in Pdzd8tm1b mice by 8.56 ± 0.79% (unpaired t-test: t = 7.83, p < 0.0001). B Accessory olfactory bulb relative volume is increased in Pdzd8tm1b mice by 10.79 ± 1.38% (unpaired t-test: t = 6.18, p < 0.0001). C Anterior olfactory nucleus relative volume is increased in Pdzd8tm1b mice by 11.99 ± 0.92% (unpaired t-test: t = 11.03, p < 0.0001). D Piriform cortex relative volume is increased in Pdzd8tm1b mice by 10.58 ± 0.72% (unpaired t-test: t = 12.87, p < 0.0001). E Entorhinal cortex relative volume is increased in Pdzd8tm1b mice by 2.57 ± 0.66% (unpaired t-test: t = 2.94, p = 0.005). tm1b, Pdzd8tm1b homozygous; WT, wild-type. **p < 0.01, ****p < 0.0001 versus WT
Fig. 8
Fig. 8
Decreased adult neurogenesis in Pdzd8tm1b mice. A Number of EdU-positive cells relative to surface area (10 mm2) in sequential coronal sections of the hippocampus from Pdzd8tm1b mice (n = 55 sections from n = 5♀ mice) and WT controls (n = 70 sections from n = 5♀ mice) (Mann–Whitney: U = 1,286, p < 0.0014). B Representative images of EdU staining in the hippocampus of WT control (top) and Pdzd8tm1b mouse (bottom) with EdU-positive cells indicated by white arrows. The striations are artifacts caused by uneven illumination by the AxioScan Slide Scanner of the component image tiles that were assembled into the whole-section images. Scale bar: 200 μm. C Number of EdU-positive cells relative to surface area (mm2) in sequential coronal sections of the granule cell layer of the OB from Pdzd8tm1b mice (n = 54 sections from n = 5♀ mice) and WT controls (n = 73 sections from n = 5♀ mice) (Mann–Whitney: U = 1,307, p = 0.0011). D Number of EdU-positive cells relative to surface area (mm2) in sequential coronal sections of the extra granule cell layer of the OB from Pdzd8tm1b mice (n = 54 sections from n = 5♀ mice) and WT controls (n = 73 sections from n = 5♀ mice) (Mann–Whitney: U = 897, p < 0.0001). E Representative images of EdU staining in the OB of WT control (left) and Pdzd8tm1b mouse (right) with white box showing EdU-positive cells in a zoomed-in area. Scale bar: 400 μm. +, positive; OB, olfactory bulb; tm1b, Pdzd8tm1b homozygous; WT, wild-type
Fig. 9
Fig. 9
Greater density of dendritic spines in the hippocampal CA1 and the granule cell layer of the OB in Pdzd8tm1b mice. A Density of dendritic spines in the hippocampal CA1 of Pdzd8tm1b mice (n = 69 dendrites from n = 4♂ mice) and WT controls (n = 87 dendrites from n = 4♂ mice) (two-sample t-test: t(154) = 3.221, p = 0.0016). B Representative images of dendritic segment of Golgi–Cox-stained neurons in hippocampal CA1 of Pdzd8tm1b mouse (right) and WT control (left). Scale bar: 4 μm. C The density of dendritic spines in the granule cell layer of the OB was higher (two-sample t-test with Welch’s correction: t(79.4) = 4.145, p = 0.000084) and less variable (Levene’s test, p = 0.017) in Pdzd8tm1b mice (n = 27 dendrites from n = 4♂ mice) compared with WT controls (n = 57 dendrites from n = 4♂ mice). D Representative images of dendritic segment of Golgi–Cox-stained neurons in the granule cell layer of the OB of WT control (left) and Pdzd8tm1b mouse (right). Scale bar: 4 μm. tm1b, Pdzd8tm1b homozygous; WT, wild-type. **p < 0.01, ***p < 0.001 versus WT
Fig. 10
Fig. 10
Altered mRNA expression in Pdzd8tm1b mouse brain. Transcript levels of Atf4 and Hspa5 genes encoding ER stress markers, Fis1 gene encoding a mitochondrial fission protein, Mfn1, Mfn2 and Opa1 genes encoding mitochondrial fusion markers, and the Hprt and B2m reference genes. Gene mRNA expression is presented as fold change ± SEM, calculated via the 2-ΔΔCt method [30], relative to Hprt mRNA. Student’s t-test detected significant differences in male Pdzd8tm1b homozygous mice versus WT controls (n = 5♂/genotype). Normalizing to the B2m reference gene gave similar results. tm1b, Pdzd8tm1b homozygous; WT, wild-type. *p < 0.05, **p < 0.01 versus WT

References

    1. American Psychiatric Association. Diagnostic and Statistical Manual of Mental Disorders, 5th edition. Washington, DC: American Psychiatric Association; 2013.
    1. Al-Amri AH, Armstrong P, Amici M, Ligneul C, Rouse J, El-Asrag ME, et al. PDZD8 disruption causes cognitive impairment in humans, mice, and Fruit flies. Biol Psychiatry. 2022;92(4):323–34. - PMC - PubMed
    1. Guillén-Samander A, Bian X, De Camilli P. PDZD8 mediates a Rab7-dependent interaction of the ER with late endosomes and lysosomes. Proc Natl Acad Sci USA. 2019;116(45):22619–23. - PMC - PubMed
    1. Elbaz-Alon Y, Guo Y, Segev N, Harel M, Quinnell DE, Geiger T, et al. PDZD8 interacts with Protrudin and Rab7 at ER-late endosome membrane contact sites associated with mitochondria. Nat Commun. 2020;11(1):3645. - PMC - PubMed
    1. Shirane M, Wada M, Morita K, Hayashi N, Kunimatsu R, Matsumoto Y, Matsuzaki F, Nakatsumi H, Ohta K, Tamura Y, Nakayama KI. Protrudin and PDZD8 contribute to neuronal integrity by promoting lipid extraction required for endosome maturation. Nat Commun. 2020;11(1):4576. - PMC - PubMed