. 2025 May;116(5):1214-1226.
doi: 10.1111/cas.70029. Epub 2025 Feb 27.

High Antigenicity for Treg Cells Confers Resistance to PD-1 Blockade Therapy via High PD-1 Expression in Treg Cells

Affiliations

High Antigenicity for Treg Cells Confers Resistance to PD-1 Blockade Therapy via High PD-1 Expression in Treg Cells

Hiroaki Matsuura et al. Cancer Sci. 2025 May.

Abstract

Regulatory T (Treg) cells have an immunosuppressive function, and programmed death-1 (PD-1)-expressing Treg cells reportedly induce resistance to PD-1 blockade therapies through their reactivation. However, the effects of antigenicity on PD-1 expression in Treg cells and the resistance to PD-1 blockade therapy remain unclear. Here, we show that Treg cells gain high PD-1 expression through an antigen with high antigenicity. Additionally, tumors with high antigenicity for Treg cells were resistant to PD-1 blockade in vivo due to PD-1+ Treg-cell infiltration. Because such PD-1+ Treg cells have high cytotoxic T lymphocyte antigen (CTLA)-4 expression, resistance could be overcome by combination with an anti-CTLA-4 monoclonal antibody (mAb). Patients who responded to combination therapy with anti-PD-1 and anti-CTLA-4 mAbs sequentially after primary resistance to PD-1 blockade monotherapy showed high Treg cell infiltration. We propose that the high antigenicity of Treg cells confers resistance to PD-1 blockade therapy via high PD-1 expression in Treg cells, which can be overcome by combination therapy with an anti-CTLA-4 mAb.

Keywords: CTLA‐4; PD‐1; antigenicity; cancer immunotherapy; regulatory T cell.


Conflict of interest statement

K. Ninomiya received honoraria from Ono Pharmaceutical, Bristol‐Myers Squibb, Chugai Pharmaceutical, AstraZeneca, Daiichi‐Sankyo, MSD, Kyowa Kirin, Lilly, Takeda Pharmaceutical, Nippon Kayaku, Pfizer, Janssen Pharmaceutical, Boehringer Ingelheim, Taiho Pharmaceutical, Amgen, Elekta, and CareNet outside this study. T. Inozume received honoraria from Ono Pharmaceutical, Bristol‐Myers Squibb, and MSD; and research grants from Maruho, Taiho, Daiichi‐Sankyo, Torii, and Sun Pharma outside this study. K. Ohashi received honoraria from Boehringer Ingelheim, Chugai Pharmaceutical, Pfizer, Eli Lilly, Nippon Kayaku, KYOWA KIRIN, AstraZeneca, MSD, Novartis, Insmed, and Elekta; and research grants from Boehringer Ingelheim and Chugai Pharmaceutical outside of this study. Y. Togashi received honoraria from Ono Pharmaceutical, Bristol‐Myers Squibb, Chugai Pharmaceutical, AstraZeneca, Eisai, and MSD; and research grants from Ono Pharmaceutical, Bristol‐Myers Squibb, Daiichi‐Sankyo, Janssen Pharmaceutical, AstraZeneca, KOTAI Biotechnologies Inc., and KORTUC outside this study, is the Associate Editor of Cancer Science. All the other authors declare that they have no competing financial interests.

Figures
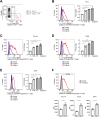
FIGURE 1
FIGURE 1
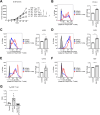
Relationship between TCR stimulation and PD‐1 expression in human eTreg cells. (A) Gating strategy for eTreg cells. To analyze eTreg cells, we used CD45RA and Foxp3, and defined CD45RAFoxp3highCD4+ T cells as eTreg cells. (B–E) PD‐1 (B), CTLA‐4 (C), ICOS (D), and GITR (E) expression in eTreg cells. Peripheral blood mononuclear cells (PBMCs) were cultured with anti‐CD3 and anti‐CD28 mAbs, and IL‐2 for 48 h and subjected to flow cytometry. Fold changes were calculated by normalizing the mean fluorescence intensity (MFI) of the no‐antibody group (0 μg/mL) to 1. Representative flow cytometry staining (left) and summaries (right) are shown (n = 3). (F) CTLA‐4, ICOS, and GITR in eTreg cells according to PD‐1 expression in the condition with 0.5 μg/mL anti‐CD3 mAb. In vitro experiments were performed as described in (B–E). Gating strategy for PD‐1 expression (top) and summaries (bottom/left, CTLA‐4; bottom/middle, ICOS; and bottom/right, GITR) are shown (n = 3). *p < 0.05; **p < 0.01; ***p < 0.001; bars, mean; error bars, SEM.
FIGURE 2
FIGURE 2
Relationship between TCR stimulation and PD‐1 expression in mouse Treg cells, and their suppressive function according to PD‐1 expression. (A–D) PD‐1 (A), CTLA‐4 (B), ICOS (C), and GITR (D) expression in Treg cells. Splenocytes from C57BL/6J mice were cultured with anti‐CD3 and anti‐CD28 mAbs, and IL‐2 for 48 h and subjected to flow cytometry. Fold changes were calculated by normalizing the mean fluorescence intensity (MFI) of the no‐antibody group (0 μg/mL) to 1. Representative flow cytometry staining (left) and summaries (right) are shown (n = 3). (E) CTLA‐4, ICOS, and GITR in Treg cells according to PD‐1 expression in the condition with 0.5 μg/mL anti‐CD3 mAb. In vitro experiments were performed as described in (A–D). Gating strategy for PD‐1 expression (leftmost) and summaries (second from the left, CTLA‐4; second from the right, ICOS; and rightmost, GITR) are shown (n = 3). (F) Suppression assay of Treg cells. CTV‐labeled responder CD8+ T cells (Tresp cells) from mouse splenocytes were cocultured with or without unlabeled sorted PD‐1 or PD‐1+ Treg cells. Anti‐PD‐1 mAb was added to some wells. The proliferation of Tresp cells was assessed 3 days later by dilution of CTV‐labeled cells using flow cytometry. The fold change in CTV dilution of Tresp cells was calculated. Summary is shown (n = 3). *p < 0.05; **p < 0.01; ***p < 0.001; bars, mean; error bars, SEM.
FIGURE 3
FIGURE 3
Relationship between antigenicity and PD‐1 expression in Treg cells in vitro. PD‐1 (A), CTLA‐4 (B), ICOS (C), and GITR (D) expression in OT‐II Treg cells. CD25+CD4+ Treg cells were purified from OT‐II splenocytes and stimulated with gamma‐irradiated antigen‐presenting cells pulsed with various peptides (OVA‐I, SIINFEKL; OVA‐II, ISQAVHAAHAEINEAGR; OVA‐II (F), ISQAVHAAFAEINEAGR; and OVA‐II (R), ISQAVHAARAEINEAGR). After 48 h, presensitized Treg cells were analyzed with flow cytometry. Fold changes were calculated by normalizing the mean fluorescence intensity of DMSO to 1. Representative flow cytometry staining (left) and summaries (right) are shown (n = 3). *p < 0.05; **p < 0.01; ***p < 0.001; ****p < 0.0001; ns, not significant; bars, mean; error bars, SEM.
FIGURE 4
FIGURE 4
Relationship between antigenicity and PD‐1 expression in tumor‐infiltrating Treg cells in vivo. (A) Experimental scheme. 5 × 105 parental B16F10, B16F10/OVA‐I, B16F10/OVA‐II (F), or B16F10/OVA‐II cells were injected subcutaneously into B6 SCID mice on day 0. Subsequently, 5 × 105 OT‐II Treg cells were injected intravenously on day 4. Tumors were harvested on day 8 for tumor‐infiltrating lymphocyte (TIL) analysis with flow cytometry. (B–E) PD‐1 (B), CTLA‐4 (C), ICOS (D), and GITR (E) expression in tumor‐infiltrating OT‐II Treg cells. Representative flow cytometry staining (left) and summaries (right) are shown (n = 5). *p < 0.05; **p < 0.01; ***p < 0.001; ****p < 0.0001; ns, not significant; bars, mean; error bars, SEM.
FIGURE 5
FIGURE 5
Analyses of tumor‐infiltrating WT and OT‐II Treg cells in adoptive T‐cell transfer models. (A) Experimental scheme. 5 × 105 B16F10/OVA or 1 × 106 LL2/OVA cells were injected subcutaneously into B6 SCID mice on day 0. Subsequently, 5 × 106 WT CD8+ T cells and/or 5 × 105 WT or OT‐II Treg cells were injected intravenously on day 4. Anti‐PD‐1, anti‐CTLA‐4 IgG2a, or control mAbs were administered intraperitoneally from day 5 onwards three times every 3 days. B16F10 tumors were harvested on day 12 for TIL analysis with flow cytometry. (B–E) PD‐1 (B), CTLA‐4 (C), ICOS (D), and GITR (E) expression in tumor‐infiltrating WT and OT‐II Treg cells. Representative flow cytometry staining (left) and summaries (right) are shown (n = 5). (F) CTLA‐4, ICOS, and GITR in tumor‐infiltrating OT‐II Treg cells according to PD‐1 expression. Summaries (left, CTLA‐4; middle, ICOS; and right, GITR) are shown (n = 5). MFI, mean fluorescence intensity; **p < 0.01; ***p < 0.001; ****p < 0.0001; bars or lines, mean; error bars, SEM.
FIGURE 6
FIGURE 6
Tumor growth and analyses of tumor‐infiltrating OT‐II Treg cells in adoptive T‐cell transfer models treated with PD‐1 and/or CTLA‐4 blockade. In vivo experiments were performed as described in Figure 5A. (A) B16F10/OVA tumor growth curves in B6 SCID mice treated with adoptive T‐cell transfer combined with PD‐1 and/or CTLA‐4 blockade. (B–F) CTLA‐4 (B), ICOS (C), GITR (D), OX‐40 (E), and Ki67 (F) expression in tumor‐infiltrating OT‐II Treg cells treated with or without PD‐1 blockade. Representative flow cytometry staining (left) and summaries (right) are shown (n = 5). (G) Treg/CD8+ T‐cell ratios in TILs treated with or without PD‐1 and/or CTLA‐4 blockade. Summary is shown (n = 5). *p < 0.05; **p < 0.01; ***p < 0.001; bars, mean; error bars, SEM.
FIGURE 7
FIGURE 7
Clinical courses and IHC. (A) Computed tomography imaging of case 1 who responded to combination with anti‐PD‐1 and anti‐CTLA‐4 mAbs sequentially after primary resistance to an anti‐PD‐1 mAb. She experienced progressive disease in lung metastases 3 months after first line nivolumab monotherapy at the first evaluation. Subsequently, she received combination therapy with ipilimumab as second line treatment. Four months later, tumors dramatically responded to the combination therapy. She achieved complete response for more than 8 years even without any therapies. (B) Computed tomography imaging of case 2 who responded to combination with anti‐PD‐1 and anti‐CTLA‐4 mAbs sequentially after primary resistance to an anti‐PD‐1 mAb. He experienced progressive disease in lung metastases 4 months after first line nivolumab monotherapy at the first evaluation, but continued monotherapy for 9 months without any tumor shrinkage. However, lung metastases further exacerbated. Subsequently, he received combination therapy with ipilimumab as second line treatment. Three months later, tumors dramatically responded to the combination therapy. (C) Computed tomography imaging of case 6 who failed to respond to combination with anti‐PD‐1 and anti‐CTLA‐4 mAbs sequentially after primary resistance to an anti‐PD‐1 mAb. She experienced progressive disease in lung metastases 3 months after 1st line pembrolizumab monotherapy at the first evaluation. Subsequently, she received combination therapy of nivolumab and ipilimumab as second line treatment. Three months later, lung tumor size increased and new liver metastases appeared (an arrow) and the treatment was discontinued. She died 5 months after the discontinuation. (D, E) immunohistochemistry (IHC) of cases 1, 2 (D) and 3–6 (E). Formalin fixed paraffin embedded (FFPE) samples before the initiation of anti‐PD‐1 mAb monotherapy were stained with an anti‐Foxp3 mAb and representative staining are shown. Scale bars, 20 μm.

References

    1. Brahmer J. R., Tykodi S. S., Chow L. Q., et al., “Safety and Activity of Anti‐PD‐L1 Antibody in Patients With Advanced Cancer,” New England Journal of Medicine 366 (2012): 2455–2465. - PMC - PubMed
    1. Topalian S. L., Hodi F. S., Brahmer J. R., et al., “Safety, Activity, and Immune Correlates of Anti‐PD‐1 Antibody in Cancer,” New England Journal of Medicine 366 (2012): 2443–2454. - PMC - PubMed
    1. Doki Y., Ajani J. A., Kato K., et al., “Nivolumab Combination Therapy in Advanced Esophageal Squamous‐Cell Carcinoma,” New England Journal of Medicine 386 (2022): 449–462. - PubMed
    1. Hellmann M. D., Paz‐Ares L., Bernabe Caro R., et al., “Nivolumab Plus Ipilimumab in Advanced Non‐Small‐Cell Lung Cancer,” New England Journal of Medicine 381 (2019): 2020–2031. - PubMed
    1. Baas P., Scherpereel A., Nowak A. K., et al., “First‐Line Nivolumab Plus Ipilimumab in Unresectable Malignant Pleural Mesothelioma (CheckMate 743): A Multicentre, Randomised, Open‐Label, Phase 3 Trial,” Lancet 397 (2021): 375–386. - PubMed

MeSH terms

LinkOut - more resources