. 2025 Feb 24:13:e18931.
doi: 10.7717/peerj.18931. eCollection 2025.

Alteration of primary cilia and intraflagellar transport 20 (IFT20) expression in oral squamous cell carcinoma (OSCC) cell lines

Affiliations

Alteration of primary cilia and intraflagellar transport 20 (IFT20) expression in oral squamous cell carcinoma (OSCC) cell lines

Gulam Sakinah-Syed et al. PeerJ. .

Abstract

Background: Aberrations in primary cilia expression and intraflagellar transport (IFT) protein function have been implicated in tumourigenesis. This study explores the relationship between the alteration of primary cilia and tumourigenesis by investigating primary cilia expression and the role of IFT20 in regulating matrix metalloproteinase 9 (MMP-9) expression in oral squamous cell carcinoma (OSCC) cell lines.

Methods: The frequency and length of primary cilia were determined in OKF6-TERT2 cells, HSC-2 cells, and HSC-3 cells using immunofluorescence. Additionally, primary cilia presence in non-proliferating OSCC cells was examined. OSCC cells were treated with either small interfering RNA (siRNA) negative control or siRNA targeting IFT20 for functional analysis. mRNA expression levels of IFT20 and MMP-9 were quantified using quantitative reverse transcription polymerase chain reaction (qRT-PCR).

Results: Results showed that HSC-2 cells exhibit abundant primary cilia when cultured in low serum media (2% serum) for 48 h, followed by serum starvation for over 72 h. No significant changes in cilia expression were observed in HSC-3 cells compared to OKF6-TERT2 cells. Ciliated cells were found in non-proliferating HSC-2 and HSC-3 cells. OSCC cells showed longer cilia than OKF6-TERT2 cells, indicating ciliary abnormalities. Changes in ciliation and cilium length of OSCC cells were accompanied by increased expression of IFT20, an intraflagellar transport protein crucial for the primary cilia assembly. However, IFT20 knockdown did not affect MMP-9 at the mRNA level in these cells.

Conclusions: This study reveals the differences in primary cilia expression among OSCC cells. Furthermore, the increased abundance and elongation of primary cilia in OSCC cells are accompanied by elevated expression of IFT20. Nonetheless, IFT20 did not affect MMP-9 mRNA expression in OSCC cells.

Keywords: Arl13b; Cilia length; Cilia occurrence; IFT20; MMP-9; Oral cancer; Primary cilia.


Conflict of interest statement

The authors declare that they have no competing interests.

Figures
Figure 1
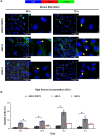
Figure 1. The presence of primary cilia in normal oral keratinocytes and OSCC cell lines cultured in low serum media.
OKF6-TERT2, HSC-2, and HSC-3 cells were grown in media containing 2% serum for 48 h, followed by either serum starvation for 24–72 h or serum fed for 5 days. Cells were fixed and stained with antibodies against Arl13b (ciliary membrane) and γ-tubulin (basal body), as well as DAPI (nuclei). (A) The axoneme (red) and basal body (green) of primary cilia were visualised using a fluorescence microscope at 40× magnification. Scale bar: 50 μm. Arrows indicate primary cilia. (B) The percentage of ciliated cells (ciliated cells per 200 total cells) was quantified. Data represent the mean ± SEM with scattered points shown each biological repeat. Statistical analysis was performed using the Kruskal-Wallis test, followed by Dunn’s multiple comparisons test. Statistical significance is indicated as *p < 0.05.
Figure 2
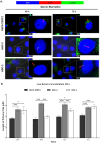
Figure 2. The presence of primary cilia in normal oral keratinocytes and OSCC cell lines cultured in high serum media.
OKF6-TERT2, HSC-2, and HSC-3 cells were grown in media containing 20% serum for 48 h, followed by either serum starvation for 24–72 h or serum fed for 5 days. Cells were fixed and stained with antibodies against Arl13b (ciliary membrane) and γ-tubulin (basal body), as well as DAPI (nuclei). (A) The axoneme (red) and basal body (green) of primary cilia were visualised using a fluorescence microscope at 40× magnification. Scale bar: 50 μm. Arrows indicate primary cilia. (B) The percentage of ciliated cells (ciliated cells per 200 total cells) was quantified. Data represent the mean ± SEM with scattered points shown each biological repeat. Statistical analysis was performed using the Kruskal-Wallis test, followed by Dunn’s multiple comparisons test. Statistical significance is indicated as *p < 0.05.
Figure 3
Figure 3. Serum starvation induces ciliogenesis in OSCC cell lines cultured in low serum media.
HSC-2 and HSC-3 cells were cultured in media containing 2% serum for 48 h. Cells were then cultured in media either with 2% serum or without serum for 24, 48, and 72 h. Fixed cells were stained with Ki67 (proliferation marker), α-tubulin (axoneme), and DAPI (nuclei). (A) The axoneme (green) of primary cilia in Ki67-negative HSC-2 and HSC-3 cells was visualised using a fluorescence microscope at 40× magnification. Proliferating cells appear magenta. Scale bar: 20 μm. Arrows indicate primary cilia. (B) Dot plots display the percentage of ciliated cells (out of 200 total cells) in HSC-2 and HSC-3. Data represent the mean ± SEM with scattered points shown each biological repeat. Statistical analysis was performed using the Mann-Whitney test. Statistical significance is indicated as *p < 0.05.
Figure 4
Figure 4. Serum starvation induces ciliogenesis in OSCC cell lines cultured in high serum media.
HSC-2 and HSC-3 cells were cultured in media containing 20% serum for 48 h. Cells were then cultured in media either with 20% serum or without serum for 24, 48, and 72 h. Fixed cells were stained with Ki67 (proliferation marker), α-tubulin (axoneme), and DAPI (nuclei). (A) The axoneme (green) of primary cilia in Ki67-negative HSC-2 and HSC-3 cells was visualised using a fluorescence microscope at 40× magnification. Proliferating cells appear magenta. Scale bar: 20 μm. Arrows indicate primary cilia. (B) Dot plots display the percentage of ciliated cells (out of 200 total cells) in HSC-2 and HSC-3. Data represent the mean ± SEM with scattered points shown each biological repeat. Statistical analysis was performed using the Mann-Whitney test. Statistical significance is indicated as *p < 0.05.
Figure 5
Figure 5. Primary cilia length in normal oral keratinocytes and OSCC cell lines cultured in low serum media.
OKF6-TERT2, HSC-2, and HSC-3 cells were cultured in media containing 2% serum for 48 h, followed by either serum starvation for 24–72 h or serum fed for 5 days. Cells were fixed and stained with antibodies against Arl13b (ciliary membrane), γ-tubulin (basal body), and DAPI (nuclei). (A) The axoneme (red) of primary cilia was visualised using a fluorescence microscope at 100× magnification. A digitally zoomed image of a single cell shows the cilium length. Scale bar: 10 μm. (B) The length of primary cilia was quantified using ImageJ software. Data represent means, with error bars indicating the standard error of the mean (n = 3). Statistical analysis was performed using the Kruskal-Wallis test, followed by Dunn’s multiple comparisons test. Statistical significance is indicated as *p < 0.05 and ***p < 0.001.
Figure 6
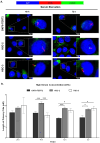
Figure 6. Primary cilia length in normal oral keratinocytes and OSCC cell lines cultured in high serum media.
OKF6-TERT2, HSC-2, and HSC-3 cells were cultured in media containing 20% serum for 48 h, followed by either serum starvation for 24–72 h or serum fed for 5 days. Cells were fixed and stained with antibodies against Arl13b (ciliary membrane), γ-tubulin (basal body), and DAPI (nuclei). (A) The axoneme (red) of primary cilia was visualised using a fluorescence microscope at 100× magnification. A digitally zoomed image of a single cell shows the cilium length. Scale bar: 10 μm. (B) The length of primary cilia was quantified using ImageJ software. Data represent means, with error bars indicating the standard error of the mean (n = 3). Statistical analysis was performed using the Kruskal-Wallis test, followed by Dunn’s multiple comparisons test. Statistical significance is indicated as *p < 0.05 and ***p < 0.001.
Figure 7
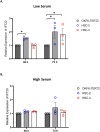
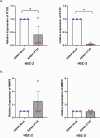
Figure 7. IFT20 expression in OSCC cell lines cultured in low and high serum media.
OKF6-TERT2, HSC-2, and HSC-3 cells were grown in the media containing 2% or 20% serum for 48 h, followed by serum starvation for 24–72 h. RNA was extracted, reverse transcribed and subjected to qPCR to determine the mRNA level of IFT20. The bar graphs represent mRNA levels of IFT20 in HSC-2 and HSC-3 cells cultured in low serum media (A) and high serum media (B). GAPDH serves as endogenous control. Data represent the mean ± SEM with scattered points shown each biological repeat. Data were analysed using the Kruskal-Wallis test, followed by Dunn’s multiple comparison test. Statistical significance is shown by *p < 0.05. IFT20, intraflagellar transport 20.
Figure 8
Figure 8. IFT20 and MMP-9 expression after transient knockdown of IFT20 in OSCC cell lines.
HSC-2 and HSC-3 cells were transfected with 120 nM synthetic siRNA IFT20 or siRNA mock and incubated for 48 h. RNA was extracted, reverse transcribed and subjected to qPCR to determine the mRNA level of IFT20 and MMP-9. After transient knockdown, the downregulation of (A) IFT20 and (B) MMP-9 were determined by qRT-PCR. The mRNA levels of IFT20 and MMP-9 were normalised to GAPDH. Data represent the mean ± SEM with scattered points shown each biological repeat. Data were analysed using the Mann-Whitney test. Statistical significance is shown by *p < 0.05. IFT20, intraflagellar transport 20; MMP-9, matrix metalloproteinase 9; siRNA, small interfering RNA.

References

    1. Amador-Arjona A, Elliott J, Miller A, Ginbey A, Pazour GJ, Enikolopov G, Roberts AJ, Terskikh AV. Primary cilia regulate proliferation of amplifying progenitors in adult hippocampus: implications for learning and memory. Journal of Neuroscience. 2011;6;31(27):9933–9944. doi: 10.1523/JNEUROSCI.1062-11.2011. - DOI - PMC - PubMed
    1. Aoki T, Nishita M, Sonoda J, Ikeda T, Kakeji Y, Minami Y. Intraflagellar transport 20 promotes collective cancer cell invasion by regulating polarized organization of Golgi-associated microtubules. Cancer Science. 2019;110(4):1306–1316. doi: 10.1111/cas.13970. - DOI - PMC - PubMed
    1. Basten SG, Willekers S, Vermaat JS, Slaats GG, Voest EE, van Diest PJ, Giles RH. Reduced cilia frequencies in human renal cell carcinomas versus neighboring parenchymal tissue. Cilia. 2013;2(1):1–8. doi: 10.1186/2046-2530-2-2. - DOI - PMC - PubMed
    1. Bray F, Ferlay J, Soerjomataram I, Siegel RL, Torre LA, Jemal A. Global cancer statistics 2018: GLOBOCAN estimates of incidence and mortality worldwide for 36 cancers in 185 countries. CA: A Cancer Journal for Clinicians. 2018;68(6):394–424. doi: 10.3322/caac.21492. - DOI - PubMed
    1. Cai M, Zheng Z, Bai Z, Ouyang K, Wu Q, Xu S, Huang L, Jiang Y, Wang L, Gao J, Pathak JL. Overexpression of angiogenic factors and matrix metalloproteinases in the saliva of oral squamous cell carcinoma patients: potential non-invasive diagnostic and therapeutic biomarkers. BMC Cancer. 2022;22:530. doi: 10.1186/s12885-022-09630-0. - DOI - PMC - PubMed

MeSH terms

LinkOut - more resources