. 2025 Mar 25;44(3):115264.
doi: 10.1016/j.celrep.2025.115264. Epub 2025 Feb 27.

Neural stem cell relay from B1 to B2 cells in the adult mouse ventricular-subventricular zone

Affiliations

Neural stem cell relay from B1 to B2 cells in the adult mouse ventricular-subventricular zone

Arantxa Cebrian-Silla et al. Cell Rep. .

Abstract

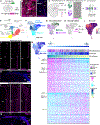
Neurogenesis and gliogenesis continue in the ventricular-subventricular zone (V-SVZ) of the adult rodent brain. V-SVZ astroglial cells with apical contact with the ventricle (B1 cells) function as neural stem cells (NSCs). B1 cells sharply decline during early postnatal life; in contrast, neurogenesis decreases at a slower rate. Here, we show that a second population of astroglia (B2 cells) that do not contact the ventricle also function as NSCs in the adult mouse brain. B2 cell numbers increase postnatally, are sustained in adults, and decrease with aging. We reveal the transcriptomic profile of B1 and B2 cells and show that, like B1 cells, B2 cells can be quiescent or activated. Transplantation and lineage tracing of B2 cells demonstrate their function as primary progenitors for adult neurogenesis. This study reveals that NSC function is progressively relayed from B1 to B2 progenitors helping explain how neurogenesis is maintained into adult life.

Keywords: B1 cells; B2 cells; CP: Neuroscience; apical cells; basal cells; neural stem cells; neurogenesis; primary cilium; transcriptomics; ventricular-subventricular zone; wedge region.


Conflict of interest statement

Declaration of interests A.A.-B. is the Heather and Melanie Muss Endowed Chair and Professor of Neurological Surgery at UCSF. He is co-founder and on the Scientific Advisory Board of Neurona Therapeutics.

Figures
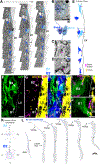
Figure 1.
Figure 1.. B2 cells are non-apical V-SVZ astrocytes.
(A) Transmission electron microscopy (TEM) serial sections of the P60 V-SVZ (3 ultrathin sections spaced 1.7μm (3/150 studied)). B1 and B2 cells were pseudo-colored in light and dark blue, respectively. B1 cells contact the LV through a small apical contact, but B2 cells lack this contact. (B) High magnification of B1 and B2 cells in (A) and their three-dimensional reconstruction. (C, D) High magnification micrographs of B1 and B2 cells’ basal bodies. (C) B1 cell apical contact, identified by the presence of tight junctions (arrows) with ependymal cells, shows a basal body (arrowhead). (D) B2 cells lack tight junctions, and the basal body (arrowhead) is basally located. (E) Max projection tracings of B1 (light blue) and B2 (dark blue) cells from complete reconstruction (Figure S1H–J). (F-H) Confocal images showing GFP+ B1 and B2 cells and their primary cilium-basal bodies labeled with Arl13b (yellow) and FOP (magenta). Dotted lines outline the apical surface. (I-J) High magnification images from (H) show a GFP+ B2 cell lacking apical contact with its primary cilium-basal body basally located. B1 cell shows its primary cilium-basal body contacting the ventricle. (K) Map of B2 cells along the V-SVZ. Note B2 cells in the wedge, a region devoid of ventricular cavity. (L) Radar maps of dorsal B1 and B2 cells’ primary cilium orientation (n=3, 427 cells). Magenta dashed lines indicate the mean values. See also Figures S1 and S2. Bv: Blood vessel, CC: corpus callosum, RMS: Rostral Migratory stream, LV: Lateral Ventricle. Scale bars: 5μm (A, F-H), 2μm (B), 250nm (C-D), 2.5μm (I-J) and 30 μm (K).
Figure 2.
Figure 2.. B1 and B2 cells are widely distributed in the V-SVZ, but their prevalence differs with age.
(A-D) Confocal images of a V-SVZ whole-mount preparation from hGFAP::GFP mouse. (A, B) The surface of the lateral ventricle shows B1 cells apical contacts, identified by GFP+ expression at the center of the pinwheels with apical localization of their primary cilium (Arl13b, yellow) and basal body (γ-tubulin, magenta). (C, D) Deeper within the SVZ B2 cells identified by GFP expression and basal location of their primary cilium-basal body. (E, F) Maps of B1 (15,864) and B2 (17,246) cells in a P60 female whole-mount preparation; density maps show their overall distribution. (G) Quantifications of B1 and B2 cells over time in whole-mounts (n=6, 3 females and 3 males/time point, except P545 3 females and 1 male). B1 cells decreased sharply within the first 4 months of age (from 10625 to 2015 GFP+ cells/mm2, p-value <0.0001). B2 cell numbers increased between P10 and P28 (from 2547 to 5067 GFP+ cells/mm2, p-value 0.0132) and their numbers remained relatively stable up to P365 (6465 GFP+ cells/mm2, non-significant). B2 cell numbers decreased significantly from 6465 to 3832 GFP+ cells/mm2 between P365 and P574, p-value 0.025. (H) Quantifications of all B (B1+B2) cells over time. B cells decrease with age from 12499 (P10) to 3994 (P545) cells/mm2, p-value <0.0001. Data are represented as mean ± SD. Test: One-way ANOVA with Tukey’s multiple comparisons. Statistical significance was defined as * p ≤ 0.05, ** p < 0.01, *** p < 0.001, **** p < 0.0001. See also Figure S3. LV: lateral ventricle. Scale bars: 20μm (A) and 10μm (B-D).
Figure 3.
Figure 3.. B1 cells give rise to B2 cells.
(A) Schematic of Violet Cell Trace (VCT) injection into the lateral ventricles in P14 hGFAP:GFP mice. (B, C) Confocal images of the contralateral lateral ventricle 1 day after injection. B2 cells labeled with VCT, identified by GFP+ expression and the basal localization of their primary cilium (Arl13b, yellow) and basal body (γ-tubulin, magenta), significantly increased at d30 (from 19.45% to 57.93%, p-value 0.0056). No labeled cells were found in the wedge extension. (D) Confocal images of a B2 cell VCT+/BrdU+. Data are represented as mean ± SD. Test: ventricles. Scale bars: 250μm (B) and 5μm (B, D). Student’s t-test. Statistical significance ** p < 0.01. See also Figure S3. CC: corpus callosum, LV: lateral
Figure 4.
Figure 4.. B1 and B2 cells differ in their transcriptomic profiles.
(A) Schematic of the intraventricular injection of Adenovirus-Cre-EGFP into TdTomato mice. (B-C) Confocal images of the contralateral V-SVZ 24 hrs after injection. A fraction (see text) of B1 and ependymal cells were TdTomato+. The wedge cells were TdTomato. (D) Schematic of the whole-cell single-cell isolation and sequencing protocol (scRNA-Seq). The wedge region and lateral wall were microdissected from the contralateral hemisphere 24 hrs after injection. Cells were dissociated, barcoded, multiplexed, and loaded into the 10x Chromium Controller. (E) UMAP plot of scRNA-Seq cell types captured after sequencing, downstream analysis, and integration with dataset. (F) UMAP plot showing subset and re-clustered B cells. B cell clusters annotated by their activation states and regional identities. See also Figure S4. (G) Distribution of barcoded cells from the lateral wall and wedge microdissections. (H) Distribution of apical-labeled cells (B1 cells) identified by TdTomato expression. (I) B1 cells score expression. (J-K) Confocal images depict RNA expression of B1 cells with differentially expressed genes Atf3, Anxa2, and Tagln2 in the ventricular zone (VZ). (L) RNA expression of B2 cells differentially expressed genes Ptprz1, Zeb1, and Mfge8 in the subventricular zone (SVZ). (N) HeatMap of differentially expressed genes between B1 and B2 cells. See Figures S4 and S5. CC: corpus callosum, Str: striatum, LV: lateral ventricle. Scale bars: 5μm (B), 100μm (J, L), and 30μm (K, M).
Figure 5.
Figure 5.. B2 cells show primary progenitor properties.
(A-B) Protein-protein network diagrams of differentially expressed genes in B1 (A) and B2 cells (B). Diagrams show first neighbor interactions for Actg1 for B1 and Ptprz1 for B2 and their functional enrichment annotations. (C) Barplots for B1 and B2 cells activation states. (D) Alluvial plot of the correlation between cell types identified in our dataset and predicted identities from Carvajal-Ibanez et al., 2023. (E) Proportion of B1 and B2 cells corresponding to qNSC1, qNSC2, aNSC, TAP, and NB in Carvajal-Ibanez et al., 2023. (F) B2 cell, identified by GFP (green) expression and the basal body location (γ-tubulin, magenta, arrow), expresses EGFR (white). (G, H) TEM micrographs of an EGFR+ B2 cell (arrows show Au particles from the TEM-immunogold). (I) Percentage of EGFR+ B2 cells in the wedge, dorsal, and ventral lateral wall regions (n=3). (J) Single BrdU administration and analysis after 30 min in P60 mice. Brdu+ B2 cell (white) in the wedge. (K) Confocal images of a Ki67+ B2 cell (white) in the wedge. (L) Percentage of BrdU+ and Ki67+ B2 cells in the wedge, dorsal, and ventral lateral wall regions (n=3). (M) UMAP plot of the neurogenic lineage after cell-cycle regression. (N, O) Pseudotime and trajectories of B1 and B2 cells visualized on a 2-dimensional UMAP embedding. Barplots showing the proportion of B1 and B2 cells’ trajectories ending in B, C, or A cells (B1 cells n=1450, B2 cells n= 4446). See also Figure S6. Scale bars: 2 μm (M), 2.5μm (F) and 5μm (J, K).
Figure 6.
Figure 6.. B2 cells are neurogenic.
(A) Wedge transplantation strategy. (B) Confocal images of TdTomato+/GFP+ granular cells in the OB of a transplanted mouse. (C) Granule cell layer (GCL) position (0 = core of the OB; 100 = edge with the mitral cell layer) of wedge transplant-derived OB granular cell interneurons per animal (symbols represent individual cells, lines represent mean values). (D) Confocal images of periglomerular TdTomato+/GFP+ cells. (E, F) Transplantation site showing TdTomato+/GFP+ oligodendrocytes in the corpus callosum. GL: Granular layer, EPL: external plexiform layer, ML: mitral layer, GCL: granular cell layer, RMS: rostral migratory stream, CC: corpus callosum, Str: striatum, LV: lateral ventricle. Scale bars: 0.5mm (P), 50μm (M), 35μm (O), 15μm (Q), 10μm (E), 5μm (A, C, H, K), 2μm (B), 500 nm (F).

Update of

References

    1. Ming G-L, and Song H (2011). Adult neurogenesis in the mammalian brain: significant answers and significant questions. Neuron 70, 687–702. 10.1016/j.neuron.2011.05.001. - DOI - PMC - PubMed
    1. Kriegstein A, and Alvarez-Buylla A (2009). The glial nature of embryonic and adult neural stem cells. Annu. Rev. Neurosci. 32, 149–184. 10.1146/annurev.neuro.051508.135600. - DOI - PMC - PubMed
    1. Götz M, and Huttner WB (2005). The cell biology of neurogenesis. Nat. Rev. Mol. Cell Biol. 6, 777–788. 10.1038/nrm1739. - DOI - PubMed
    1. Mirzadeh Z, Merkle FT, Soriano-Navarro M, Garcia-Verdugo JM, and Alvarez-Buylla A (2008). Neural stem cells confer unique pinwheel architecture to the ventricular surface in neurogenic regions of the adult brain. Cell Stem Cell 3, 265–278. 10.1016/j.stem.2008.07.004. - DOI - PMC - PubMed
    1. Chaker Z, Codega P, and Doetsch F (2016). A mosaic world: puzzles revealed by adult neural stem cell heterogeneity. Wiley Interdiscip. Rev. Dev. Biol. 5, 640–658. 10.1002/wdev.248. - DOI - PMC - PubMed