. 2025 Feb 28;23(2):e3003043.
doi: 10.1371/journal.pbio.3003043. eCollection 2025 Feb.

Incomplete recombination suppression fuels extensive haplotype diversity in a butterfly colour pattern supergene

Affiliations

Incomplete recombination suppression fuels extensive haplotype diversity in a butterfly colour pattern supergene

Rishi De-Kayne et al. PLoS Biol. .

Abstract

Supergenes can evolve when recombination-suppressing mechanisms like inversions promote co-inheritance of alleles at two or more polymorphic loci that affect a complex trait. Theory shows that such genetic architectures can be favoured under balancing selection or local adaptation in the face of gene flow, but they can also bring costs associated with reduced opportunities for recombination. These costs may in turn be offset by rare 'gene flux' between inverted and ancestral haplotypes, with a range of possible outcomes. We aimed to shed light on these processes by investigating the 'BC supergene', a large genomic region comprising multiple rearrangements associated with three distinct wing colour morphs in Danaus chrysippus, a butterfly known as the African monarch, African queen and plain tiger. Using whole-genome resequencing data from 174 individuals, we first confirm the effects of BC on wing colour pattern: background melanism is associated with SNPs in the promoter region of yellow, within an inverted subregion of the supergene, while forewing tip pattern is most likely associated with copy-number variation in a separate subregion of the supergene. We then show that haplotype diversity within the supergene is surprisingly extensive: there are at least six divergent haplotype groups that experience suppressed recombination with respect to each other. Despite high divergence between these haplotype groups, we identify an unexpectedly large number of natural recombinant haplotypes. Several of the inferred crossovers occurred between adjacent inversion 'modules', while others occurred within inversions. Furthermore, we show that new haplotype groups have arisen through recombination between two pre-existing ones. Specifically, an allele for dark colouration in the promoter of yellow has recombined into distinct haplotype backgrounds on at least two separate occasions. Overall, our findings paint a picture of dynamic evolution of supergene haplotypes, fuelled by incomplete recombination suppression.


Conflict of interest statement

The authors have declared that no competing interests exist.

Figures
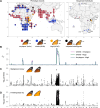
Fig 1
Fig 1. Broad geographic distribution of Danaus chrysippus morphs and our continent-wide sampling of individuals spans wing pattern variation that is underpinned largely by variation on chromosome 15.
(A) Geographic distribution of the three main D. chrysippus forewing morphs; chrysippus, orientis, and klugii as well as putative heterozygotes (data from manual curation of GBIF record and other scientific collections, following the approach in [ 44]; left) and sampled locations of D. chrysippus individuals used for genomic analysis in the present study (right). Public domain map from naturalearthdata.com. Morphs and their corresponding inferred genotypes at the B and C loci are shown below. Note that for our purposes the forewing morph ‘chrysippus’ includes the west-African morph ‘alcippus’, which has the same forewing phenotype, but differs in its hindwing phenotype. (B) Genome-wide patterns of FST between morphs (smoothed across discrete 50 kb windows) highlighting significant differentiation along the length of the chr15 supergene region. (C, D) Genome-wide associations between SNP variation and (C) background colouration (individuals were scored as light, intermediate, or dark; N = 172, following [44]) and (D) forewing band presence/absence (individuals were scored as absent, partial, or present; N = 172, following [44]) reflecting significant associations between this region and wing-pattern variation. Significant associations, as identified via permutation tests (p < 0.05), are represented by black points. The data underlying this figure can be found in https://doi.org/10.5281/zenodo.14718778 and S1 Table.
Fig 2
Fig 2. Genetic clustering and ancestry painting suggest additional divergent haplotype groups, and recombinants.
(A) Neighbor-Net network for unphased diploid genotypes across the BC supergene (excluding the copy-number variable [CNV] region). Each tip represents one diploid individual, and the network is constructed based on average pairwise genetic distances considering both haplotypes in each individual. We therefore expect ‘heterozygous’ individuals carrying two distinct haplotypes to be at intermediate positions in the network. Numbers indicate the 27 representative individuals for which ancestry painting is shown in panel C. The single individual represented by a black dot is the Danaus melanippus outgroup. (B) Localities for sequenced individuals (public domain map from naturalearthdata.com). Pie charts in panels A and B represent inferred ancestry components for each diploid individual from Admixture analysis with k = 4 source populations (See Figs D–H in S1 Text for plots with other values of k). Note that for highly sampled localities, an arbitrary subset of sequenced individuals is shown in panel B. Numbered individuals correspond with those in Panels A and C. C. Ancestry painting across the central portion of chr15 including the BC supergene for 27 representative individuals, including homozygotes, heterozygotes and putative recombinants. See Figs I and J in S1 Text for ancestry painting for all individuals. The CNV region is excluded from the plot for convenience as it cannot be reliably genotyped (represented as a white gap). Arrows above the plots indicate the locations of inverted tracts 1.1 (1.3 Mb). 1.2 (0.9 Mb), 2 (1.6 Mb) and 4 (0.5 Mb). The inferred location of the B locus (yellow) is indicated by a circle in the centre of each plot. The approximate location of the C locus is indicated by a triangle in the gap where the copy-number variable region is found. The data underlying this figure can be found in https://doi.org/10.5281/zenodo.14718778.
Fig 3
Fig 3. The supergene region has reduced genetic diversity in all haplotype groups and elevated genetic differentiation between them, but no evidence for a very recent origin of any haplotype.
(A) A graphical representation of the structural variation across the chrysippus, orientis, and klugii haplotypes described in [21]. The additional divergent haplotypes described in the present study have not yet been assembled with long reads, so their structures remain unknown. The three previously assembled haplotypes evolved through rearrangements of four main regions (indicated with different colours; arrows indicate orientation relative to the ancestral state). Regions 1.1, 1.2, 2, and 4 remain in single copy and can be reliably aligned and genotyped. (B–E) Population summary statistics computed in non-overlapping 50 kb windows for representative populations of chrysippus (NGA population), orientis (TSW), klugii (WAT), and karamu (two homozygous individuals from the SPA), plotted across chr15 (excluding the copy-number variable region). Note that the reference genome is from a klugii haplotype, hence regions 1 and 2 are adjacent. Statistics plotted are: (B) nucleotide diversity (π), (C) absolute pairwise divergence (dXY), (D) net pairwise divergence (da), and (E) pairwise differentiation (FST). The data underlying this figure can be found in https://doi.org/10.5281/zenodo.14718778.
Fig 4
Fig 4. Two independent cases of recombination within the BC supergene with phenotypic consequences.
(A) Topology weightings across chr15 showing how the karamu haplotype is related to the klugii and orientis haplotypes. Upper panel shows three possible rooted genealogical topologies. Second panel shows weights for each topology along the chromosome, smoothed with a 20 kb span. Arrows above the plot indicate the locations of inversions. Third panel shows unsmoothed topology weightings across a 1.5 Mb region corresponding to Inversion 2. (B) Ancestry painting from Loter [54] across a 100 kb region within Inversion 2 showing ancestry tracts for two homozygous karamu individuals compared to two representative individuals homozygous for the orientis and klugii haplotypes. Coding regions are indicated below the plot, with the candidate gene for background colouration yellow indicated. Green triangles represent the top 10 SNPs for background colour in our GWAS (Fig 1C). There is evidence for recombination throughout the supergene region, and specifically in the vicinity of yellow, consistent with the hypothesis that orientis ancestry at this locus (i.e., the B allele) is associated with darker colouration in karamu individuals. (C, D) A second example of recombination in the promoter of yellow. Plots are as described for panels A and B, except showing relationships between two individuals from North Africa and Mediterranean with a chrysippus-like haplotype (according to Admixture and ancestry painting), but dark background colouration. Again, orientis ancestry in the promoter region of yellow suggests that recombination allowed the transfer of the B allele into a different genetic background, causing darker wing colouration. The data underlying this figure can be found in https://doi.org/10.5281/zenodo.14718778.

References

    1. Charlesworth B, Charlesworth D. Selection of new inversions in multi-locus genetic systems. Genet Res. 1973;21:167–83.
    1. Thompson MJ, Jiggins CD. Supergenes and their role in evolution. Heredity (Edinb). 2014;113(1):1–8. doi: 10.1038/hdy.2014.20 - DOI - PMC - PubMed
    1. Charlesworth B. The effects of inversion polymorphisms on patterns of neutral genetic diversity. Genetics. 2023;224(4):iyad116. doi: 10.1093/genetics/iyad116 - DOI - PMC - PubMed
    1. Mérot C, Llaurens V, Normandeau E, Bernatchez L, Wellenreuther M. Balancing selection via life-history trade-offs maintains an inversion polymorphism in a seaweed fly. Nat Commun. 2020;11:670. - PMC - PubMed
    1. Küpper C, Stocks M, Risse JE, Dos Remedios N, Farrell LL, McRae SB, et al.. A supergene determines highly divergent male reproductive morphs in the ruff. Nat Genet. 2016;48(1):79–83. doi: 10.1038/ng.3443 - DOI - PMC - PubMed

LinkOut - more resources