Personalized Tumor-Specific Amplified DNA Junctions in Peripheral Blood of Patients with High-Grade Gliomas
- PMID: 40019927
- PMCID: PMC12010965
- DOI: 10.1158/1078-0432.CCR-24-3233
Personalized Tumor-Specific Amplified DNA Junctions in Peripheral Blood of Patients with High-Grade Gliomas
Abstract
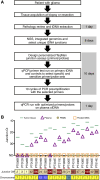
Purpose: Monitoring disease progression in patients with high-grade gliomas (HGG) is challenging due to treatment-related changes in imaging and the requirement for neurosurgical intervention to obtain diagnostic tissue. DNA junctions in HGG often amplify oncogenes, making these DNA fragments potentially more abundant in blood than monoallelic mutations. In this study, we piloted a cell-free DNA approach for disease detection in the plasma of patients with HGG by leveraging patient-specific DNA junctions associated with oncogene amplifications.
Experimental design: Whole-genome sequencing of grade 3 or 4 isocitrate dehydrogenase-mutant or wild-type astrocytomas was utilized to identify amplified junctions. Individualized qPCR assays were developed using patient-specific primers designed for the amplified junction. ctDNA levels containing these junctions were measured in patient plasma samples.
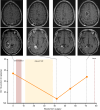
Results: Unique amplified junctions were evaluated by individualized semi-qPCR assays in presurgical plasma of 18 patients, 15 with tumor-associated focal amplifications and three without tumor-associated focal amplifications. high copy-number junctions were robustly detected in the plasma of 14 of 15 (93.3%) patients with amplified junctions and none of the controls. Changes in junction abundance correlated with disease trajectory in serial plasma samples from five patients, including increased abundance of amplified junctions preceding radiographic disease progression.
Conclusions: In patients with grade 3 or 4 astrocytomas who had tumor-associated amplifications, patient-specific amplified junctions were successfully detected in assayed plasma from most patients. Longitudinal analysis of plasma samples correlated with disease trajectory, including cytoreduction and progression.
©2025 The Authors; Published by the American Association for Cancer Research.
Conflict of interest statement
M.F. Ali reports grants from NCI and the National Institute of Neurological Disorders and Stroke during the conduct of the study. J.B. Smadbeck reports other support from Veracyte outside the submitted work and employment with Veracyte, a company that is pursuing intellectual property in MRD Technologies that is not associated with this work. S.H. Kizilbash reports grants from FDA Office of Orphan Products Development during the conduct of the study as well as grants from LOXO Oncology, Orbus Therapeutics, CNS Pharmaceuticals, Wayshine Biopharma, Aminex Therapeutics, Apollomics, Nerviano Medical Sciences, Incyte, Celgene, and SonALAsense outside the submitted work. D.M. Routman reports other support from Adela outside the submitted work and has a patent for DNA methylation licensed to Exact Sciences and support from the NCI Paul Calabresi Program in Clinical/Translational Research at the Mayo Clinic Comprehensive Cancer Center (K12CA090628). T.C. Burns reports grants from NIH during the conduct of the study. G. Vasmatzis reports ownership of WholeGenome LLC. No disclosures were reported by the other authors.
Figures


References
-
- Brandsma D, Stalpers L, Taal W, Sminia P, van den Bent MJ. Clinical features, mechanisms, and management of pseudoprogression in malignant gliomas. Lancet Oncol 2008;9:453–61. - PubMed
-
- de Wit MCY, de Bruin HG, Eijkenboom W, Sillevis Smitt PA, van den Bent MJ. Immediate post-radiotherapy changes in malignant glioma can mimic tumor progression. Neurology 2004;63:535–7. - PubMed
MeSH terms
Substances
Grants and funding
- K12 CA090628/CA/NCI NIH HHS/United States
- R37 CA276851/CA/NCI NIH HHS/United States
- R61 NS122096/NS/NINDS NIH HHS/United States
- T32 GM145408/GM/NIGMS NIH HHS/United States
- This work was supported by the Mayo Clinic Center for Individualized Medicine and its Biomarker Discovery and Precision Cancer Therapeutics Programs.
- Mayo Clinic Office of Translation to Practice
- Advance the Practice Research Award
- T32GM145408/GF/NIH HHS/United States
- T32GM145408/National Institute of General Medical Sciences (NIGMS)
- R01 FD-R-07288/U.S. Food and Drug Administration (FDA)
- K12CA090628/National Cancer Institute (NCI)
- R37CA276851/National Cancer Institute (NCI)
- R61 NS122096/NS/NINDS NIH HHS/United States
- Center for Individualized Medicine, Mayo Clinic (CIM)
- Office of Translation to Practice - Advance the Practice research award/Mayo Clinic (The Mayo Clinic)
- Clinician Investigator Award/Mayo Clinic (The Mayo Clinic)
- Uihlein Neuro-Oncology Research Fund/Mayo Clinic (The Mayo Clinic)
LinkOut - more resources
Full Text Sources
Medical

