. 2025 Feb 28;11(9):eadu7985.
doi: 10.1126/sciadv.adu7985. Epub 2025 Feb 28.

Norovirus co-opts NINJ1 for selective protein secretion

Affiliations

Norovirus co-opts NINJ1 for selective protein secretion

Jaewon Song et al. Sci Adv. .

Abstract

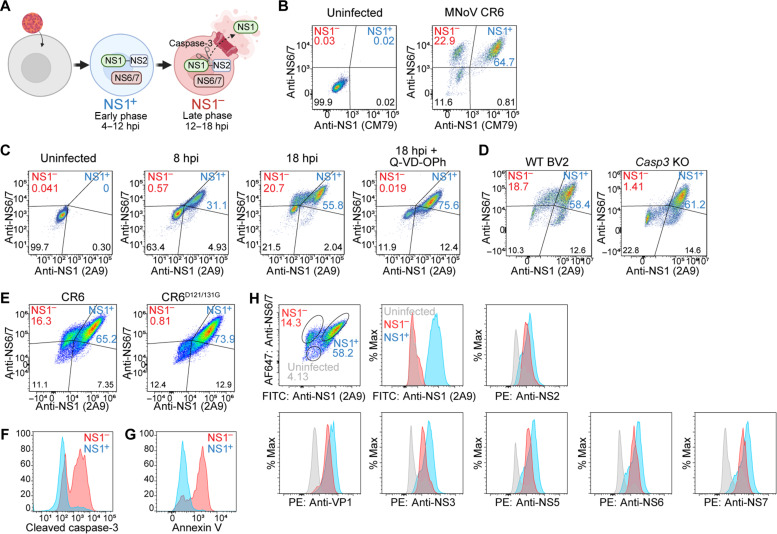
Plasma membrane rupture by Ninjurin-1 (NINJ1) executes programmed cell death, releasing large cellular damage-associated molecular patterns (DAMPs). However, the regulation and selectivity of NINJ1-mediated DAMP release remain unexplored. Here, we uncover that murine norovirus (MNoV) strategically co-opts NINJ1 to selectively release the intracellular viral protein NS1, while NINJ1-mediated plasma membrane rupture simultaneously bulk-releases various cellular DAMPs. Host caspase-3 cleaves the precursor NS1/2, leading to NS1 secretion via an unconventional pathway. An unbiased CRISPR screen identifies NINJ1 as an essential factor for NS1 secretion. During infection, NINJ1 is recruited to the viral replication site, where it oligomerizes and forms speckled bodies, directly interacting with NS1. Subsequent mutagenesis studies identify critical amino acid residues of NS1 necessary for its interaction with NINJ1 and selective secretion. Genetic ablation or pharmaceutical inhibition of caspase-3 inhibits oral MNoV infection in mice. This study underscores the co-option of NINJ1 for controlled release of an intracellular viral protein.


Figures

Fig. 1.
Fig. 1.. Caspase-3 is essential for MNoV intestinal infection.
(A and B) Casp3+/+, Casp3+/−, and Casp3−/− mice were infected with 106 plaque-forming units (PFUs) of MNoV CR6 perorally (p.o.). MNoV genomes in stool at 3, 7, 14, and 21 dpi (A) and in ileum, colon, and MLN at 21 dpi (B) were quantified by quantitative reverse transcription polymerase chain reaction (qRT-PCR) (n = 10 to 17 mice per group, combined from three independent experiments). (C and D) Casp3+/+, Casp3+/−, and Casp3−/− mice were infected with 106 PFU of MNoV CW3 perorally and analyzed at 3 dpi. MNoV genomes in stool (C) and in ileum, MLN, and spleen (D) were quantified by qRT-PCR (n = 10 to 22 mice per group, combined from three independent experiments). (E and F) Casp3+/+, Casp3+/−, and Casp3−/− mice were infected with 106 PFU of CR6 intraperitoneally (ip) and analyzed at 3 dpi. MNoV genomes in stool (E) and in ileum, colon, MLN, and spleen (F) were quantified by qRT-PCR (n = 5 to 22 mice per group, combined from three or four independent experiments). Data represent means ± SEM. Data were analyzed by one-way analysis of variance (ANOVA) with Kruskal-Wallis test. ns, not significant; *P < 0.05; ***P < 0.001; ****P < 0.0001. The dashed lines represent the limit of detection.
Fig. 2.
Fig. 2.. Characterization of the NS1 population during MNoV infection.
(A) Depiction of the NS1 positivity and negativity in CR6-infected BV2 cells. (B) Intracellular flow cytometry plots of CR6-infected BV2 cells costained with NS6/7 and NS1 (measured with clone CM79) at 16 hpi. (C) Intracellular flow cytometry plots of CR6-infected BV2 cells costained with NS6/7 and NS1 (measured with clone 2A9) at 8 or 18 hpi. Q-VD-OPh (20 μM) was added along with the virus when indicated. (D and E) Intracellular flow cytometry plots of WT or Casp3 KO BV2 cells infected with CR6 (D) or BV2 cells infected with WT CR6 or CR6D121/131G mutant virus (E) and costained with NS6/7 and NS1 at 18 hpi. (F) Comparison of caspase-3 activation in NS1 and NS1+ cells, measured with an antibody targeting cleaved caspase-3. (G) Surface staining with annexin V compared in NS1 and NS1+ cells. (H) BV2 cells were infected with CR6, harvested at 18 hpi, and costained with NS1, NS6/7, and other viral proteins. Intracellular levels of indicated viral proteins measured by flow cytometry in NS1 and NS1+ cells are shown.
Fig. 3.
Fig. 3.. NINJ1-mediated membrane rupture is essential for NS1 secretion.
(A) Volcano plot showing sgRNAs depleted or enriched in NS1 cells compared to NS1+ cells. (B to E) WT or Ninj1 clonal KO BV2 cells were infected with MNoV CR6 at 5 multiplicity of infection (MOI). (B) NS1 protein levels in the supernatant were measured at 14 hpi by enzyme-linked immunosorbent assay (ELISA) (n = 3). (C) LDH release was measured at 16 hpi (n = 3). (D) Sytox uptake was measured at 12 ~ 20 hpi (n = 3). (E) Cells (WCL) and supernatants (Sup) were analyzed by immunoblotting at 10 ~ 16 hpi. (F and G) WT or Ninj1 KO iBMDMs (F) or IEC-M2C-CD300lf cells transduced with indicated sgRNAs (G) were infected with CR6, and NS1 secretion was measured at 14 hpi (n = 3). (H to K) WT or Ninj1 KO BV2 cells were transduced with NINJ1 WT or oligomerization-defective mutant (K45Q) and infected with CR6. (H) Cells and supernatants were analyzed by immunoblotting at 14 hpi. (I) NS1 secretion was measured by ELISA at 14 hpi (n = 6). (J) Sytox uptake was measured at 14 ~ 20 hpi (n = 3). (K) LDH release was measured at 16 hpi (n = 3). (L) WT or Ninj1 KO BV2 cells were infected with CR6 and treated with glycine (5 mM). NS1 secretion was measured at 14 hpi (n = 3). (M) BV2 cells were infected at 1 MOI with WT CR6 or mutant virus (CR6∆N) and analyzed by ELISA and immunoblotting at 10 hpi (n = 6 from two independent experiments). Data represent means ± SEM. Data were normalized to Tween-20–treated control [(C), (D), (J), and (K)]. Data were analyzed by one-way ANOVA with Dunnett’s multiple comparisons test [(B), (C), (F), (G), and (I)] and Tukey’s multiple comparisons test [(K) and (L)] or two-tailed unpaired Mann-Whitney test (M). ns, not significant; **P < 0.01; ****P < 0.0001. Data are representative of three independent experiments.
Fig. 4.
Fig. 4.. Amino acid residues within NS1 required for the specific secretion of NS1.
(A) Mutant studies revealed residues required for NS1 secretion. (B) BV2 cells were transfected with a mock vector or 2xStrep-NS1/2 and caspase-3 activation was measured by flow cytometry. (C) WT or Ninj1 KO BV2 cells were transfected with 2xStrep-NS1/2. Cells and supernatants were harvested at 24 hours posttransfection and analyzed by immunoblotting. (D) BV2 cells were transfected with 2xStrep-tagged NS1/2 constructs with N-terminal truncation mutations, and cells and supernatants were analyzed by immunoblotting at 24 hours posttransfection. Red arrowheads indicate different truncation mutants. (E) BV2 cells were transfected with D121/131G cleavage mutant and triple-alanine scanning mutants and analyzed as in (D). Numbers indicate amino acid residues substituted by alanine. Mutants showing defect in secretion are highlighted in red. (F) BV2 cells were transfected with NS1/2 constructs with indicated point mutations and analyzed as in (D). (G) 3D structure of CR6 NS1 (58 to 114 amino acids; PDB: 2MCK) highlighting the key residues identified from mutagenesis study. (H and I) BV2 cells with doxycycline-inducible expression of 2xStrep-tagged WT or mutant NS1/2 were infected with MNoV CR6 and incubated with doxycycline (2 μg/ml) for 12 hours. (H) Cells (WCL) and supernatants (Sup) were analyzed by immunoblotting. (I) LDH release was measured and normalized to Tween-20–treated control (n = 3). Data represent means ± SEM and were analyzed by two-way ANOVA with Dunnett’s multiple comparisons test.
Fig. 5.
Fig. 5.. NS1 directly binds to NINJ1.
(A) WT or Ninj1 KO BV2 cells were infected with CR6 at 5 MOI and harvested at 10 hpi. Cell lysates were immunoprecipitated with anti-NS1 and analyzed by immunoblotting. (B and C) Transmission electron microscopy image of uninfected (B) or CR6-infected (C) BV2 cells with immunogold labeling for FLAG-NINJ1 (12-nm gold, black arrowheads) and NS1 (18-nm gold, red arrowheads). RC, replication complex. Scale bar, 500 nm. (D) Representative immunofluorescence confocal imaging of FLAG-NINJ1 (red), NS1 (green), NS6/7 (cyan), and 4′,6-diamidino-2-phenylindole (DAPI, blue) in Ninj1 KO BV2 cells reconstituted with FLAG-NINJ1 WT or K45Q at 14 hpi. White arrowhead highlights the colocalization of NINJ1 and NS1 proteins. Scale bars, 5 μm. All images are representative of three or more independent experiments. (E) Quantification of colocalization between NS1 and FLAG-NINJ1 WT or K45Q. Bars represent means ± SEM, n = 10 to 11 cells. (F) Dose-dependent binding of Fc-tagged ectodomain of human NINJ1 (hNINJ1) or mouse NINJ1 (mNINJ1) protein to recombinant NS1 protein was determined by ELISA. A monoclonal anti-NS1 (clone CM79) and isotype control were included as a positive and negative control, respectively. Data represent means ± SEM of duplicates, and the dissociation constants (Kd) are shown. (G to I) Direct binding between recombinant NS1 and mNINJ1 protein was measured by MST. ΔFnorm indicates the change in thermophoresis, and Kd is shown. n.d., not determined. (G) Dose-response curve showing bindings of WT NS1 protein to fluorescence-labeled WT or mutated mNINJ1 proteins. (H) Dose-response curve showing bindings of WT or mutated NS1 proteins to fluorescence-labeled mNINJ1. Maltose-binding protein (MBP) was included as a negative control. (I) Dose-response curve showing bindings of WT or mutated NS1 proteins to fluorescence-labeled monoclonal anti-NS1 or isotype control. Data are shown in means ± SEM (n = 3).
Fig. 6.
Fig. 6.. HSP90 inhibitors prevent NS1 secretion by blocking caspase-3 activation.
(A) BV2 cells were infected with CR6 at 5 MOI in the presence of 2321 FDA-approved drugs (dots represent individual drugs tested). NS1 levels in the supernatant were measured by ELISA at 16 hpi and normalized to vehicle control. Representative results from two independent experiments are shown. (B to D) Cells were infected with CR6 in the presence of serial dilutions of drugs. NS1 secretion was measured by ELISA at 16 hpi and normalized to no-drug control. IC50 values (nM) determined by four biological replicates are shown. BV2 cells were treated with 17-AAG (left), AT13385 (middle), or ganetespib (right) (B). IEC-M2C-CD300lf (C) or IEC-Mx2LUC-CD300lf (D) cells were treated with ganetespib. (E) Caspase-3 activation in CR6-infected BV2 cells with ganetespib (10 μM) was measured with an antibody targeting cleaved caspase-3. For (B) to (E), data are representative of two to three independent experiments. (F to H) WT or Ifnlr1−/− B6 mice were infected with 106 PFU CR6 perorally. Ganetespib was given intravenously (50 mg/kg, iv) as experimental treatment scheme (F). MNoV genomes in stool (G), ileum, colon, and MLN (H) at indicated time points were quantified by qRT-PCR (n = 7 to 10 mice per group, combined from two independent experiments). Data represent means ± SEM and analyzed by two-tailed unpaired Mann-Whitney test. ns, not significant; *P < 0.05; **P < 0.01; ***P < 0.001.

References

    1. Kayagaki N., Kornfeld O. S., Lee B. L., Stowe I. B., O’Rourke K., Li Q., Sandoval W., Yan D., Kang J., Xu M., Zhang J., Lee W. P., McKenzie B. S., Ulas G., Payandeh J., Roose-Girma M., Modrusan Z., Reja R., Sagolla M., Webster J. D., Cho V., Andrews T. D., Morris L. X., Miosge L. A., Goodnow C. C., Bertram E. M., Dixit V. M., NINJ1 mediates plasma membrane rupture during lytic cell death. Nature 591, 131–136 (2021). - PubMed
    1. Kayagaki N., Stowe I. B., Alegre K., Deshpande I., Wu S., Lin Z., Kornfeld O. S., Lee B. L., Zhang J., Liu J., Suto E., Lee W. P., Schneider K., Lin W., Seshasayee D., Bhangale T., Chalouni C., Johnson M. C., Joshi P., Mossemann J., Zhao S., Ali D., Goldenberg N. M., Sayed B. A., Steinberg B. E., Newton K., Webster J. D., Kelly R. L., Dixit V. M., Inhibiting membrane rupture with NINJ1 antibodies limits tissue injury. Nature 618, 1072–1077 (2023). - PMC - PubMed
    1. Degen M., Santos J. C., Pluhackova K., Cebrero G., Ramos S., Jankevicius G., Hartenian E., Guillerm U., Mari S. A., Kohl B., Muller D. J., Schanda P., Maier T., Perez C., Sieben C., Broz P., Hiller S., Structural basis of NINJ1-mediated plasma membrane rupture in cell death. Nature 618, 1065–1071 (2023). - PMC - PubMed
    1. David L., Borges J. P., Hollingsworth L. R., Volchuk A., Jansen I., Garlick E., Steinberg B. E., Wu H., NINJ1 mediates plasma membrane rupture by cutting and releasing membrane disks. Cell 187, 2224–2235.e16 (2024). - PMC - PubMed
    1. Lee S., Liu H., Wilen C. B., Sychev Z. E., Desai C., Hykes B. L. Jr., Orchard R. C., McCune B. T., Kim K. W., Nice T. J., Handley S. A., Baldridge M. T., Amarasinghe G. K., Virgin H. W., A secreted viral nonstructural protein determines intestinal norovirus pathogenesis. Cell Host Microbe 25, 845–857.e5 (2019). - PMC - PubMed