. 2025 Feb 28;11(9):eadt0795.
doi: 10.1126/sciadv.adt0795. Epub 2025 Feb 28.

Composition and function of AChR chimeric autoantibody receptor T cells for antigen-specific B cell depletion in myasthenia gravis

Affiliations

Composition and function of AChR chimeric autoantibody receptor T cells for antigen-specific B cell depletion in myasthenia gravis

Sangwook Oh et al. Sci Adv. .

Abstract

In acetylcholine receptor (AChR)-seropositive myasthenia gravis (MG), anti-AChR autoantibodies impair neuromuscular transmission and cause severe muscle weakness. MG therapies broadly suppress immune function, risking infections. We designed a chimeric autoantibody receptor (CAAR) expressing the 210-amino acid extracellular domain of the AChR α subunit (A210) linked to CD137-CD3ζ cytoplasmic domains to direct T cell cytotoxicity against anti-AChRα B cells. A210-CAART incorporating a CD8α transmembrane domain (TMD8α) showed functional but unstable surface expression, partially restored by inhibiting lysosomal degradation. A210-CAART with a CD28 TMD showed sustained surface expression, independent of TMD dimerization motifs. In a mouse xenograft model, A210.TMD8α-CAART demonstrated early control of anti-AChR B cell outgrowth but subsequent rebound and loss of surface CAAR expression, whereas A210.TMD28-CAART induced sustained surface CAAR expression and target cell elimination. This study demonstrates the importance of the CD28 TMD for CAAR stability and in vivo function, laying the groundwork for future development of precision cellular immunotherapy for AChR-MG.


Figures

Fig. 1.
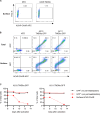
Fig. 1.. AChR-CAAR with a CD8α TMD demonstrates decreased but functional cell surface expression during ex vivo expansion.
(A and B) Total and surface AChR-CAAR expression in human T cells during ex vivo expansion was detected with or without cell permeabilization, respectively. (A) Representative plots from nontransduced (NTD) or A210.TMD8α-CAAR T cells at day 4 and day 11 after T cell activation. (B) Surface AChR-CAAR expression relative to total expression is shown using two different donor CAAR T cell preparations. (C) A210.TMD8α- CAAR T cells were cocultured with Nalm-6 control, Nalm-6 192, or Nalm-6 637 cells for 24 hours, and specific cytolysis was measured using a luciferase-based killing assay. Each dot represents mean ± SD.
Fig. 2.
Fig. 2.. The expression pattern of A210.TMD8α-CAAR and A211.TMD8α-CAAR is comparable during ex vivo expansion.
(A) Surface AChR-CAAR was stained using mAb 35 in A208.TMD8α-CAART. (B and C) Total and surface AChR-CAAR expression in A210.TMD8α.GFP-CAART and A211.TMD8α.GFP-CAART was detected with or without permeabilization before staining, respectively. Expression of AChR-CAAR and GFP is shown at day 8 after T cell activation in (B).
Fig. 3.
Fig. 3.. Incorporation of a CD28 TMD stabilizes AChR CAAR surface expression.
(A) Schematic diagram sho0wing A210.TMD8α-CAAR T cells and A210.TMD28-CAAR T cells. (B and C) Total and surface AChR-CAAR expression from NTD T cells (black), A210.TMD8α-CAAR T cells (red), and A210.TMD28-CAAR T cells (blue) during ex vivo expansion was detected with or without permeabilization, respectively. (C) Ratio of surface to total AChR-CAAR expression. Each dot represents mean ± SD.
Fig. 4.
Fig. 4.. Inhibition of lysosomal degradation partially restores the surface expression of AChR-CAAR during ex vivo expansion.
(A) The lysine residues within 4-1BB intracellular domains used in A210.TMD8α-CAAR were replaced with arginines (red). Surface AChR-CAAR expression relative to the total expression of A210.TMD8α.BBZ and A210.TMD8α.BBKRZ T cells was plotted. (B) A210.TMD8α-CAAR T cells were treated with each ER stress inhibitor (1 μM Kira6, 1 μM GSK2606414, or 6 μM Ceapin-A7) on day 4 and day 6. Total and surface AChR-CAAR expression was detected at day 7 with or without permeabilization before staining, respectively. Surface AChR-CAAR expression relative to the total expression was plotted. Each dot represents mean ± SD: ****P < 0.0001; one-way analysis of variance (ANOVA) with Holm-Sidak multiple comparisons test. (C and D) A210.TMD8α-CAAR T cells were treated with NH4Cl (20 mM) at day 4. Total and surface AChR-CAAR expression at day 6 is shown (C) and relative surface/total ratio of AChR-CAAR expression to nontreated A210.TMD8α-CAAR T cells was plotted (D). Each dot represents mean ± SD: *P < 0.05; paired t test. (E) A210.TMD8α-CAAR T cells were treated with sunitinib at indicated concentrations on day 4 and day 6. Surface and total AChR-CAAR expression was detected at day 7. Relative surface/total ratio of AChR-CAAR expression to the control (DMSO) was plotted. Each dot represents mean ± SD: *P < 0.05; one-way ANOVA with Holm-Sidak multiple comparisons test.
Fig. 5.
Fig. 5.. Dimerization motifs within TMDs affect the transport efficiency of A210-CAAR but do not influence the stability of surface expression.
(A) Mutations of amino acid residues to disrupt homo- or heterodimerization of CD8α TMD or CD28 TMD are indicated in red. (B and C) Total and surface A210-CAAR expression from A210.TMD8α-CAAR T cells (red), C1mut (blue), C2mut (green), and C12mut (purple) during ex vivo expansion were detected with or without permeabilization before cell staining, respectively. Surface A210-CAAR expression relative to the total expression was plotted (B). Relative surface/total ratio of A210-CAAR expression to day 4 was plotted (C). This experiment was conducted using T cells from two different donors. (D and E) Total and surface A210-CAAR expression from A210.TMD28-CAAR T cells (black), GYALmut (red), M4mut (blue), and LLmut (green) during ex vivo expansion. Surface A210-CAAR expression relative to the total expression was plotted (D). Relative surface/total ratio of A210-CAAR expression to day 3 was plotted (E). Each dot represents mean ± SD.
Fig. 6.
Fig. 6.. A210.TMD28-CAART exhibited slower but comparable cellular cytotoxicity with A210.TMD8α-CAART.
(A) The percentage of AChR-CAAR+ cells of A210.TMD8α-CAAR T cells were detected using mAb 35 followed by staining by anti-rat IgG-PE. (B) AChR-CAAR T cells were coincubated with Nalm-6 control, Nalm-6 192, or Nalm-6 637 cells at indicated effector:target (E:T) ratios. Specific lysis (%) was detected at 4 hours and 24 hours after coincubation using a luciferase-based killing assay. (C) Supernatants were collected at 24 hours after coincubation, and human IFN-γ (hIFN-γ) production was detected using enzyme-linked immunosorbent assay. Each dot represents mean ± SD.
Fig. 7.
Fig. 7.. A210.TMD28-CAART demonstrates sustained cell surface expression and cytotoxic activity in vivo.
(A and B) A total of 1 × 10⁶ Nalm-6 cells (1:1 mixture of Nalm-6 192 and Nalm-6 637 cells) were injected via tail vein at day 0. Mice were treated with 1 × 10⁷ T cells (n = 5, NTD-T; n = 5, A210.TMD8-CAART; and n = 5, A210.TMD28-CAART) on day 4 (indicated as a red dashed line) after target cell injection. Bioluminescence images were taken every 2 to 3 days, and total flux [photons per second (p/s)] was plotted. Basal level of total flux (1 × 10⁶) is indicated as a black dashed line. (C to H) Mice were euthanized after the final bioluminescence imaging. The profiles of Nalm-6 cells (GFP) and T cells (C) and IgG expression in GFP+ Nalm-6 cells (F) were plotted. The percentage of Nalm-6 cells (D), T cells (E), and IgG+ cells in Nalm-6 cells (G) and the surface/total ratio of AChR-CAAR expression in T cells (H) were summarized. Error bars show mean ± SEM: **P < 0.01; one-way ANOVA with Holm-Sidak multiple comparisons test.

References

    1. June C. H., Sadelain M., Chimeric antigen receptor therapy. N. Engl. J. Med. 379, 64–73 (2018). - PMC - PubMed
    1. Haghikia A., Hegelmaier T., Wolleschak D., Bottcher M., Desel C., Borie D., Motte J., Schett G., Schroers R., Gold R., Mougiakakos D., Anti-CD19 CAR T cells for refractory myasthenia gravis. Lancet Neurol. 22, 1104–1105 (2023). - PubMed
    1. Muller F., Taubmann J., Bucci L., Wilhelm A., Bergmann C., Volkl S., Aigner M., Rothe T., Minopoulou I., Tur C., Knitza J., Kharboutli S., Kretschmann S., Vasova I., Spoerl S., Reimann H., Munoz L., Gerlach R. G., Schafer S., Grieshaber-Bouyer R., Korganow A. S., Farge-Bancel D., Mougiakakos D., Bozec A., Winkler T., Kronke G., Mackensen A., Schett G., CD19 CAR T-cell therapy in autoimmune disease–A case series with follow-up. N. Engl. J. Med. 390, 687–700 (2024). - PubMed
    1. Motte J., Sgodzai M., Schneider-Gold C., Steckel N., Mika T., Hegelmaier T., Borie D., Haghikia A., Mougiakakos D., Schroers R., Gold R., Treatment of concomitant myasthenia gravis and Lambert-Eaton myasthenic syndrome with autologous CD19-targeted CAR T cells. Neuron 112, 1757–1763.e2 (2024). - PubMed
    1. Schneider-Gold C., Gilhus N. E., Advances and challenges in the treatment of myasthenia gravis. Ther. Adv. Neurol. Disord. 14, 17562864211065406 (2021). - PMC - PubMed