. 2025 Feb 28;11(9):eadr9660.
doi: 10.1126/sciadv.adr9660. Epub 2025 Feb 28.

TFIIH kinase CDK7 drives cell proliferation through a common core transcription factor network

Affiliations

TFIIH kinase CDK7 drives cell proliferation through a common core transcription factor network

Taylor Jones et al. Sci Adv. .

Erratum in

Abstract

How cyclin-dependent kinase 7 (CDK7) coordinately regulates the cell cycle and RNA polymerase II transcription remains unclear. Here, high-resolution cryo-electron microscopy revealed how two clinically relevant inhibitors block CDK7 function. In cells, CDK7 inhibition rapidly suppressed transcription, but constitutively active genes were disproportionately affected versus stimulus-responsive. Distinct transcription factors (TFs) regulate constitutive versus stimulus-responsive genes. Accordingly, stimulus-responsive TFs were refractory to CDK7 inhibition whereas constitutively active "core" TFs were repressed. Core TFs (n = 78) are predominantly promoter associated and control cell cycle and proliferative gene expression programs across cell types. Mechanistically, rapid suppression of core TF function can occur through CDK7-dependent phosphorylation changes in core TFs and RB1. Moreover, CDK7 inhibition depleted core TF protein levels within hours, consistent with durable target gene suppression. Thus, a major but unappreciated biological function for CDK7 is regulation of a TF cohort that drives proliferation, revealing an apparent universal mechanism by which CDK7 coordinates RNAPII transcription with cell cycle CDK regulation.


Figures

Fig. 1.
Fig. 1.. Cryo-EM structures of CAK-SY-5609 and CAK-SY-1365.
(A) SY-5609 structure, shown in its protonated form that predominates at physiological pH. (B) Structure of CAK-SY-5609. CDK7 is shown in gray (T-loop pink), MAT1 in orange, cyclin H in brown, SY-5609 in green, and water molecules in red. (C) SY-5609 bound in the CDK7 active site. The SY-5609-CDK7 D97 salt bridge is indicated and residues K41, D97, and V100 are labeled. (D) SY-1365 with its hinge-binding aminopyrimidine in the active site and the reactive warhead covalently bonded to CDK7 C312. (E) Superposition of the CAK-SY-5609 and CAK-1365 structures. (F) Hydrogen bonding network between SY-5609 and CDK7.
Fig. 2.
Fig. 2.. CDK7 inhibition does not block stimulus-responsive transcription but selectively represses genes involved in proliferation and cell cycle progression.
(A) Schematic of PRO-seq experiments ±SY-5609 in OV90 and HCT116 cells. (B) Heatmap summarizing transcription changes (coding and noncoding genes; n = 8918) after 45 min heat shock (HS) ± SY-5609. (C) Genome browser view of PRO-seq reads at DNAJB1 locus ±HS and ± SY-5609. (D) Dot plot showing the top eight GSEA pathways (C5 ALL pathway set) ± HS, based on PRO-seq data at t = 45 min. Dot size is proportional to normalized enrichment score; asterisk designates FDR q ≤ 0.05. (E) Genome browser view of PRO-seq reads at IRF1 locus ± IFN-γ and ±SY-5609. (F) Dot plot showing the top eight GSEA pathways (C5 ALL pathway set) ± SY-5609 in OV90 or HCT116 cells, based on PRO-seq data from unstimulated cells (t = 30 min SY-5609 or DMSO). Dot size is proportional to normalized enrichment score; asterisk designates FDR q ≤ 0.05.
Fig. 3.
Fig. 3.. CDK7 inhibition rapidly shuts down a network of core TFs.
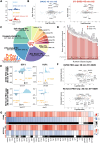
(A) Genome browser examples of PRO-seq data; location of HSF2 motif indicated with a dashed line. (B) TFEA MA plots for DMSO (left) and SY-5609 (right) after 45 min HS. Dark blue/red = significantly up-regulated and light blue/light orange = significantly down-regulated (P-adj ≤ 0.01). The x axis shows Log10(number of motif colocalization events) and the y axis shows the E score, corrected for motif GC content (25). (C) Donut plot summary of core factors based on their HOCOMOCO designation. Inset: E2F1 motif. (D) Bar plot summarizing TF profiler (28) results from 299 nascent RNA-seq datasets across 27 different tissues. Red bars represent core TFs (n = 78) whereas gray bars represent other TFs (n = 310). A mean statistical enrichment [−log10(P value)] was used because of multiple datasets for a given tissue (see Materials and Methods); bars represent standard error. (E) Genome browser examples of bidirectional transcripts ±SY-5609, under basal conditions (i.e., no stimulation). (F) TFEA MA plots for OV90 and HCT116 cells under normal growth conditions ±SY-5609. Blue = significantly down-regulated TFs; orange = significantly up-regulated TFs (P-adj ≤ 0.01). The x axis shows Log10(number of motif colocalization events) and the y axis shows the E score, corrected for motif GC content (25). (G) Heatmaps showing core TFs significantly changing in activity (P-adj ≤0.01) in OV90 or HCT116 cells ±SY-5609 (n = 36 TFs; see Materials and Methods). Control refers to the calculated MD score (26) from PRO-seq data in DMSO control conditions. The ±SY-5609 heatmap shows the corrected E score calculated from TFEA (25), from PRO-seq data ±SY-5609. The grayscale heatmap shows the significance based on TFEA results. Data for all core TFs are shown in fig. S16.
Fig. 4.
Fig. 4.. CDK7 inhibition alters core TF phosphorylation, depletes core TF proteins, and reduces expression of core TF target genes.
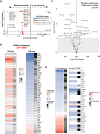
(A) Volcano plots from TFEA.ChIP analysis (30), which predicts differential TF activity, applied here to RNA-seq data. The plot has three analyses superimposed: ±heat shock (HS) as a positive control (blue dots) and ±SY5609 for 4 hours (red dots) or 30 min (yellow dots). Core TFs are labeled, with the exception of HDAC6 and HSF1, which are activated +HS. Asterisks on the y axis signify a maximum statistical confidence value given that TFEA.ChIP reports as P-adj = 0. (B) Heatmaps summarizing quantitative proteomics data for core TFs in OV90 cells ±SY-5609. Only TFs changing with statistical confidence (P ≤ 0.1) in at least one condition are shown; data for all 78 core TFs are shown in fig. S16. TFs in bold font colocalize with RB1 on chromatin (40). The grayscale heatmaps reflect the significance values. (C) Volcano plot showing phospho-site changes in core TFs following SY-5609 treatment (t = 60 min, 50 nM) versus untreated DMSO controls (OV90 cells). (D) Heatmaps summarizing phospho-proteomics data (left column) and inferred TF activity changes (TFEA E score, right column) ± SY-5609 in OV90 cells, matched by core TF listed on the right. The grayscale heatmaps reflect the significance values.
Fig. 5.
Fig. 5.. CDK7 targets RB1 TFs; CDK7 does not affect core TFs through CDK4/6.
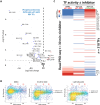
(A) Volcano plot summarizing phospho-site changes in RB1, RBL1, or RBL2 following SY-5609 treatment (t = 60 min, 50 nM) versus untreated DMSO controls (OV90 cells). (B) Single-cell immunofluorescence data in untreated (DMSO), SY-5609, or palbociclib-treated OV90 cells. Shown are density scatterplots of phospho (Ser807/Ser811) RB1 after 30 min treatment. Blue vertical lines indicate cell cycle phase gating based on Hoechst stain; red lines indicate the median phospho-RB1 intensity in untreated cells; black lines indicate the median phospho-RB1 intensity in drug-treated cells. Phospho-RB1 was normalized to total RB1 in each cell. Note that many sites in addition to Ser807/Ser811 were detected by MS as shown in (A). (C) Heatmaps summarizing TF activity as measured by TFEA (25) based on PRO-seq data in OV90 or HCT116 cells ± inhibitor (t = 30 min, normal growth conditions). Labeled on the right are 14 core TFs down-regulated +SY-5609 in both OV90 and HCT116, but up-regulated +palbociclib; opposite trends for three TFs labeled on the bottom right. Note that 318 TFs are represented here, not just core TFs. This emphasizes the selectivity of SY-5609 for the core TFs; the activity of most TFs does not change in SY-5609–treated cells.
Fig. 6.
Fig. 6.. Model: CDK7 coordinates RNAPII transcription with its regulation of cell cycle CDKs through RB1 and a core TF network.
Five different mechanisms for CDK7-dependent regulation of cell cycle and proliferation are represented. Mechanisms 1, 2, and 4 derive from this study. Mechanisms 1 and 2 reflect rapid CDK7-dependent phosphorylation changes consistent with reduced core TF activity. Mechanism 3 reflects elevated inactive RNAPII at the TSS in CDK7-inhibited cells and cannot be ruled out as a contributing factor. Mechanism 4 reflects depletion of core TF proteins within hours of CDK7 inhibition; mechanism 5 represents the CAK function of CDK7, which helps regulate the activity of cell cycle CDKs. See the main text for additional details.

References

    1. Larochelle S., Merrick K. A., Terret M. E., Wohlbold L., Barboza N. M., Zhang C., Shokat K. M., Jallepalli P. V., Fisher R. P., Requirements for Cdk7 in the assembly of Cdk1/cyclin B and activation of Cdk2 revealed by chemical genetics in human cells. Mol. Cell 25, 839–850 (2007). - PMC - PubMed
    1. Matthews H. K., Bertoli C., de Bruin R. A. M., Cell cycle control in cancer. Nat. Rev. Mol. Cell Biol. 23, 74–88 (2022). - PubMed
    1. Schachter M. M., Merrick K. A., Larochelle S., Hirschi A., Zhang C., Shokat K. M., Rubin S. M., Fisher R. P., A Cdk7-Cdk4 T-loop phosphorylation cascade promotes G1 progression. Mol. Cell 50, 250–260 (2013). - PMC - PubMed
    1. Rimel J. K., Poss Z. C., Erickson B., Hamman K. B., Hu S., Ebmeier C. C., Johnson J. L., Marineau J. J., Carulli J. P., Geyer M., White P., Breault M., Tao L., DeRoy P., Clavet C., Nayak S., Iwasa J., Bentley D. L., Dowell R. D., Old W. M., Taatjes D. J., Selective inhibition of CDK7 reveals high-confidence targets and new models for TFIIH function in transcription. Genes Dev. 34, 1452–1473 (2020). - PMC - PubMed
    1. Fisher R. P., The CDK network: Linking cycles of cell division and gene expression. Genes Cancer 3, 731–738 (2012). - PMC - PubMed

MeSH terms

Substances