. 2025 Mar 4;122(9):e2416542122.
doi: 10.1073/pnas.2416542122. Epub 2025 Feb 28.

A numerically exact description of ultrafast vibrational decoherence in vibration-coupled electron transfer

Affiliations

A numerically exact description of ultrafast vibrational decoherence in vibration-coupled electron transfer

Yuanheng Wang et al. Proc Natl Acad Sci U S A. .

Abstract

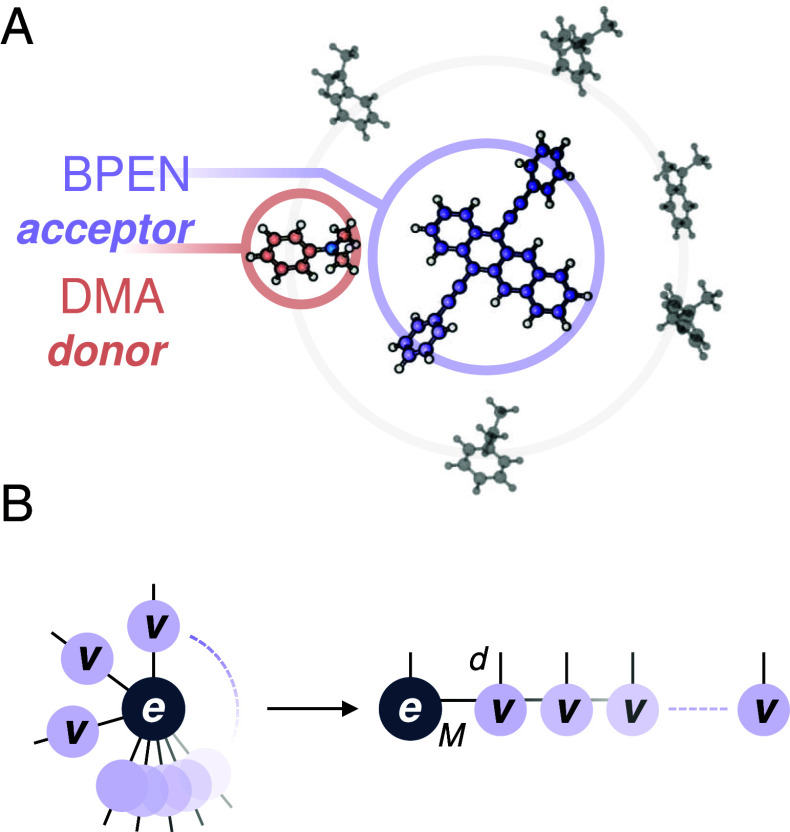
Broadband pump-probe spectroscopy has been widely used to measure vibrational decoherence associated with the reaction coordinate in photoinduced ultrafast vibration-coupled electron transfer (VCET) reactions. These experiments provide insight into the interplay of intramolecular coordinates along the reaction coordinate. However, a general theoretical foundation for analyzing, and even for explaining rigorously, these data is lacking. In this work, we study vibrational decoherence in a model VCET reaction using the nearly exact time-dependent density matrix renormalization group simulation method. We explore how analyzing the density matrix with quantum information measures can help elucidate the evolution of vibrational coherence in simulations of dynamics. We examine how vibrational coherence is affected by electron transfer on the timescale of approximately 100 femtoseconds. Our results suggest that electron transfer, in the nonadiabatic model, changes the vibrational equilibrium position abruptly-an example of a "quantum quench" event. This explains the concomitant vibrational decoherence. We find that abrupt vibrational decoherence can be mitigated by wavepacket motion occurring on the timescale of the electron transfer.

Keywords: electron transfer; pump–probe spectroscopy; quantum information; time-dependent density matrix renormalization group; vibrational decoherence.


Conflict of interest statement

Competing interests statement:The authors declare no competing interest.

Figures

Fig. 1.
Fig. 1.
(Panel A) indicates the VCET reaction system studied in this work. It consists of the electron acceptor BPEN (solute) and electron donor DMA (solvent). (Panel B) shows that the VCET reaction system in (A) is first simplified into an electron–vibrational coupled model (e: electronic DOF, v: vibrational DOF). Then, the matrix product state is used to describe the states of the system during the VCET reaction. The time evolution of this matrix product state will be simulated by the TD-DMRG method to study the dynamics of VCET. (M: virtual bond dimension of the matrix product state, d: physical bond dimension of the matrix product state.)
Fig. 2.
Fig. 2.
Schematic pictures showing the difference between vibrational coherence measured by probing reactant or product state. (A) By probing the reactant or product state, the vibrational properties of the subspace vibrational density matrix ρR=R|ρTot|R or ρP=P|ρTot|P is measured, (B). The “vibrational coherence” measured by probing the reactant or product state originates from the off-diagonal elements when ρR or ρP is further expanded on the corresponding reactant or product vibrational basis made up with the eigenstates of the subspace Hamiltonian H^R=R|H^|R or H^P=P|H^|P. With the vibration approximated as the quantum harmonic oscillator here, the two vibrational basis sets, denoted as {|a,|b,...} and {|α,|β,...} are simple harmonic oscillator functions centered at the reactant and product equilibrium position ΔQR and ΔQP. ρTot is the density matrix of total system including all electronic and vibrational DOFs. H^ is the total system Hamiltonian.
Fig. 3.
Fig. 3.
(Panel A) shows dynamics of the reactant state population: n^R (dashed lines) and the product state population: n^P (solid lines) within the first 100 fs of VCET. (Panel B) shows dynamics of the vibrational coherence C(ρ) evaluated through the quantum information measure (QIM), for the studied low frequency (ωL, red lines) and high frequency (ωh, gray lines) vibrations. It shows the vibrational coherence in the reactant state (solid lines, C(ρP)) and that in the product state (dashed lines, C(ρR)). (Panel C) shows the vibrational coherence of the total system: C(ρR) + C(ρP). The “Simulated” dash-dotted lines are the direct addition of two parts of vibrational coherence from simulation results shown in (B). The referenced “Approximated” dotted lines are approximated data under the impulsive ET approximation (IEA) as C(ρR)=C(ρR(t0))n^R and C(ρP)=C(ρP(t0))n^R. Unfilled/filled circles indicate used C(ρR,t0) and C(ρP,t0) for IEA, Downward and upward arrows are plotted to guide the expected vibrational decoherence resulting from the quantum quench if the electron transfer is extremely fast, and to illustrate the mitigation effect of wavepacket motion in the studied slow electron transfer process, respectively.
Fig. 4.
Fig. 4.
This figure shows the evolution of the expectation value of the position Q^ and the momentum P^ of the wavepacket associated with the reactant state (hot color trajectories) and the product state (cold color trajectories) during the first 100 fs of VCET. The wavepacket is represented by the subspace density matrices ρR and ρP. (A) The low-frequency vibration mode (ωL). (B) The high-frequency vibration modes (ωH). The light red and light blue circular trajectories are reference wavepacket trajectories initialized in the reactant and product states, respectively, for the no electron transfer case. The light red, light blue, and black crosses mark the vibrational equilibrium positions of the reactant, product, and ground states, respectively. The increasing size dots along the trajectories indicate the wavepacket phase space positions at 10, 20, 30, 40, and 50 fs. The density matrices ρR and ρP are normalized before evaluating their phase space trajectories.

References

    1. Rather S. R., Fu B., Kudisch B., Scholes G. D., Interplay of vibrational wavepackets during an ultrafast electron transfer reaction. Nat. Chem. 13, 70–76 (2021). - PubMed
    1. Yoneda Y., et al. , Vibrational dephasing along the reaction coordinate of an electron transfer reaction. J. Am. Chem. Soc. 143, 14511–14522 (2021). - PubMed
    1. Takeuchi E., et al. , Vibrational decoherence induced by ultrafast intramolecular charge separation of an asymmetric bianthryl derivative. J. Chem. Phys. 153, 084307 (2020). - PubMed
    1. Kim T., Lin C., Schultz J. D., Young R. M., Wasielewski M. R., π-stacking-dependent vibronic couplings drive excited-state dynamics in perylenediimide assemblies. J. Am. Chem. Soc. 144, 11386–11396 (2022). - PubMed
    1. Kim T., et al. , Coherent vibronic wavepackets show structure-directed charge flow in host-guest donor-acceptor complexes. J. Am. Chem. Soc. 145, 8389–8400 (2023). - PubMed

LinkOut - more resources