

Modulation of α-Synuclein Fibrillation and Toxicity by 4-Phenylbutyric Acid
- PMID: 40020199
- PMCID: PMC11926867
- DOI: 10.1021/acschemneuro.4c00709
Modulation of α-Synuclein Fibrillation and Toxicity by 4-Phenylbutyric Acid
Abstract
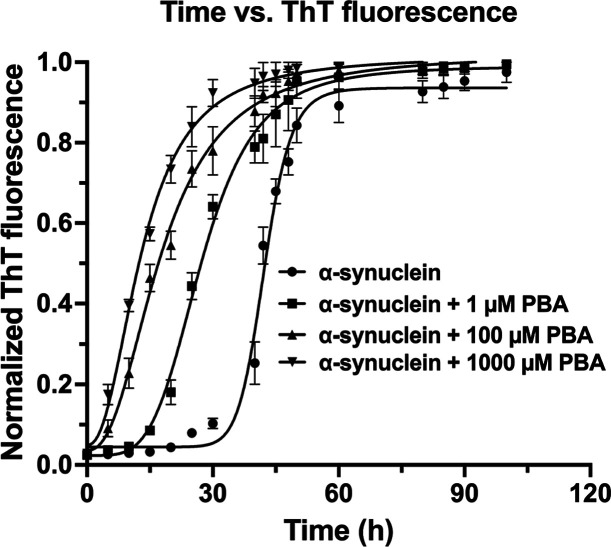
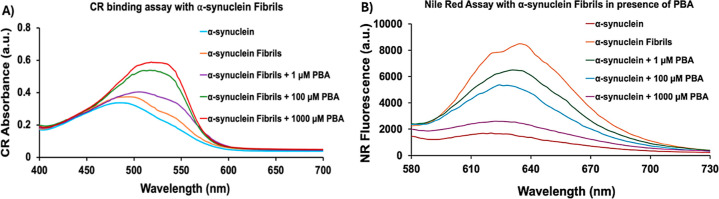
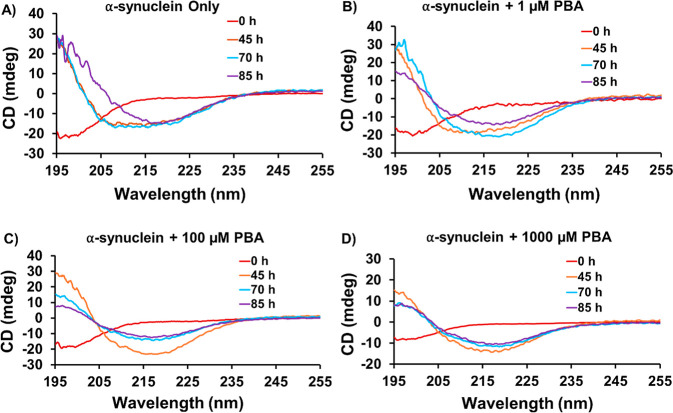
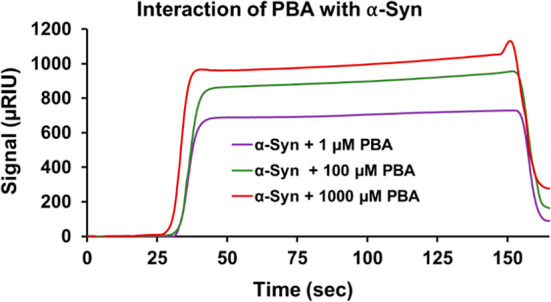
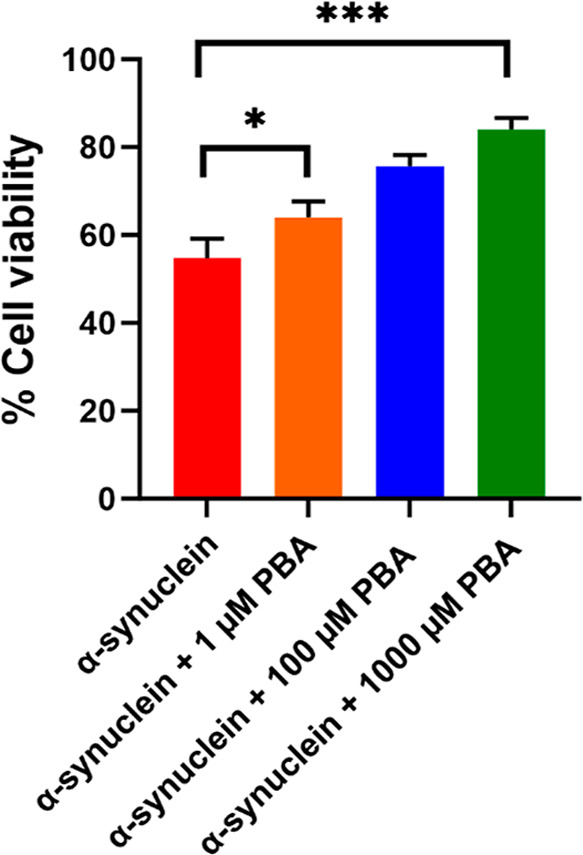
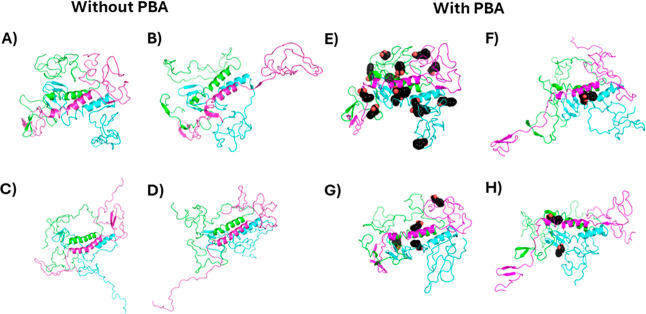
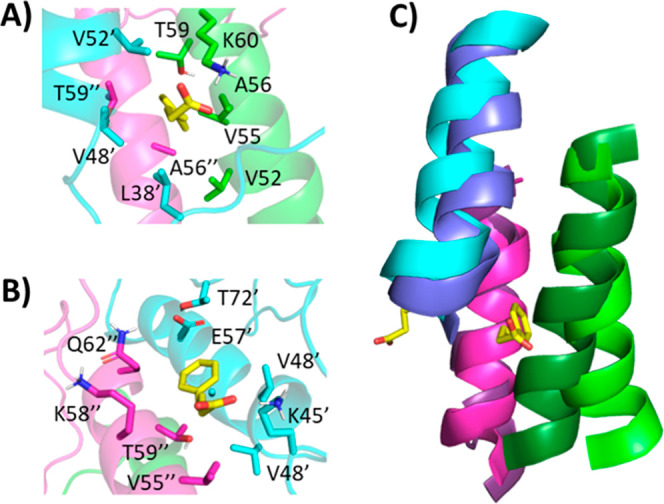
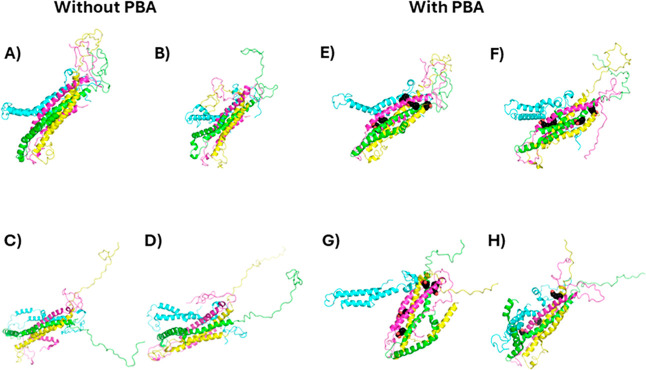
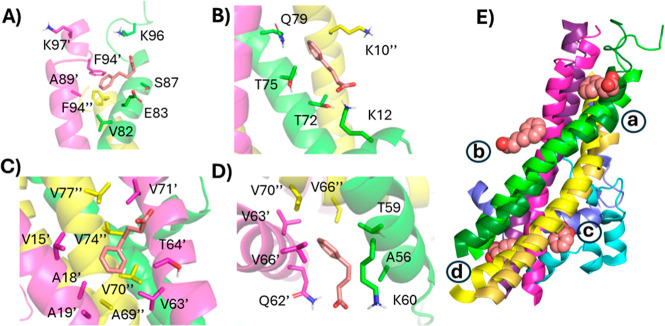
The protein misfolding and aggregation of α-synuclein (α-Syn) into neurotoxic amyloids underlies the pathogenesis of neurodegenerative diseases such as Parkinson's disease (PD). Emerging evidence suggests that 4-phenylbutyrate (PBA) may play a role as a potential chemical chaperone for targeting α-Syn aggregation, but its molecular mechanism remains largely unknown. Using in vitro assays, we demonstrate that PBA treatment alters the pattern of α-Syn aggregation, as evidenced by reduced formation of oligomeric species and its increased susceptibility to proteolytic cleavage under the influence of PBA. Proteinase K (PK) assays, surface plasmon resonance (SPR), Nile red assays, and cytotoxicity assays indicate that PBA interacts with the extensive hydrophobic contacts of α-Syn oligomers and significantly reduces α-Syn-amyloid-induced toxicity. Furthermore, using thioflavin T-based assays, we elucidated the kinetics of PBA-mediated modulation of α-Syn aggregation, highlighting its role in accelerating the formation of α-Syn amyloid fibrils. Molecular dynamics (MD) simulations suggest PBA's role in the destabilization of the C-terminus in α-Syn oligomers through multiple residue interactions. Collectively, our findings provide compelling evidence for the neuroprotective potential of PBA in targeting protein misfolding and aggregation in PD and suggest an avenue for disease-modifying interventions in neurodegenerative disorders.
Keywords: 4-phenylbutyric acid; amyloid protein; molecular dynamics simulations; oligomers; α-synuclein fibrillation.
Conflict of interest statement
The authors declare no competing financial interest.
Figures
Similar articles
-
Scutellarin inhibits the uninduced and metal-induced aggregation of α-Synuclein and disaggregates preformed fibrils: implications for Parkinson's disease.Biochem J. 2020 Feb 14;477(3):645-670. doi: 10.1042/BCJ20190705. Biochem J. 2020. PMID: 31939603
-
Complexation of NAC-Derived Peptide Ligands with the C-Terminus of α-Synuclein Accelerates Its Aggregation.Biochemistry. 2018 Feb 6;57(5):791-804. doi: 10.1021/acs.biochem.7b01090. Epub 2018 Jan 22. Biochemistry. 2018. PMID: 29286644
-
Co-aggregation of pro-inflammatory S100A9 with α-synuclein in Parkinson's disease: ex vivo and in vitro studies.J Neuroinflammation. 2018 Jun 4;15(1):172. doi: 10.1186/s12974-018-1210-9. J Neuroinflammation. 2018. PMID: 29866153 Free PMC article.
-
Small molecule-based fluorescent probes for the detection of α-Synuclein aggregation states.Bioorg Med Chem Lett. 2023 Apr 15;86:129257. doi: 10.1016/j.bmcl.2023.129257. Epub 2023 Mar 24. Bioorg Med Chem Lett. 2023. PMID: 36966976 Review.
-
Phase separation and other forms of α-Synuclein self-assemblies.Essays Biochem. 2022 Dec 16;66(7):987-1000. doi: 10.1042/EBC20220055. Essays Biochem. 2022. PMID: 36373662 Review.
References
-
- Vardy T. How to Avoid or Control Neurological Disorders. EC Neurol. 2020, 12 (5), 73–89.
-
- Gandhi J.; Antonelli A. C.; Afridi A.; Vatsia S.; Joshi G.; Romanov V.; Murray I. V. J.; Khan S. A. Protein misfolding and aggregation in neurodegenerative diseases: a review of pathogeneses, novel detection strategies, and potential therapeutics. Rev. Neurosci. 2019, 30, 339–358. 10.1515/revneuro-2016-0035. - DOI - PubMed
MeSH terms
Substances
Grants and funding
LinkOut - more resources
Full Text Sources
Miscellaneous
