Comparative Study
. 2025 Feb:9:e2400788.
doi: 10.1200/PO-24-00788. Epub 2025 Feb 28.

Challenging Conventional Diagnostic Methods by Comprehensive Molecular Diagnostics: A Nationwide Prospective Comparison in Children With ALL

Affiliations
Comparative Study

Challenging Conventional Diagnostic Methods by Comprehensive Molecular Diagnostics: A Nationwide Prospective Comparison in Children With ALL

Judith M Boer et al. JCO Precis Oncol. 2025 Feb.

Abstract

Purpose: Treatment stratification in ALL includes diverse (cyto)genetic aberrations, requiring diverse tests to yield conclusive data. We optimized the diagnostic workflow to detect all relevant aberrations with a limited number of tests in a clinically relevant time frame.

Methods: In 467 consecutive patients with ALL (0-20 years), we compared RNA sequencing (RNAseq), fluorescence in situ hybridization (FISH), reverse transcriptase polymerase chain reaction (RT-PCR), karyotyping, single-nucleotide polymorphism (SNP) array, and multiplex ligation-dependent probe amplification (MLPA) for technical success, concordance of results, and turnaround time.

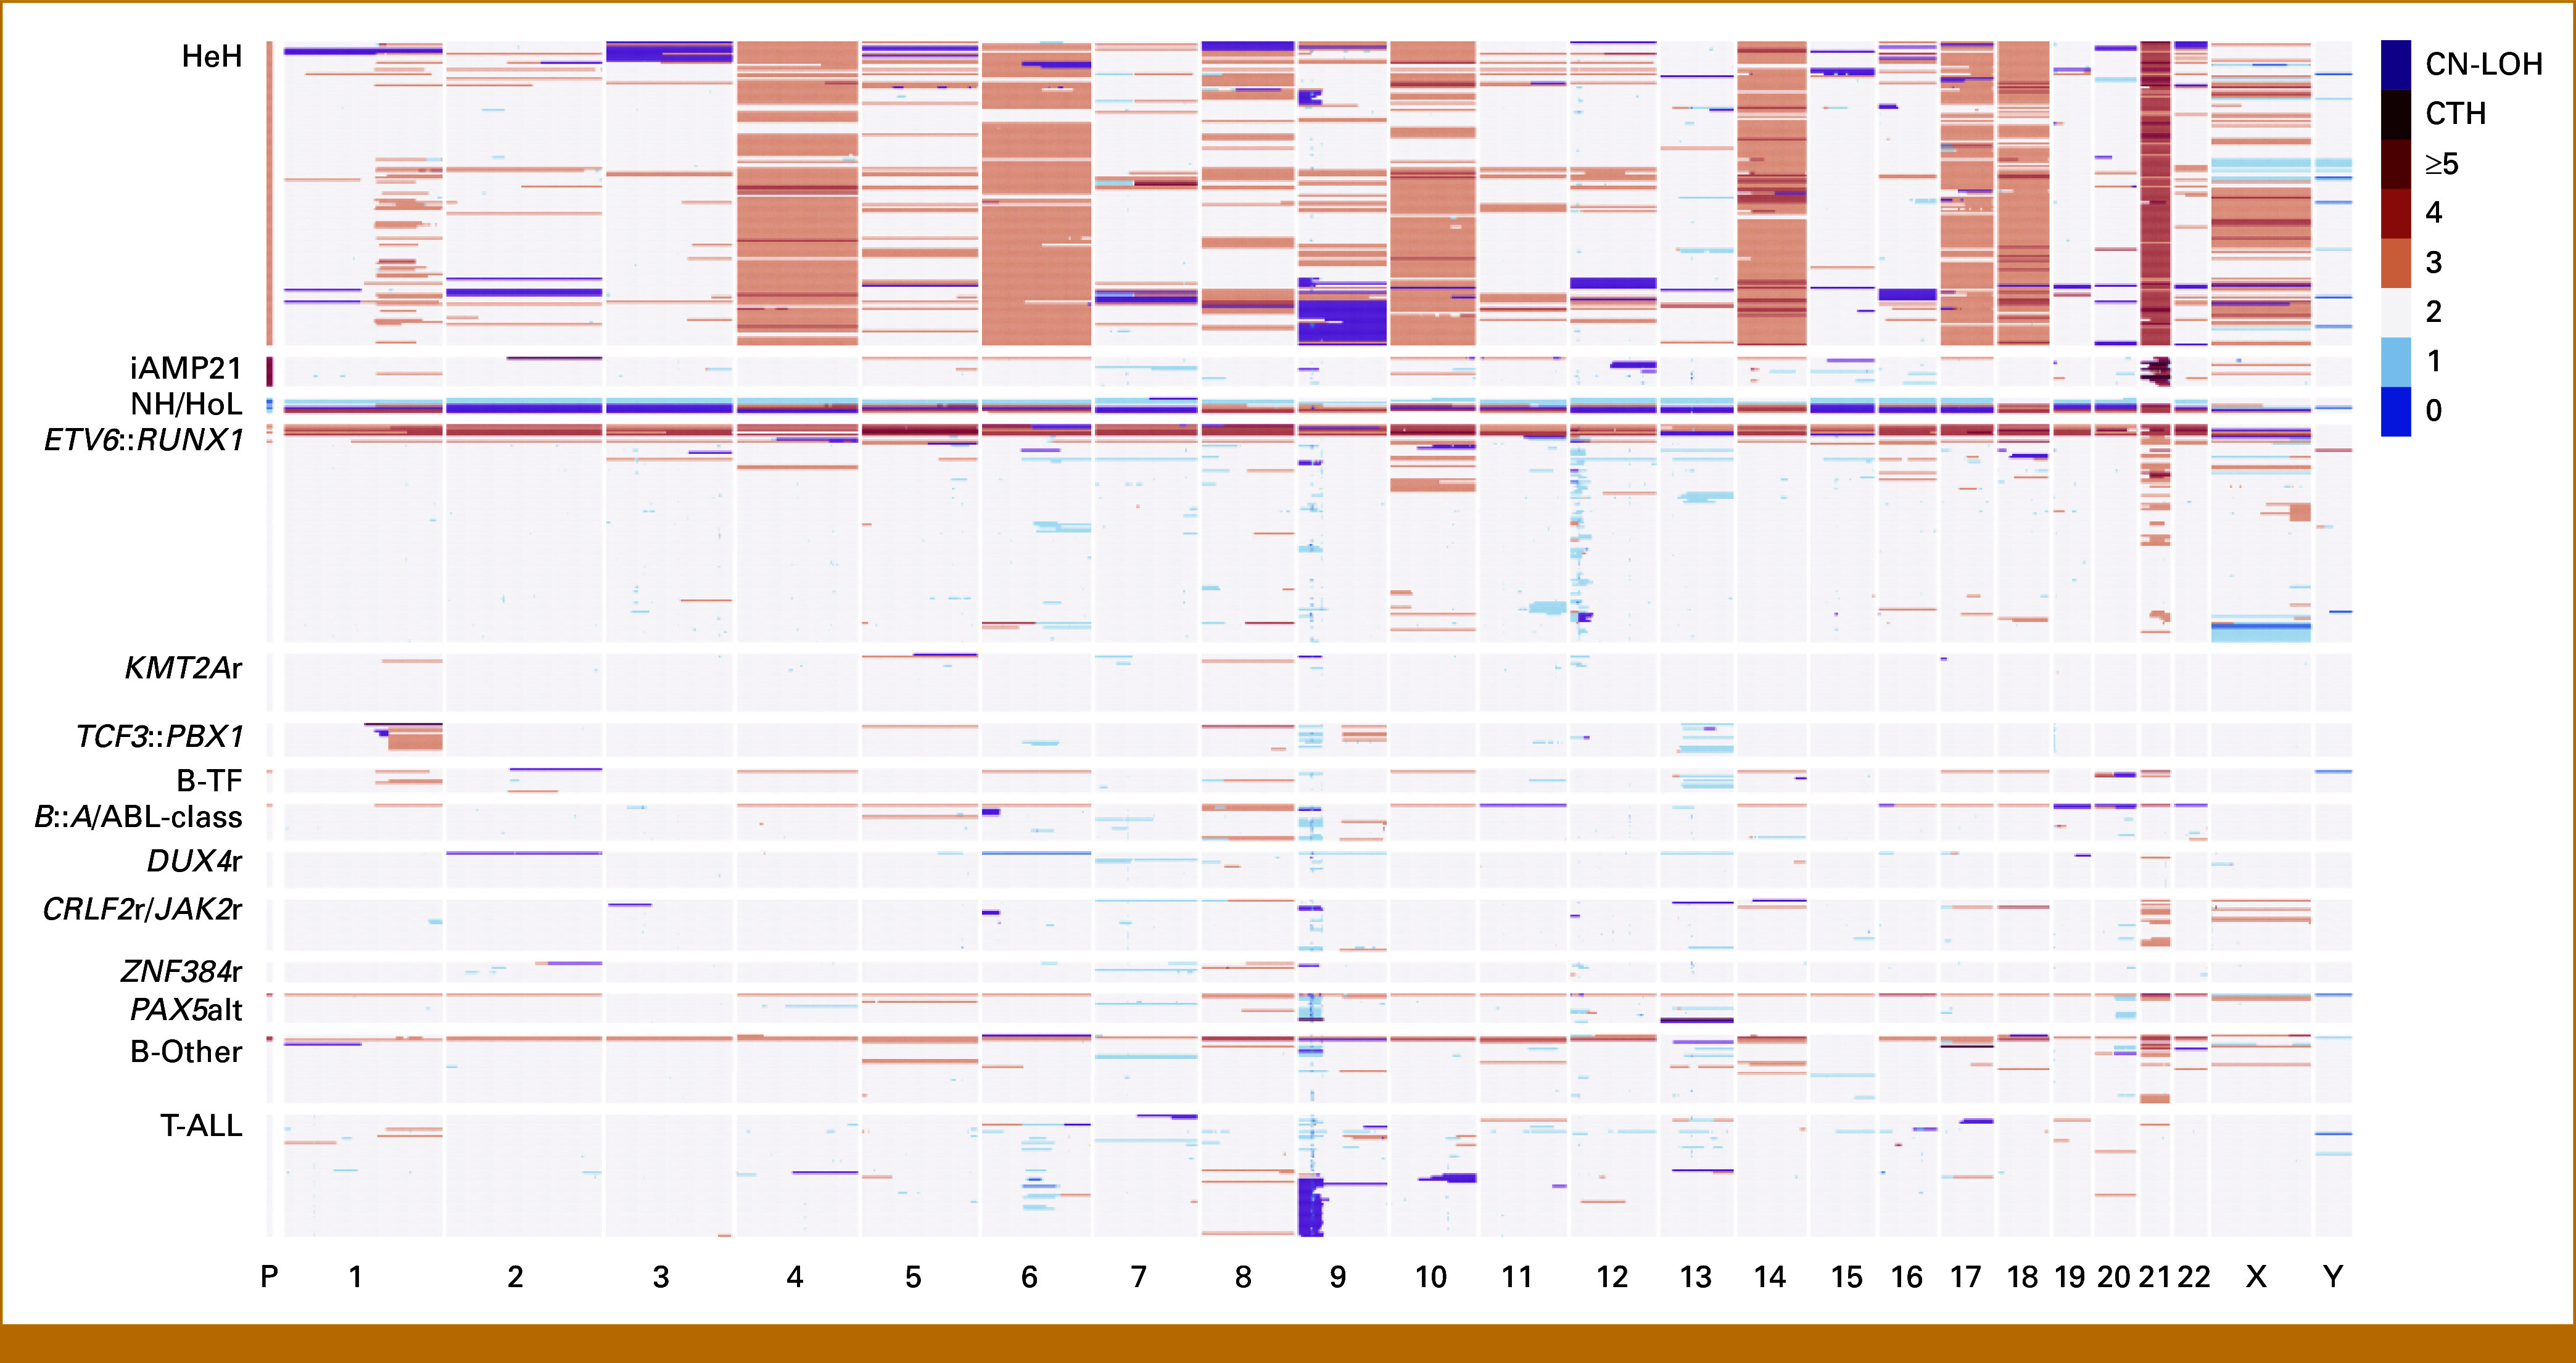
Results: To detect stratifying fusions (ETV6::RUNX1, BCR::ABL1, ABL-class, KMT2Ar, TCF3::HLF, IGH::MYC), RNAseq and FISH were conclusive for 97% and 96% of patients, respectively, with 99% concordance. RNAseq performed well in samples with a low leukemic cell percentage or low RNA quality. RT-PCR for six specific fusions was conclusive for >99% but false-negative for six patients with alternatively fused exons. RNAseq also detected gene fusions not yet used for stratification in 14% of B-cell precursor-ALL and 33% of T-ALL. For aneuploidies and intrachromosomal amplification of chromosome 21, SNP array gave a conclusive result in 99%, thereby outperforming karyotyping, which was conclusive for 64%. To identify deletions in eight stratifying genes/regions, SNP array was conclusive in 99% and MLPA in 95% of patients, with 98% concordance. The median turnaround times were 10 days for RNAseq, 9 days for FISH, 10 days for SNP array, and <7 days for MLPA and RT-PCR in this real-world prospective study.

Conclusion: Combining RNAseq and SNP array outperformed current diagnostic tools to detect all stratifying genetic aberrations in ALL. The turnaround time is <15 days matching major treatment decision time points. Moreover, combining RNAseq and SNP array has the advantage of detecting new lesions for studies on prognosis and pathobiology.


Conflict of interest statement

The following represents disclosure information provided by authors of this manuscript. All relationships are considered compensated unless otherwise noted. Relationships are self-held unless noted. I = Immediate Family Member, Inst = My Institution. Relationships may not relate to the subject matter of this manuscript. For more information about ASCO's conflict of interest policy, please refer to www.asco.org/rwc or ascopubs.org/po/author-center.

Open Payments is a public database containing information reported by companies about payments made to US-licensed physicians (Open Payments).

Figures

FIG 1.
FIG 1.
Cohort used for comparison: 467 newly diagnosed pediatric ALL. Metadata per patient sample is visualized in columns. Protocol includes DCOG-ALL11 (light blue), ALLTogether01 (mid-blue), EsPhALL (purple), and treated as Interfant06 (yellow). Lineage was BCP-ALL (dark green) or T-ALL (light green). Blast percentage was categorized as above 60% (green), between 20% and 60% (orange), and below 20% (red). The diagnostic assays applied were categorized as successful (light green), inconclusive (orange), not done (gray), or discontinued (white). BCP, B-cell precursor; CNA, copy number alteration; DCOG, Dutch Childhood Oncology Group; FISH, fluorescence in situ hybridization; iAMP21, intrachromosomal amplification of chromosome 21; MLPA, multiplex ligation-dependent probe amplification; RT-PCR, reverse transcription polymerase chain reaction; SNP, single-nucleotide polymorphism.
FIG 2.
FIG 2.
Chromosomal abnormalities in pediatric ALL cohort. Copy number data derived from SNP array per patient ordered by main subtype (rows) and 1-Mb bins per chromosome (columns). Color scale from blue to red represents zero to ≥five copies. Brown, CTH; purple, CN-LOH. The first column, labeled P, indicates the ploidy of the sample. B::A, BCR::ABL1; B-TF, BCP-ALL driven by transcription factor aberration; CN-LOH, copy-neutral loss of heterozygosity; CTH, chromothripsis; HeH, high hyperdiploid; HoL, low hypodiploid; iAMP21, intrachromosomal amplification of chromosome 21; NH, near-haploid; SNP, single-nucleotide polymorphism.
FIG 3.
FIG 3.
Frequencies of genetic aberrations across ALL subtypes. The frequency and type of pathogenic sequence variants, derived from RNA sequencing, and copy number alterations, derived from SNP array, are shown per ALL subtype. Subtypes were defined as follows: Kinase-driven including BCR::ABL1 and ABL-class fusions, CRLF2-rearranged and JAK-class fusions, iAMP21; transcription factor–driven including PAX5alt, ETV6::RUNX1, DUX4-rearranged, TCF3::PBX1, ZFN384-rearranged, KMT2A-rearranged, remaining BCP-ALL driven by a fusion or a pathogenic variant of a transcription factor (CEBP, MYC, PAX5, TCF3::HLF, MEF2D); aneuploidy-driven including high hyperdiploid, remaining aneuploid BCP-ALL (low hypodiploid, near-haploid); B-Other, including BCP-ALL without subtype-defining fusions or ploidy aberrations; T-ALL, including T-ALL except those with ABL-class fusion or KMT2A rearrangement, which were analyzed together with the corresponding BCP-ALL subtype. The number of cases per (combined) subtype is indicated above the heatmap. Genes are ordered according to the total number of genetic aberrations detected across the total cohort and included if mutated or deleted in >1% of the cases. For genes included in the screen, see the Data Supplement (Table S1). Left panel: Heatmap with genes on the rows and subtypes on the columns showing the percentage of affected samples per subtype. Right panel: Percentage of samples with alterations in each gene, with the alteration type indicated by color. If more than one alteration was present, the alteration highest in the legend list is included. BCP, B-cell precursor; iAMP21, intrachromosomal amplification of chromosome 21; SNP, single-nucleotide polymorphism.
FIG 4.
FIG 4.
Summary of diagnostic results and optimal assay use. Upper panel: Diagnostic yield and concordance for the detection of gene fusions, ploidy aberrations, and eight-gene/region copy number risk using different diagnostic methods. Colors of gene fusions: dark blue, stratifying fusion; light blue, other subtype-defining fusion; green, other fusion; gray, no fusion; pink, assay failed or not done. Colors of ploidy aberrations: dark green, HeH; orange, NH/HoL, red, iAMP21; gray, no stratifying ploidy aberration; pink, assay failed or noninformative or not done. Colors of eight-gene/region copy number risk: dark green, good risk; orange, poor risk; pink, assay failed or not done. Lower panel: turnaround time of the diagnostic methods in days, median (range); recommended leukemic cell percentage; optimal assay use implemented in our current diagnostic workflow with routine use of RNAseq and SNP array combined with selective use of FISH and RT-PCR. FISH, fluorescence in situ hybridization; HeH, high hyperdiploid; iAMP21, intrachromosomal amplification of chromosome 21; MLPA, multiplex ligation-dependent probe amplification; NH/HoL, near-haploid or low hypodiploid; nucFISH, nuclear FISH; RNAseq, RNA sequencing; RT-PCR, reverse transcription polymerase chain reaction; SNP, single-nucleotide polymorphism.

References

    1. Arber DA, Orazi A, Hasserjian RP, et al. : International Consensus Classification of Myeloid Neoplasms and Acute Leukemias: Integrating morphologic, clinical, and genomic data. Blood 140:1200-1228, 2022 - PMC - PubMed
    1. Biondi A, Gandemer V, De Lorenzo P, et al. : Imatinib treatment of paediatric Philadelphia chromosome-positive acute lymphoblastic leukaemia (EsPhALL2010): A prospective, intergroup, open-label, single-arm clinical trial. Lancet Haematol 5:e641-e652, 2018 - PubMed
    1. Schultz K, Carroll A, Heerema N, et al. : Long-term follow-up of imatinib in pediatric Philadelphia chromosome-positive acute lymphoblastic leukemia: Children's Oncology Group study AALL0031. Leukemia 28:1467-1471, 2014 - PMC - PubMed
    1. Pieters R, de Groot-Kruseman H, Fiocco M, et al. : Improved outcome for ALL by prolonging therapy for IKZF1 deletion and decreasing therapy for other risk groups. J Clin Oncol 41:4130-4142, 2023 - PubMed
    1. Pieters R, de Groot-Kruseman H, Van der Velden V, et al. : Successful therapy reduction and intensification for childhood acute lymphoblastic leukemia based on minimal residual disease monitoring: Study ALL10 from the Dutch Childhood Oncology Group. J Clin Oncol 34:2591-2601, 2016 - PubMed

Publication types

LinkOut - more resources