. 2025 Mar 11;20(3):102422.
doi: 10.1016/j.stemcr.2025.102422. Epub 2025 Feb 27.

Cardiac differentiation roadmap for analysis of plasticity and balanced lineage commitment

Affiliations

Cardiac differentiation roadmap for analysis of plasticity and balanced lineage commitment

Rebecca R Snabel et al. Stem Cell Reports. .

Abstract

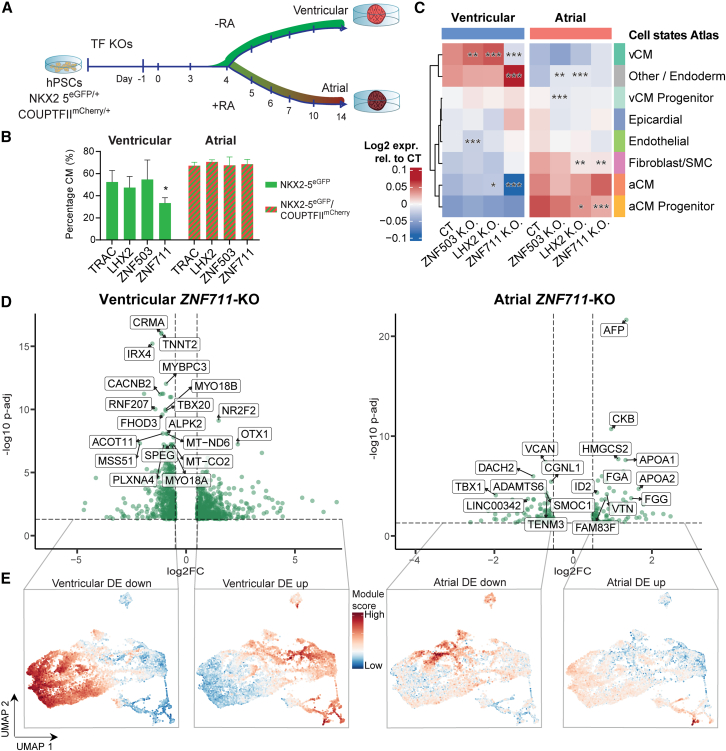
Stem cell-based models of human heart tissue and cardiac differentiation employ monolayer and 3D organoid cultures with different properties, cell type composition, and maturity. Here we show how cardiac monolayer, embryoid body, and engineered heart tissue trajectories compare in a single-cell roadmap of atrial and ventricular differentiation conditions. Using a multiomic approach and gene-regulatory network inference, we identified regulators of the epicardial, atrial, and ventricular cardiomyocyte lineages. We identified ZNF711 as a regulatory switch and safeguard for cardiomyocyte commitment. We show that ZNF711 ablation prevents cardiomyocyte differentiation in the absence of retinoic acid, causing progenitors to be diverted more prominently to epicardial and other lineages. Retinoic acid rescues this shift in lineage commitment and promotes atrial cardiomyocyte differentiation by regulation of shared and complementary target genes, showing interplay between ZNF711 and retinoic acid in cardiac lineage commitment.

Keywords: ZNF711; cardiac lineage commitment; epicardial cells; gene-regulatory networks; heart fields; human pluripotent stem cells; retinoic acid; single-cell multiomics.


Conflict of interest statement

Declaration of interests R.P. is a cofounder of Pluriomics (Ncardia) and River BioMedics BV.

Figures

None
Graphical abstract
Figure 1
Figure 1
Single-cell atlas of human cardiac differentiation in monolayer, embryoid body, and engineered heart tissue cultures (A) Schematic representation of the hPSC-derived cardiomyocyte (CM) differentiation cultures. hPSCs were differentiated in monolayer (Mon) or embryoid body (EB) cultures over the course of 14 days. At day 14, sorted CMs and non-CMs were replated in engineered heart tissues (EHTs) or replated as monolayers for comparison of the 3D culture (indicated with stars), while the EBs were kept in culture until day 21 (see Figure S1 for a detailed overview). RA, retinoic acid; d1–d21, day 1–21; m5–m12, day 5–12 in maturation medium (day 14–26; EHT and monolayer only). This single-cell atlas is based on four independent multi-well differentiation experiments, with each culture protocol (Mon, EB, and EHT) and culture condition (+/− RA) covered by at least two independent experiments. In one experiment all protocols and conditions were sampled in parallel (see methods). Cell states were highly consistent between experiments and time points (Figure S2F). (B) Immunohistochemistry of atrial (COUP-TFII/NR2F2), ventricular (MYL2), and general CM (cTnT and ACTN2) marker genes in day 14 vCM (top row) and aCM (retinoic acid treated; bottom row) culture conditions. Scale bar, 10 (COUP-TFII/cTnT) and 20 μm. (C) Single-cell temporal atlas Uniform Manifold Approximation and Projection (UMAP) labeled with culture conditions (left) and harvest time point (right). (D) Proportions of the different cell states per culture method. Cell states annotation process is shown in Figures S3 and S4. (E–G) Cell type marker expression levels visualized onto the atlas UMAP, with WT1 as epicardial, FBN1 as fibroblast, and TAGLN2 as smooth muscle marker. (H and I) Inversely related expression patterns of TNNT2 (F) and COL3A1 (G) visualized onto the atlas UMAP.
Figure 2
Figure 2
Trajectories of cardiac progenitor differentiation in EB and monolayer cultures UMAP representations of early time point (day 4 to day 14) subsets of the atlas per culture protocol (top, middle, and bottom row representing, respectively, the vCM-mon, vCM EB, and aCM EB protocols). (A–C) UMAPs labeled with time points (d4–d14, days of differentiation). For experimental design and replicates, see Figures 1 and S1 and methods. (D–F) UMAPs labeled with cell states (cf. Figures 1D and S3B). (G–L) (G–I) and (J–L) UMAPs with the expression values of, respectively, COL3A1 and TNNT2. (M–R) UMAPs with the expression values of the SHF marker ISL1 (M), pre-epicardial genes HAND1 (N), BCN2 (O), and NKX2-5 (P) and epicardial markers WT1 (Q) and ITGA8 (R). Arrows (D–R) show cell state dynamics predicted by RNA velocity (see methods). Discontinuities visible in the EB UMAPs indicate an early lineage separation of the endothelial and “other” lineage present in the cultures. Atrial EBs show an additional separation directly after day 5 where the cells were treated with retinoic acid, which causes a rapid and relatively large change in gene expression.
Figure 3
Figure 3
Transcription factor analysis in the EB atlas subset (A) Overview of the approach to select transcription factors (TFs) of interest in the +RA/non-RA-treated EBs. Differentially expressed TFs were determined over time across the aCM- and vCM-committed cell clusters in the EB subset of the atlas from two independent differentiations. Multiome analysis (snRNA-seq and snATAC-seq from the same nuclei) of day 8 +RA/non-RA-treated EB cultures was used to generate cell type-specific gene-regulatory networks (GRNs). The combination of these approaches identified potential knockout candidates. (B and C) UMAP representation of the EB subset of the atlas. Cells labeled according to lineage (B) and harvest time point (C) with n = 2 for day 4, 5, 8, and 14, from separate differentiation experiments. (D) UMAP with cluster labels. Circles indicate the clusters used in differential gene analysis between the aCM and vCM trajectories over time. Comparisons were performed between cluster 24 and 6, cluster 14 and 0, cluster 9 and 4, and cluster 2 and 23. (E) Differentially expressed genes between early and late CM clusters, outlined in (D), across the two lineages within the EB subset. (F–H) Hits of interest from (E), ZNF711 (F), ZNF503 (G), and LHX2 (H) with their expression levels onto the EB subset UMAP. (I) Average expression levels over time per gene set found differentially upregulated in atrial versus ventricular culture, subdivided into an early RA-responsive (left), a long-term RA-responsive (middle), and late RA-responsive subset (right) (see methods; gene lists in Table S2). d, day of culture; d4 is shared between the lineages; d5, the first day after RA treatment in the atrial culture; SE, standard error.
Figure 4
Figure 4
Identification of candidate transcriptional regulators with multiome data (A) UMAP representation of multiome data from day 8 EBs directed to the atrial and ventricular lineage. Dimensionality reduction and clustering were performed on the scRNA-seq fraction. (B) Scaled marker gene expression levels over the different cell states. End, endothelial; Epi, Epicardial. (C) Cluster pseudobulk scATAC-seq signals, zoomed in on three different loci in Genome Browser view, where a differentially accessible (DA) peak was found enriched in the atrial (top), ventricular (middle), or epicardial (bottom) cluster, between the MEIS3 and SLC8A2 gene (top), INKA2 and DDX20 gene (middle), and within the ABCA7 gene (bottom). The gray box highlights the 200 bp peak, differential in signal across the clusters. Black boxes within the genes indicate exons. (D) Motif enrichment as identified by Maelstrom analysis on the DA peaks (Table S1) clustered on accessibility signal (Figure S6D). Full Maelstrom analysis results are shown in Table S2. Left heatmap shows expression levels of binding TFs, and right heatmap shows the linked motif activity as inferred with motif analysis. (E) Differential network of the vCM over the aCM cluster, as predicted by scANANSE. Top 20 most influential transcriptional regulators (red) and 7 markers of interest (blue) are shown. (F) Differential network of the aCM over the vCM cluster, as predicted by scANANSE. Top 20 most influential regulators (red) and the same targets (blue) as in (E) are shown. Nodes in the network are filtered for temporal expression, showing the early RA responding gene RARB and the connections to its targets (left) and the long-term RA responding genes and their target interactions (right). Highlighted nodes indicate presence of these regulators in an RA-responsive subset (Figure 3I and Table S2). (G) Subset of the aCM network for ZNF711, with selected upstream factors from the aCM differential network (red) and targets of interest downstream of ZNF711 (blue).
Figure 5
Figure 5
Knockout experiments for LHX2, ZNF711, and ZNF503 (A) Experimental setup for the transcription factor (TF) knockout (KO) experiments. hPSCs with the TRAC (control), ZNF711, ZNF503, or LHX2 knockout (TF KOs) were differentiated toward aCM- and vCM-EBs (+/− RA, respectively). At day 14 of differentiation, EBs were collected for subsequent analysis. (B) Percentages of CMs per KO measured in cells positive for the CM reporters NKX2-5 in ventricular (non-RA-treated) and NKX2-5 and NR2F2 in atrial (+RA-treated) cultures at day 14. TRAC-KO is the gene CRISPR control. Data are mean ± SEM; ordinary two-way ANOVA with Tukey’s multiple comparisons test; ∗∗p-adjusted < 0.001, vs. TRAC (n = 3 independent differentiations per culture protocol and KO target). (C) Averaged cell lineage expression scores within the ZNF503, LHX2-KO, ZNF711-KO, and TRAC control relative to the average of the TRAC controls from both lineages. Expression scores were based on the top 200 marker genes per cell type (day 14 EB, Table S3). Relative expression scores can be compared between ventricular (left) and atrial (right) panels. Within each panel, scores should be compared to its own control (CT) of the same panel. Significance was calculated over the averaged expression levels across 200 genes and per matched replicate and control. Stars indicate significance of the highest p value found among the replicates of a condition (see methods; p-adjusted < 0.05, ∗∗p-adjusted < 0.001, and ∗∗∗p-adjusted < 0.0001). (D) Volcano plot of the differentially expressed (DE) genes of the ZNF711-KO cells cultured toward vCMs (non-RA, left) and aCMs (+RA, right) (adjusted p value < 0.05). Text labels show top hits with the lowest adjusted p value. Vertical dotted line indicates |log2FC| > 0.5, and horizontal dotted line indicates |−log10p value| < 0.05. (E) The in vitro atlas (Figure 1) labeled with compound gene expression levels (module scores) based on the gene groups from left to right: non-RA down- (log2FC < 0), non-RA up- (log2FC > 0), +RA down-, and +RA upregulated genes, based on significance (p-adjusted < 0.05) upon ZNF711-KO. CT, control; aCM, atrial; vCM, ventricular; RA, retinoic acid; DE, differentially expressed; log2FC, log2 (expression fold change between KO and CT).
Figure 6
Figure 6
Enrichment for ZNF711 targets in the scANANSE networks and proposed model (A) Enrichment of ANANSE-predicted network targets among differentially expressed genes in ZNF711-KO cardiac EBs. Bubble size represents fold enrichment, and the x axis shows multiple-testing corrected hypergeometric test p values. Indicated on the left is the regulator (ZNF711 and RARB) for which the predicted targets were selected from each of the cell type-specific scANANSE networks. On the right, conditions are indicated from which ZNF711-KO differential genes were selected, non-RA (ventricular) or +RA (atrial). The dashed line visualizes the p-adjusted value of 0.05. This figure represents a subset of all comparisons (cf. Figure S9 and Table S4 for all comparisons). (B) Violin plots show overlap (Jaccard Index) between cell type-specific ANANSE-predicted targets of ZNF711 and RARB and other transcription factors (violin plots). The black diamonds indicate fold enrichment of overlap between ZNF711 and RARB targets for each of the networks. Full table is given in Table S4. (C) Model of gene regulation (signified by the gray arrows) for balanced lineage commitment of progenitors to epicardial cells and atrial and ventricular CMs (thick colored arrows) by concerted action of ZNF711, LHX2, and RA. ZNF711 regulates important genes shared between the aCM and vCM lineage (purple-red star), which are dysregulated upon knockout of this factor. Treatment with RA rescues the effect of ZNF711 in the atrial conditions, explained by a significant overlap in target genes between the two (arrow of RA to purple-red star). Red star signifies the genes promoting aCM identity. RA also regulates genes that promote an epicardial fate (blue star). LHX2 appears to co-regulate both ZNF711 and RA-regulated genes (cf. Figure S9B) but does not act redundantly with RA. Rather, the defects in gene expression are mostly observed in presence of RA (Table S2).

References

    1. Ameen M., Sundaram L., Shen M., Banerjee A., Kundu S., Nair S., Shcherbina A., Gu M., Wilson K.D., Varadarajan A., et al. Integrative single-cell analysis of cardiogenesis identifies developmental trajectories and non-coding mutations in congenital heart disease. Cell. 2022;185:4937–4953.e23. doi: 10.1016/J.CELL.2022.11.028. - DOI - PMC - PubMed
    1. Ang L.T., Tan A.K.Y., Autio M.I., Goh S.H., Choo S.H., Lee K.L., Tan J., Pan B., Lee J.J.H., Lum J.J., et al. A Roadmap for Human Liver Differentiation from Pluripotent Stem Cells. Cell Rep. 2018;22:2190–2205. doi: 10.1016/j.celrep.2018.01.087. - DOI - PMC - PubMed
    1. Asp M. Developmental heart - filtered and unfiltered count matrices and meta tables. Mendeley Data Version. 2021;2 doi: 10.17632/MBVHHF8M62.2. - DOI
    1. Asp M., Giacomello S., Larsson L., Wu C., Fürth D., Qian X., Wärdell E., Custodio J., Reimegård J., Salmén F., et al. A Spatiotemporal Organ-Wide Gene Expression and Cell Atlas of the Developing Human Heart. Cell. 2019;179:1647–1660.e19. doi: 10.1016/j.cell.2019.11.025. - DOI - PubMed
    1. Bergen V., Lange M., Peidli S., Wolf F.A., Theis F.J. Generalizing RNA velocity to transient cell states through dynamical modeling. Nat. Biotechnol. 2020;38:1408–1414. doi: 10.1038/s41587-020-0591-3. - DOI - PubMed

Publication types

LinkOut - more resources