. 2025 Feb 28;8(5):e202402991.
doi: 10.26508/lsa.202402991. Print 2025 May.

Metabolic dysregulation contributes to the development of dysferlinopathy

Affiliations

Metabolic dysregulation contributes to the development of dysferlinopathy

Regula Furrer et al. Life Sci Alliance. .

Abstract

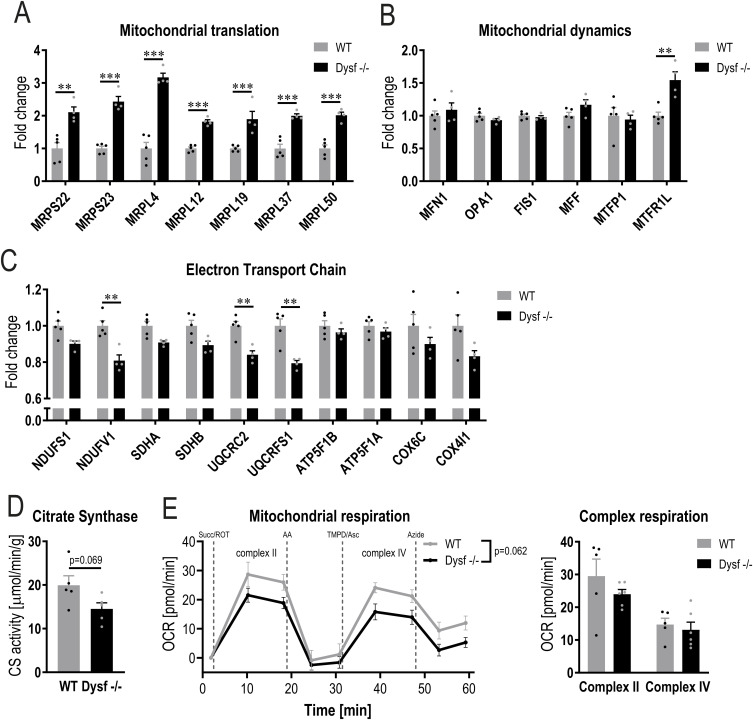
Dysferlin is a transmembrane protein that plays a prominent role in membrane repair of damaged muscle fibers. Accordingly, mutations in the dysferlin gene cause progressive muscular dystrophies, collectively referred to as dysferlinopathies for which no effective treatment exists. Unexpectedly, experimental approaches that successfully restore membrane repair fail to prevent a dystrophic phenotype, suggesting that additional, hitherto unknown dysferlin-dependent functions contribute to the development of the pathology. Our experiments revealed an altered metabolic phenotype in dysferlin-deficient muscles, characterized by (1) mitochondrial abnormalities and elevated death signaling and (2) increased glucose uptake, reduced glycolytic protein levels, and pronounced glycogen accumulation. Strikingly, elevating mitochondrial volume density and muscle glycogen accelerates disease progression; whereas, improvement of mitochondrial function and recruitment of muscle glycogen with exercise ameliorated functional parameters in a mouse model of dysferlinopathy. Collectively, our results not only shed light on a metabolic function of dysferlin but also imply new therapeutic avenues aimed at promoting mitochondrial function and normalizing muscle glycogen to ameliorate dysferlinopathies, complementing efforts that target membrane repair.


Conflict of interest statement

The authors declare that they have no conflict of interest.

Figures

None
Graphical abstract
Figure S1.
Figure S1.. PGC-1α overexpression in muscle exacerbate functional impairment in dysferlinopathy.
(A) PGC-1α mRNA expression in quadriceps muscle of 11 mo old mice (expressed relative to WT). (B, C) Trajectories of muscle mass of the proximal gluteus muscle (A) and the distal soleus and tibialis anterios (TA) muscles (B). (D) In vivo measurements at the age of 6 and 10 mo. (E) Gait analysis using CatWalk at the age of 10 mo. (B) Data information: data represent means ± SEM. For panel (B), data are included from WT 4 mo n = 7, WT 7 mo n = 5, WT 11 mo n = 6, WT 15 mo n = 8, Dysf −/− 4 mo n = 7, Dysf −/− 7 mo n = 7, Dysf −/− 11 mo n = 10, Dysf −/− 15 mo n = 8, Dysf −/− PGC-1α 4 mo n = 6, Dysf −/− PGC-1α 7 mo n = 7, Dysf −/− PGC-1α 11 mo n = 9, Dysf −/− PGC-1α 15 mo n = 8. For panel (C) (both soleus and TA), data are included from WT 4 mo n = 7, WT 7 mo n = 8, WT 11 mo n = 14, WT 15 mo n = 8, Dysf −/− 4 mo n = 7, Dysf −/− 7 mo n = 5, Dysf −/− 11 mo n = 16, Dysf −/− 15 mo n = 8, Dysf −/− PGC-1α 4 mo n = 6, Dysf −/− PGC-1α 7 mo n = 6, Dysf −/− PGC-1α 11 mo n = 16, Dysf −/− PGC-1α 15 mo n = 8. (A, B, C, D, E) Asterisks indicate differences between the different genotypes of the same age using a one-way ANOVA or two-way ANOVA followed by a Tukey’s multiple comparisons test (the different color of the asterisks in panels (B, C) indicate the comparison group); *P < 0.05; **P < 0.01; ***P < 0.001.
Figure 1.
Figure 1.. PGC-1α overexpression in muscle exacerbates the progression of dysferlinopathy.
(A) Creatine kinase levels in plasma at different ages in WT mice, mice lacking dysferlin (Dysf −/−) and Dysf −/− mice overexpressing PGC-1α in muscle (Dysf −/− PGC-1α). (B, C) Trajectories of the mass of proximal muscles (B) and the distal muscle extensor digitorum longus (EDL) in panel (C). (D) Number of Evans blue-positive fibers in the rectus femoris of 11 mo old mice. (E) Representative examples of histological sections of rectus femoris muscle of 11 mo old mice that were injected with Evans blue dye. (F) Representative examples of H&E or Oil Red O stained sections of rectus femoris muscle of 11 mo old mice. Data information: data represent means ± SEM; scale bars = 200 μm. For panel (A), data are included from WT 4 mo n = 6, WT 7 mo n = 12, WT 11 mo n = 11, WT 15 mo n = 7, Dysf −/− 4 mo n = 7, Dysf −/− 7 mo n = 12, Dysf −/− 11 mo n = 12, Dysf −/− 15 mo n = 8, Dysf −/− PGC-1α 4 mo n = 6, Dysf −/− PGC-1α 7 mo n = 13, Dysf −/− PGC-1α 11 mo n = 16, Dysf −/− PGC-1α 15 mo n = 8. (B) For the psoas muscle in panel (B), data are included from WT 4 mo n = 7, WT 7 mo n = 5, WT 11 mo n = 6, WT 15 mo n = 8, Dysf −/− 4 mo n = 7, Dysf −/− 7 mo n = 7, Dysf −/− 11 mo n = 10, Dysf −/− 15 mo n = 8, Dysf −/− PGC-1α 4 mo n = 6, Dysf −/− PGC-1α 7 mo n = 7, Dysf −/− PGC-1α 11 mo n = 9, Dysf −/− PGC-1α 15 mo n = 8. For the quadriceps muscle in panel (B), data are included from WT 4 mo n = 7, WT 7 mo n = 13, WT 11 mo n = 14, WT 15 mo n = 8, Dysf −/− 4 mo n = 7, Dysf −/− 7 mo n = 12, Dysf −/− 11 mo n = 16, Dysf −/− 15 mo n = 8, Dysf −/− PGC-1α 4 mo n = 6, Dysf −/− PGC-1α 7 mo n = 13, Dysf −/− PGC-1α 11 mo n = 16, Dysf −/− PGC-1α 15 mo n = 8. For panel (C), data are included from WT 4 mo n = 7, WT 7 mo n = 8, WT 11 mo n = 14, WT 15 mo n = 8, Dysf −/− 4 mo n = 7, Dysf −/− 7 mo n = 5, Dysf −/− 11 mo n = 16, Dysf −/− 15 mo n = 8, Dysf −/− PGC-1α 4 mo n = 6, Dysf −/− PGC-1α 7 mo n = 6, Dysf −/− PGC-1α 11 mo n = 16, Dysf −/− PGC-1α 15 mo n = 8. (A, B, C, D) Asterisks indicate differences between the genotypes of the same age using two-way ANOVA with Šídák’s multiple comparisons test when comparing two groups and Tukey’s multiple comparisons test when comparing three groups (the different color of the asterisks in panels (A, B, C) indicate the comparison group); *P < 0.05; **P < 0.01; ***P < 0.001.
Figure S2.
Figure S2.. Substantial changes in dysferlin-deficient muscles proteome.
(A) Volcano plot of all proteins of quadriceps muscle of 11 mo old Dysf −/− or PGC-1α mTG mice compared with WT controls (cutoffs: peptide >1). (B) Functional annotation clusters of all up-regulated (orange) or down-regulated (blue) proteins in Dysf −/− or PGC-1α mTG muscle compared with WT controls using DAVID (Database for Annotation, Visualization, and Integrated Discovery) using the following cutoffs: peptide >1, q-value < 0.01 and log2FC ±0.2. For the proteomic analysis, n = 4–5 biological replicates. Empirical Bayes moderated t-statistics was used to analyze proteomic data.
Figure 2.
Figure 2.. Mitochondrial abnormalities and elevated death signaling in dysferlin-deficient muscles.
(A) Venn diagram of all proteins that are significantly higher or lower abundant in quadriceps muscle of 11 mo old Dysf −/− or PGC-1α mTG mice compared with WT controls (cutoffs: peptide >1; q-value < 0.01; Log2FC ±0.2). (B) Functional annotation clusters of all commonly up-regulated (orange) or down-regulated (blue) proteins using DAVID (Database for Annotation, Visualization and Integrated Discovery). (C) Representative electron microscopy (EM) images of quadriceps muscle of 11 mo old mice. (D) Quantification of the EM pictures assessing mitochondrial volume density, number, and size. (E) Distribution of small (<0.5 μm2) and large (>0.5 μm2) mitochondria and a more detailed distribution of mitochondria <0.5 μm2. (F) Relative protein abundance (from proteomic data) of enzymes involved in TCA cycle expressed relative to WT levels. (G) Relative protein abundance (from proteomic data) of the mitochondrial Ca2+ uniporter (MCU). (H) Western blot of cyclic GMP-AMP (cGAMP) synthase (cGAS)—stimulator of interferon genes (STING) pathway and the downstream target TANK-binding kinase 1 (TBK1). M represents the protein ladder (marker). The Ponceau S-stained membrane that serves as loading control is presented in Fig S5E. Data information: for the proteomic analysis, n = 4–5 biological replicates. Data represent means ± SEM. (A, D, E, F, G) Empirical Bayes moderated t-statistics was used to analyze proteomic data, two-tailed t test for panel (D), and two-way repeated measures ANOVA for panel (E); *P < 0.05; **P < 0.01; ***P < 0.001 (for panel (F, G), asterisks represent q-values). CS, citrate synthase; ACO2, aconitase 2; IDH3G, isocitrate dehydrogenase (NAD) subunit γ; DLD, dihydrolipoamide dehydrogenase; SUCLG2, succinyl-CoA ligase (GDP-forming) subunit β; FH, fumarate hydratase; MDH1, malate dehydrogenase 1.
Figure S3.
Figure S3.. Mitochondrial alterations in dysferlin-deficient muscles.
(A, B, C) Relative abundance (from proteomic data) of proteins involved in mitochondrial translation including mitochondrial ribosomal proteins (MRPs) (A), mitochondrial dynamics (B) and electron transport chain (C) expressed relative to WT levels. (D, E) Citrate synthase (CS) activity (D) and mitochondrial respiration (E) in quadriceps muscles of 11 mo old mice. Data information: data represent means ± SEM. (A, B, C, D, E) Empirical Bayes moderated t-statistics was used to analyze proteomic data and two-tailed t test or two-way repeated measures ANOVA for panels (D, E). ** q-value < 0.01; *** q-value < 0.001. MFN1, mitofusin 1; OPA1, OPA1 mitochondrial dynamin like GTPase; FIS1, fission 1; MFF, mitochondrial fission factor; MTFP1, mitochondrial fission process 1; MTFR1L, mitochondrial fission regulator 1 like; NDUFS1, NADH:ubiquinone oxidoreductase core subunit S1; NDUFV1, NADH:ubiquinone oxidoreductase core subunit V1; SDHA, succinate dehydrogenase complex flavoprotein subunit A; SDHB, succinate dehydrogenase complex iron-sulfur subunit B; UQCRC2, ubiquinol-cytochrome c reductase core protein 2; UQCRFS1, ubiquinol-cytochrome c reductase, rieske iron-sulfur polypeptide 1; ATP5F1B, ATP synthase F1 subunit β; ATP5F1A, ATP synthase F1 subunit α; COX6C, cytochrome c oxidase subunit 6C; COX4I1, cytochrome c oxidase subunit 4I1; Succ, succinate; ROT, rotenone; AA, antimycin A; TMPD, N,N,N′,N′-Tetramethyl-p-phenylenediamine dihydrochloride; Asc, ascorbic acid.
Figure S4.
Figure S4.. Mitochondrial dysfunction in dysferlin-deficient muscles overexpressing PGC-1α.
(A) Representative electron microscopy (EM) images of quadriceps muscle of 11 mo old mice overexpressing PGC-1α specifically in muscle (PGC-1α mTG) and mice lacking dysferlin and overexpressing PGC-1α in muscle (Dysf −/− PGC-1α). (B) Quantification of the EM pictures assessing mitochondrial volume density, number and size (dashed lines represent WT values). (C) Distribution of small (<0.5 μm2) and large (>0.5 μm2) mitochondria and a more detailed distribution of mitochondria <0.5 μm2. (D, E) Relative protein abundance (from proteomic data) of enzymes involved in TCA cycle and electron transport chain expressed relative to WT levels (dashed lines represent WT values). (F, G) Citrate synthase (CS) activity (F) and mitochondrial respiration (G) in quadriceps muscles of 11 mo old mice. Data information: data represent means ± SEM. (B, C, D, E, F, G) Empirical Bayes moderated t-statistics was used to analyze proteomic data and two-tailed t test or two-way repeated measures ANOVA for panels (B, C, F, G). **P < 0.01; ***P < 0.001 (for panels (D, E), asterisks represent q-values). CS, citrate synthase; ACO2, aconitase 2; IDH3G, isocitrate dehydrogenase (NAD) subunit γ; DLD, dihydrolipoamide dehydrogenase; SUCLG2, succinyl-CoA ligase (GDP-forming) subunit β; FH, fumarate hydratase; MDH1, malate dehydrogenase 1; NDUFS1, NADH:ubiquinone oxidoreductase core subunit S1; NDUFV1, NADH:ubiquinone oxidoreductase core subunit V1; SDHA, succinate dehydrogenase complex flavoprotein subunit A; SDHB, succinate dehydrogenase complex iron-sulfur subunit B; UQCRC2, ubiquinol-cytochrome c reductase core protein 2; UQCRFS1, ubiquinol-cytochrome c reductase, rieske iron-sulfur polypeptide 1; ATP5F1B, ATP synthase F1 subunit β; ATP5F1A, ATP synthase F1 subunit α; COX6C, cytochrome c oxidase subunit 6C; COX4I1, cytochrome c oxidase subunit 4I1; Succ, succinate; ROT, rotenone; AA, antimycin A; TMPD, N,N,N′,N′-Tetramethyl-p-phenylenediamine dihydrochloride; Asc, ascorbic acid.
Figure S5.
Figure S5.. Ca2+ dysregulation in mice lacking dysferlin and those overexpressing PGC-1α.
(A) Total Ca2+ concentration in homogenate of quadriceps muscle of 11 mo old mice. (B) Relative abundance of proteins involved in Ca2+ handling expressed relative to WT levels (from proteomic data). (C, D) Relative abundance of proteins (from proteomic data) involved in muscle contraction (C) and fiber type determination (D) expressed relative to WT levels. (E) Ponceau S-stained membrane as a loading control for the Western blot presented in Fig 2H. M represents the protein ladder (marker). Data information: data represent means ± SEM. (A, B, C, D) Empirical Bayes moderated t-statistics was used to analyze proteomic data and one-way ANOVA for panel (A). *P < 0.05; **P < 0.01; ***P < 0.001 (for panel (B, C, D), asterisks represent q-values). DHPR, 1,4-dihydropyridine receptor (encoded by CACNA1S, Ca2+ voltage-gated channel subunit α1 S); RYR1, ryanodine receptor 1; SERCA1/2, sarco/endoplasmic reticulum Ca2+-ATPase 1/2 (encoded by ATP2A1 and ATP2A2); CASQ, calsequestrin; PVALB, parvalbumin; MYH, myosin heavy chain; ACTN3, actinin α 3; TNN, troponin.
Figure 3.
Figure 3.. Dysregulation of glucose metabolism in dysferlin-deficient muscles.
(A) Relative protein abundance of glucose transporter, type 4 (GLUT4) calculated from the proteomic data in quadriceps muscle of 11 mo old mice and expressed relative to WT levels. (B) Glucose uptake in quadriceps muscle of 11 mo old mice 45 min after glucose (+2-Deoxyglucose) injection. (C) Blood glucose levels and area under the curve (AUC) during a glucose tolerance test (GTT) in 11 mo old mice. (D, E, F) Relative protein abundance (from proteomic data) of enzymes involved in glycolysis (D), (E) the rate limiting enzyme of the pentose phosphate pathway glucose-6-phosphate dehydrogenase (G6PD) and (F) glycogen synthase kinase 3 β (GSK3β), glycogen synthase (GYS1), and phosphorylase (PYGM) expressed relative to WT levels. (G) Representative examples of periodic acid-Schiff (PAS)–stained sections of quadriceps muscle of 11 mo old mice (scale bar = 200 μm). (H) Representative examples of electron microscopy images of quadriceps muscle of 11 mo old mice showing an accumulation of glycogen granules (large black dots, some of which are highlighted with a red arrow) in dysferlin-deficient muscle (scale bar = 1 μm). (I, J, K) Glycogen levels assessed biochemically in quadriceps muscle of mice at 4, 7 and 11 mo of age (I) or at the age of 11 mo in panels (J, K). (L) Relative protein abundance (from proteomic data) of GLUT4, GYS1 and PYGM in quadriceps muscles of two different dysferlinopathy mouse models at the age of 11 mo (expressed relative to WT levels). Data information: data represent means ± SEM. For panel (I), data are included from WT 4 mo n = 7, WT 7 mo n = 6, WT 11 mo n = 7, Dysf −/− 4 mo n = 7, Dysf −/− 7 mo n = 5, Dysf −/− 11 mo n = 6. (A, B, C, D, E, F, I, J, K, L) Empirical Bayes moderated t-statistics was used to analyze proteomic data and two-tailed t test (panel (B), AUC for the GTT in panel (C) and panel (K)), two-way repeated measures ANOVA (GTT panel (C)), two-way ANOVE with Šídák’s multiple comparisons test (panel (I), asterisks indicate differences between the genotypes of the same age) or one-way ANOVA with Tukey’s multiple comparisons test (panel (J)). *P < 0.05; **P < 0.01; ***P < 0.001 (for panels (A, D, E, F, L), the asterisks represent q-values). GPI, glucose-6-phosphate isomerase; PFKM, phosphofructokinase, muscle; ALDOA, aldolase, fructose-bisphosphate A; TPI1, triosephosphate isomerase 1; GAPDH, glyceraldehyde-3-phosphate dehydrogenase; PGK1, phosphoglycerate kinase 1; PGAM2, phosphoglycerate mutase 2; ENO3, enolase 3; PKM, pyruvate kinase, muscle.
Figure S6.
Figure S6.. Reduced phosphorylation of glycogen phosphorylase (PYGM) in dysferlin-deficient muscle.
(A) Glucose uptake in tibialis anterior (TA) muscle of 11 mo old mice 45 min after glucose (+2-Deoxyglucose) injection. (B) Blood glucose levels and area under the curve (AUC) during a glucose tolerance test (GTT) in 7 mo old mice. (C) Plasma insulin levels 5 and 25 min after glucose injection in 11 mo old mice. (D, E) Phosphorylation of glycogen synthase kinase 3 β (GSK3β), glycogen synthase (GYS1) and PYGM measured with phosphoproteomic analysis. The values are presented relative to the WT levels. In panel (D), the phospho-data are normalized to total protein and in panel (E), the phospho-data are not normalized to total protein. Data information: data represent means ± SEM. (A, B, C, D, E) Data were analyzed using two-tailed t test (panel (A), AUC in panel (B) and panels (D, E)), two-way repeated measures ANOVA (glucose tolerance test in panel (B)) or two-way ANOVA (panel (C)). *P < 0.05; **P < 0.01; ***P < 0.001.
Figure S7.
Figure S7.. Validation in BLAJ mice.
(A) Glycogen levels assessed biochemically in tibialis anterior (TA) muscle of 11 mo old Dysf −/− mice. (B) Creatine kinase levels in a distinct dysferlin-deficient mouse models (BLAJ) at that age of 11 mo. (C, D) Muscle mass of proximal (C) and distal (D) muscles of BLAJ mice at the age of 11 mo. (E, F) Relative protein abundance (from proteomics data) of enzymes involved in glycolysis (E) and (F) the rate limiting enzyme of the pentose phosphate pathway glucose-6-phosphate dehydrogenase (G6PD). (G) Gene expression of enzymes involved in glycogen breakdown in quadriceps muscle of 11 mo old WT and Dysf −/− mice (Gaa, α-1,4-glucosidase; Pygm, glycogen phosphorylase; Agl, glycogen debranching enzyme). Data information: data represent means ± SEM. (A, B, C, D, E, F, G) Asterisks indicate differences between the genotypes using two-tailed t test (panels (A, G)) or one-way ANOVA with Tukey’s multiple comparisons test for panels (B, C, D). For the proteomic data, q-values for pairwise comparisons were calculated using the limma package. *P < 0.05; **P < 0.01; ***P < 0.001 (for panels (E, F), asterisks represent q-values). GPI, glucose-6-phosphate isomerase; PFKM, phosphofructokinase, muscle; ALDOA, aldolase, fructose-bisphosphate A; TPI1, triosephosphate isomerase 1; GAPDH, glyceraldehyde-3-phosphate dehydrogenase; PGK1, phosphoglycerate kinase 1; PGAM2, phosphoglycerate mutase 2; ENO3, enolase 3; PKM, pyruvate kinase, muscle.
Figure 4.
Figure 4.. Exercise ameliorates muscle atrophy and improves performance in dysferlin-deficient mice.
(A) Glycogen levels assessed biochemically in quadriceps muscle of 11 mo old mice at rest and after one bout of exercise to exhaustion (post). Relative glycogen depletion was calculated using the value of mice at rest and those after exercise. (B) Maximal distance and time ran until mice reached exhaustion during a maximal performance test on a treadmill at the age of 11 mo. (C) Muscle mass at the age of 11 mo in sedentary Dysf −/− mice (Dysf −/− sed, black) and Dysf −/− mice after lifelong running wheel exercise (Dysf −/− RW, blue). Dashed lines represent the values of 11 mo old WT mice. (D) Citrate synthase (CS) activity in quadriceps muscles of 11 mo old mice. Dashed line represents the value of 11 mo old WT mice. (E) Performance on the balance beam at the age of 11 mo. Dashed line represents the value of 11 mo old WT mice. (F) Number of Evans blue-positive fibers in rectus femoris muscle of 11 mo old mice. (G) Representative examples of histological sections of rectus femoris muscle of 11 mo old mice that were injected with Evans blue dye (scale bar = 200 μm). Data information: data represent means ± SEM. (A, B, C, D, E, F) Asterisks indicate differences between the intervention groups (rest versus post-exercise for panel (A) within the same genotype or sed versus RW for panel (C, D, E, F)) using Log-rank (Mantel-Cox) test for the survival curve in panel (B) and two-tailed t test for all other comparisons. Hashtags indicate difference compared with the same group of the different genotype (WT rest versus Dysf −/− rest in panel (A)). *P < 0.05; **P < 0.01; ***P < 0.001.
Figure S8.
Figure S8.. Different response to exercise in WT and Dysf −/− mice with regard to phosphorylation of enzymes involved in glycogen metabolism.
(A) Relative protein abundance (from proteomic data) of glycogen synthase kinase 3 β (GSK3β), glycogen synthase (GYS1) and glycogen phosphorylase (PYGM) expressed relative to levels of WT animals at rest. (B, C) Phosphorylation of GSK3β, GYS1 and PYGM measured with phosphoproteomic analysis during rest and after an acute bout of exercise to exhaustion. Values are expressed relative to the resting levels of the same genotype and data are not normalized to total protein. Data information: data represent means ± SEM. (A, B, C) Asterisks indicate differences between the intervention groups using empirical Bayes moderated t-statistics for panel (A) and two-tailed t test for panels (B, C). For panel (A), the statistics was only performed between the following groups: WT rest versus WT exercise, WT rest versus Dysf −/− rest, WT rest versus Dysf −/− exercise and Dysf −/− rest versus Dysf −/− exercise. *P < 0.05; **P < 0.01; ***P < 0.001 (for panel (A), asterisks represent q-values).
Figure S9.
Figure S9.. Similar substrate usage during exercise.
(A) Resting oxygen uptake (VO2) and maximal oxygen uptake assessed during a maximal performance test. (B) Respiratory exchange ratio (RER) throughout the maximal exhaustion test and resting and maximal values in both genotypes. (C) Blood lactate levels pre- and post-exercise. (D) Relative protein abundance (from proteomic data) of AMPKα2 (AMP-dependent protein kinase) and AMPKβ2 and the downstream targets ACC1 (acetyl-CoA-carboxylase) and ACC2 (expressed relative to levels of WT animals at rest). (E, F, G, H) Phosphorylation of different sites of AMPKα2, AMPKβ2, ACC1 and ACC2 during rest and after an acute bout of exercise to exhaustion. Values are expressed relative to the resting levels of the same genotype, and data are not normalized to total protein. Data information: data represent means ± SEM. (A, B, C, D, E, F, G, H) Asterisks indicate differences between the intervention groups using two-way repeated measures ANOVA followed by a Šídák’s multiple comparisons test for panels (A, B, C), empirical Bayes moderated t-statistics for panel (D) and two-tailed t test for panels (E, F, G, H). For panel (D), the statistics was only performed between the following groups: WT rest versus WT exercise, WT rest versus Dysf −/− rest, WT rest versus Dysf −/− exercise, and Dysf −/− rest versus Dysf −/− exercise. *P < 0.05; **P < 0.01; ***P < 0.001 (for panel (D), asterisks represent q-values).
Figure S10.
Figure S10.. Steady state muscle glycogen levels are not affected with lifelong exercise.
(A) Trajectory of the kilometers ran on average per day throughout the intervention study (n = 5). Solid gray (WT) and black (Dysf −/−) lines indicate the values of sedentary mice at the age of 11 mo and the dashed line at the age of 7 mo. (B) Creatine kinase levels at the age of 7 and 11 mo. (C, D) Body weight (C) and relative body composition (D) at the age of 11 mo. (E) Glycogen levels assessed biochemically in quadriceps muscle of 11 mo old mice. Data information: data represent means ± SEM. Data were analyzed using the two-tailed t test.
Figure 5.
Figure 5.. Metabolic dysregulation in dysferlin-deficient muscle.
Ca2+ homeostasis is dysregulated and mitochondria exhibit abnormalities in muscles lacking dysferlin. These mitochondrial abnormalities trigger death signaling. Furthermore, glucose uptake is elevated in the absence of dysferlin and redirected from glycolysis to glycogen synthesis resulting in an accumulation of glycogen. The increase in mitochondrial volume density and muscle glycogen by overexpressing PGC-1α (peroxisome proliferator-activated receptor γ coactivator 1α) in muscle exacerbates disease progression whereas improving mitochondrial function and stimulating the dynamics of glucose and glycogen metabolism by exercise ameliorates muscle mass loss and improves performance. Created with BioRender.com, with permission.

References

    1. Acin-Perez R, Benador IY, Petcherski A, Veliova M, Benavides GA, Lagarrigue S, Caudal A, Vergnes L, Murphy AN, Karamanlidis G, et al. (2020) A novel approach to measure mitochondrial respiration in frozen biological samples. EMBO J 39: e104073. 10.15252/embj.2019104073 - DOI - PMC - PubMed
    1. Ahrne E, Glatter T, Vigano C, Schubert C, Nigg EA, Schmidt A (2016) Evaluation and improvement of quantification accuracy in isobaric mass tag-based protein quantification experiments. J Proteome Res 15: 2537–2547. 10.1021/acs.jproteome.6b00066 - DOI - PubMed
    1. Bansal D, Campbell KP (2004) Dysferlin and the plasma membrane repair in muscular dystrophy. Trends Cell Biol 14: 206–213. 10.1016/j.tcb.2004.03.001 - DOI - PubMed
    1. Bansal D, Miyake K, Vogel SS, Groh S, Chen CC, Williamson R, McNeil PL, Campbell KP (2003) Defective membrane repair in dysferlin-deficient muscular dystrophy. Nature 423: 168–172. 10.1038/nature01573 - DOI - PubMed
    1. Bashir R, Britton S, Strachan T, Keers S, Vafiadaki E, Lako M, Richard I, Marchand S, Bourg N, Argov Z, et al. (1998) A gene related to Caenorhabditis elegans spermatogenesis factor fer-1 is mutated in limb-girdle muscular dystrophy type 2B. Nat Genet 20: 37–42. 10.1038/1689 - DOI - PubMed

Supplementary concepts

LinkOut - more resources