. 2025 Apr 4;24(4):1941-1955.
doi: 10.1021/acs.jproteome.4c00980. Epub 2025 Feb 28.

Analysis of Stratifin Expression and Proteome Variation in a Rat Model of Acute Lung Injury

Affiliations

Analysis of Stratifin Expression and Proteome Variation in a Rat Model of Acute Lung Injury

Ayaka Yoshida et al. J Proteome Res. .

Abstract

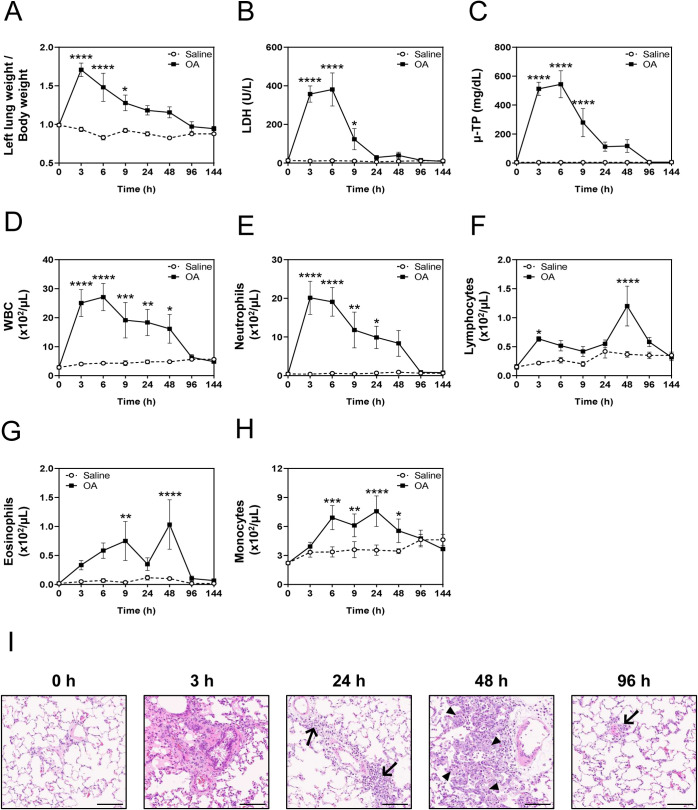
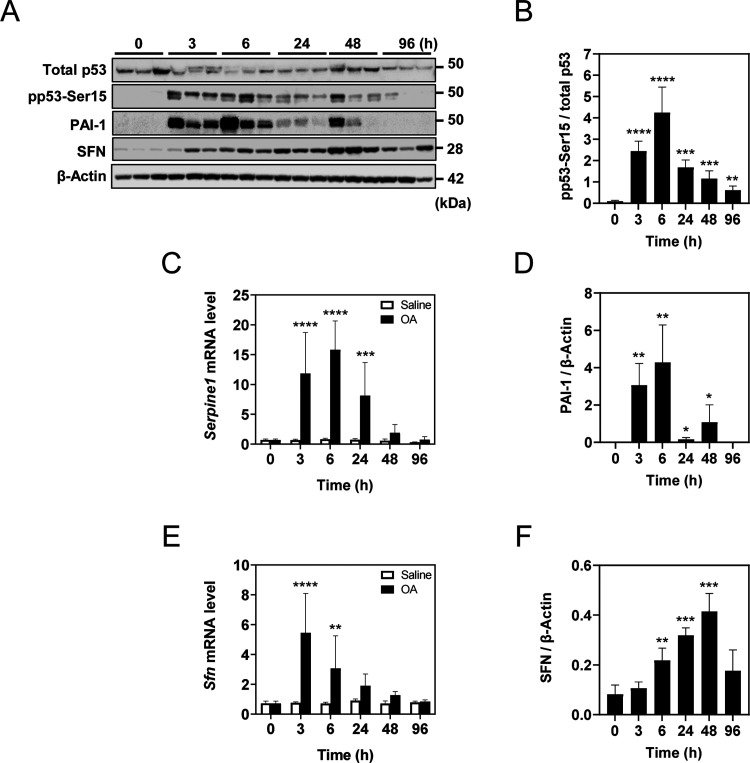
Diffuse alveolar damage (DAD) is a pathological hallmark of severe interstitial lung diseases, such as acute respiratory distress syndrome (ARDS), and is linked to poor prognosis. Previously, we identified 14-3-3σ/stratifin (SFN) as a serum biomarker candidate for diagnosing DAD. To clarify the time-dependent relationship between SFN expression and DAD, we here investigated pathological and molecular changes in serum, bronchoalveolar lavage fluid (BALF), and lung tissue in an oleic acid (OA)-induced ARDS rat model. Acute alveolar edema was observed after OA administration, followed by alveolar epithelial cell proliferation and increased BALF and serum SFN levels. Proteomic analysis of lung tissue extracts revealed that proteins related to "inflammatory response" and "HIF-1 signaling," including plasminogen activator inhibitor-1, were markedly increased 3 h after acute lung injury, followed by a gradual decrease. Conversely, proteins associated with "cell cycle" and "p53 pathway," including SFN, showed a persistent increase starting at 3 h and peaking at 48 h. Western blotting and immunohistochemistry confirmed that SFN was expressed in a part of proliferated alveolar type-II cells, accompanied by p53 activation, an important event for differentiation into type-I cells. SFN may be a biomarker closely related to alveolar remodeling during the repair process after lung injury.

Keywords: acute lung injury; acute respiratory distress syndrome; biomarker; diffuse alveolar damage; interstitial lung disease; oleic acid; proteomics; stratifin.


Conflict of interest statement

The authors declare no competing financial interest.

Figures

Figure 1
Figure 1
Schematic view of the animal experiment. Rats were intravenously injected with OA or saline, and their samples were collected at each time point (0, 3, 6, 9, 24, 48, 96, 144, and 240 h; n = 5 or 6). BALF was collected from the right lung. After BALF collection, the right lung tissues were frozen until the protein and RNA extraction. The left lung was paraffin-embedded for histological evaluation. Arterial blood was collected, and serum was separated. These samples were used for the indicated experiments.
Figure 2
Figure 2
Characterization of lung injury in OA-induced ARDS rats. At the indicated time point after the injection of OA or saline, the lung tissues and BALF were subjected to the following tests: lung weight/body weight ratio assessment (A), and measurement of typical BALF biomarkers: LDH (B), μ-TP (C), WBC (D), neutrophils (E), lymphocytes (F), eosinophils (G), and monocytes (H). Data for the OA and saline groups are represented by black squares and white circles, respectively. Data are shown as mean ± SEM (n = 5 or 6). *p < 0.05, **p < 0.01, ***p < 0.001, ****p < 0.0001 vs the pretreated group (0 h) using two-way ANOVA and Bonferroni’s posthoc test. (I) Representative histopathological findings in the lung tissues of OA-treated rats (hematoxylin and eosin staining). Arrows indicate infiltration of inflammatory cells. Arrowheads indicate hyperplasia of ATII cells. Scale bars = 100 μm.
Figure 3
Figure 3
Time-dependent changes of SFN and SP-D levels in BALF and serum. SFN (A, B) and SP-D (C, D) levels were measured using ELISA. Biomarker levels in BALF (A, C) and serum (B, D) in the OA and saline groups are presented in black squares and white circles, respectively. Data are shown as mean ± SEM (n = 5 or 6). *p < 0.05, **p < 0.01, ***p < 0.001, ****p < 0.0001 vs 0 h using two-way ANOVA and Bonferroni’s posthoc test.
Figure 4
Figure 4
Proteomic analysis of lung tissue extracts in OA-induced ARDS rats. (A) Numbers of protein groups identified in the proteome analysis. (B) Volcano plots of differential proteins in the OA-treated rats. Red or blue dots indicate proteins with log2 fold change > 1.0 or < – 1.0, respectively, and p-value < 0.05 using Welch’s t test compared with the pretreated group (0 h) (n = 3). A total of 325 proteins at 3 h, 192 proteins at 24 h, 355 proteins at 48 h, and 39 proteins at 96 h after OA administration were significantly increased. Conversely, significant decreases were observed in 47 proteins at 3 h, 23 proteins at 24 h, 105 proteins at 48 h, and 20 proteins at 96 h after OA administration. (C, D) Functional analysis of significantly elevated proteins at 3 (325 proteins) and 48 (355 proteins) h after OA administration. (C) Biological process category, (D) KEGG pathway category. (E) Heatmap and hierarchical clustering representing Pearson correlation. The heatmap illustrates the changes in expression levels of the 604 proteins that were significantly increased at 3, 6, 24, 48, and 96 h. Samples are given in the columns, and proteins are given in the rows. High expression is shown in red, and low expression is shown in green.
Figure 5
Figure 5
Representative proteins differentially expressed in lung tissues of OA-induced ARDS rats. (A) Proteins with the expression pattern A related to immunity and inflammatory response (a–e), and the HIF-1 signaling pathway (f–h). (B) Proteins with the expression pattern B related to the HIF-1 signaling pathway (a), cell cycle acceleration (b–d), surfactant proteins (e–h), SFN and PATS markers (i–k), tissue repair (i, m), and programmed cell death (a, n–p). Each protein is indicated by its official gene symbol. Intensities are indicated as quantification values obtained from proteomic analysis using DIA-NN and Perseus software. Data are shown as mean ± SEM (n = 3). *p < 0.05, **p < 0.01, ***p < 0.001, ***p < 0.0001 vs 0 h using the Welch’s t test.
Figure 6
Figure 6
Western blotting and qRT-PCR analyses of PAI-1, SFN, and p53. (A) Representative Western blot images of the abundance of PAI-1, SFN, and p53-related proteins in the lung tissue extracts from OA-treated rats. (B, D, F) Graphs depicting the quantitation of phosphorylated p53 at Ser15 (pp53-Ser15, B), PAI-1 (Serpine1, D), and SFN (F) by ImageJ software. The abundance of pp53-Ser15 was normalized with that of total p53, and the abundance values of PAI-1 and SFN were normalized with that of β-actin. Data are shown as mean ± SEM (n = 3), *p < 0.05, **p < 0.01, ***p < 0.001, ****p < 0.0001 vs 0 h using one-way ANOVA and Dunnett’s posthoc test. (C, E) mRNA levels of PAI-1 (Serpine1, C) and SFN (Sfn, E) in lung tissues of OA-treated rats. mRNA levels were quantified using qRT-PCR and normalized with those of Tbp. Data are shown as mean ± SEM (n = 5 or 6). ***p < 0.001, ****p < 0.0001 vs 0 h using two-way ANOVA and Bonferroni’s posthoc test.
Figure 7
Figure 7
Immunohistochemical analysis of SFN and Ki67. Representative immunohistochemical findings for SFN and Ki67 in the lung tissues of OA-treated rats. An arrow marks the appearance of Ki67-positive ATII cells at 3 h after OA administration. Arrowheads indicate SFN-positive cells. Scale bars = 100 μm.

References

    1. Kawase S.; Hattori N.; Ishikawa N.; Horimasu Y.; Fujitaka K.; Furonaka O.; Isobe T.; Miyoshi S.; Hamada H.; Yamane T.; et al. Change in serum KL-6 level from baseline is useful for predicting life-threatening EGFR-TKIs induced interstitial lung disease. Respir Res. 2011, 12 (1), 97.10.1186/1465-9921-12-97. - DOI - PMC - PubMed
    1. Arakawa N.; Matsuyama S.; Matsuoka M.; Kitamura I.; Miyashita K.; Kitagawa Y.; Imai K.; Ogawa K.; Maeda T.; Saito Y.; Hasegawa C. Serum stratifin and presepsin as candidate biomarkers for early detection of COVID-19 disease progression. J. Pharmacol Sci. 2022, 150 (1), 21–30. 10.1016/j.jphs.2022.06.002. - DOI - PMC - PubMed
    1. Arakawa N.; Ushiki A.; Abe M.; Matsuyama S.; Saito Y.; Kashiwada T.; Horimasu Y.; Gemma A.; Tatsumi K.; Hattori N.; et al. Stratifin as a novel diagnostic biomarker in serum for diffuse alveolar damage. Nat. Commun. 2022, 13 (1), 585410.1038/s41467-022-33160-9. - DOI - PMC - PubMed
    1. Sakuma N.; Abe M.; Ishii D.; Kawasaki T.; Arakawa N.; Matsuyama S.; Saito Y.; Suzuki T.; Tatsumi K. Serum stratifin measurement is useful for evaluating disease severity and outcomes in patients with acute exacerbation of interstitial lung disease: a retrospective study. BMC Pulm Med. 2024, 24 (1), 364.10.1186/s12890-024-03184-6. - DOI - PMC - PubMed
    1. Dellambra E.; Golisano O.; Bondanza S.; Siviero E.; Lacal P.; Molinari M.; D’Atri S.; De Luca M. Downregulation of 14–3-3sigma prevents clonal evolution and leads to immortalization of primary human keratinocytes. J. Cell Biol. 2000, 149 (5), 1117–1130. 10.1083/jcb.149.5.1117. - DOI - PMC - PubMed

MeSH terms