. 2025 Feb 28;16(1):2067.
doi: 10.1038/s41467-025-57331-6.

Transcriptional diversification in a human-adapting zoonotic pathogen drives niche-specific evolution

Affiliations

Transcriptional diversification in a human-adapting zoonotic pathogen drives niche-specific evolution

Soma Ghosh et al. Nat Commun. .

Abstract

Bacterial pathogens can undergo striking adaptive evolutionary change in the context of infection, driven by selection forces associated with host defenses and antibiotic treatment. In this work, we analyze the transcriptional landscape associated with adaptation in an emerging zoonotic pathogen, Bordetella hinzii, as it evolved during a 45-month infection in an IL12Rβ1-deficient immunocompromised host. We find evidence of multiple niche-specific modifications in the intravascular and gastrointestinal compartments, involving the superoxide dismutase system, glutamate and ectoine metabolism, chaperone-mediated protein folding, pilus organization, and peptide transport. Individual blood lineages displayed modifications in glutathione, phenylacetate, and 3-phenylpropionate metabolism, iron cluster assembly, and electron transport, whereas individual gastrointestinal lineages demonstrated changes relating to gluconeogenesis, de novo pyrimidine synthesis, and transport of peptides and phosphate ions. Down regulation of the flagellar operon with corresponding loss of flagellar structures occurred in multiple lineages, suggesting an evolutionary tradeoff between motility and host immune evasion. Finally, methylome analysis demonstrates alteration of global genome methylation associated with loss of a Type III methyltransferase. Our findings reveal striking plasticity in how pathogen transcriptomes explore functional space as they evolve in the context of host infection, and demonstrate that such analysis may uncover phenotypic adaptations not apparent from genomic analysis alone.


Conflict of interest statement

Competing interests: The authors declare no competing interests.

Figures
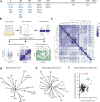
Fig. 1
Fig. 1. B. hinzii isolates evolved extensive transcriptomic diversity during prolonged infection of human host.
a Timeline of isolate collection. Isolates were numbered by the day of collection, followed by culture source (Blood or Gastrointestinal), followed by number and letter designating individual morphotypes. Blood isolates are indicated in blue and GI isolates are indicated in black. b Schematic illustration of experimental workflow for transcriptome analysis. Twenty-two B. hinzii isolates were cultured overnight in triplicate, followed by sub-culturing, RNA harvest at 4 hr and 10 hr and Illumina library preparation. The sequencing reads were trimmed, filtered, and mapped to reference isolate 2B3, followed by comparison of normalized counts of growth phase independent genes to identify differentially expressed genes using DESeq2. Created in BioRender. Ghosh, S. (2025) https://BioRender.com/r06y208. c Clustered heat map of relative Euclidean distances between the transcriptomes (only growth phase independent genes) of all isolate pairs, except 3B1 at the 4 hr timepoint. The color of each cell corresponds to the Euclidean distance between isolate pairs on a scale of 0–80, represented in the color band at right. d Neighbor joining tree based on the pairwise distances between isolate genomes. e Neighbor joining tree based on Euclidean distances between isolate transcriptomes at the 4 hr timepoint. f Correlation plot between the genotypic distance and transcriptome distance (Euclidean distance) between pairs of isolates at 4 hr time point. DnaQ WT isolates are shown in red; isolates in black are DnaQ E9G proof-reading deficient hypermutators, and the isolate shown with blue dots is 3B1, which is a compound hypermutator and an outlier. Linear fit is to all points including 3B1.
Fig. 2
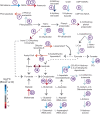
Fig. 2. Niche-specific differential regulation of central metabolic pathways.
A total of 268 differentially expressed genes were identified between isolates harvested from blood and the GI tract, of which 25 corresponded to metabolic genes in the KEGG database. The figure indicates the enzyme, intermediates, and products for each inferred reaction, and enzymes are numbered as defined below. Arrow color defined in key indicates the log2FC values of differential expression based on group DESeq2 calculations. Enzyme labels are as follows: 1) nitronate monooxygenase, 2) nitrite reductase (NADH) large subunit, 3) nitrite reductase (NADH) small subunit, 4) 4-methoxybenzoate monooxygenase, 5) dihydropyrimidine dehydrogenase subunit A, 6) UDP-N-acetyl-D-glucosamine 6-dehydrogenase, 7) acylamidase, 8) catalase-peroxidase, 9) 3-hydroxycinnamic acid hydroxylase, 10) rhodocoxin reductase, 11) cystathionine beta-lyase, 12) dihydrolipoyl dehydrogenase 13) pyruvate dehydrogenase E2 component, 14) aconitate hydratase, 15) glutamate synthase (NADPH) large chain, 16) glutamate synthase (NADPH) small chain, 17) 4-hydroxy-tetrahydrodipicolinate synthase, 18) diaminobutyrate–2-oxoglutarate transaminase, 19) L-2,4-diaminobutyric acid acetyltransferase, 20) L-ectoine synthase, 21) ectoine hydroxylase, 22) maleamate amidohydrolase, 23) NADH-dependent formate dehydrogenase delta subunit FdsD, 24) aspartyl-tRNA(Asn)/glutamyl-tRNA(Gln) amidotransferase subunit A.
Fig. 3
Fig. 3. Downregulation of flagellar biosynthesis suggests evolutionary tradeoff.
a Schematic representation of the flagella with key components labeled and color coded. b Heatmap of flagellar genes (rows) vs. isolates (columns). Data are aggregated by isolate and colors correspond to log2FC of flagellar genes expression relative to ancestral reference isolate 2B3. A separate heatmap represents the absolute rlog count values of the genes in 2B3 at the 4 hr and 10 hr time points. c Correlation plot between the mean of log2FC for flagellar genes and genes involved in capsule biosynthesis in all isolates relative to ancestral 2B3 reference. Data are fit with linear model and envelope represents the 95th percentile confidence interval of the linear fit. d Representative TEM images of select isolates, following overnight growth. Each image was selected as a field from a single biological TEM preparation of the represented isolate. (see “Methods”). Flagella are marked by black arrows. Scale bars are 500 nm. e TEM images for each isolate following overnight growth were scored for the presence of flagellated bacteria. A minimum of 30 bacteria were counted and % of flagellated bacterial cells plotted.
Fig. 4
Fig. 4. Global loss of Type III genome methylation in compound hypermutator sublineage.
a The plot represents mean current differences (pA; y-axis) between the native methylated DNA and the PCR-amplified DNA as obtained from ONT Nanopore sequencing and analyzed using nanodisco. Data from each isolate represents a single biological replicate and the display items represent the standard visual output of the nanodisco software, with violin plots summarizing the underlying distribution. Red arrow highlights the difference in mean current levels identified by nanodisco to represent a specific DNA modification (see “methods”). Left panel represents current difference in a Type II motif (CGC5mCGGCG) and right panel represents current difference in a Type III motif (AGCG4mCCY) in isolates 2B3 (top) and 1B1a (bottom), demonstrating loss of the Type III motif in 1B1a. b Potential methyltransferases identified with MethylaseFinder. c Multiple sequence alignment of putative Type III DNA methyl transferase shows a stop-gain mutation at position 179 in 1B1a and 1B1b, explaining loss of Type III methylation in these isolates. Alignment is shown for residues 160–190. d Circos plot summarizing the distribution of genes and methylation motifs in the 2B3 genome. Rings are described in the following from outermost to innermost. The outermost ring identifies genes in 1B1a and 1B1b whose transcription is potentially modified by loss of Type III motif methylation. Pink indicates the 33 gene (in 25 groups) that are differentially expressed in both 1B1a and 1B1b (relative to all other isolates with intact Type III methylation). The region is zoomed in 75% for better visualization. Dark green indicates those genes that are not differentially regulated (these genes are summarized and piled). The next two rings identify Type III methylation motif positions on the positive strand (purple) and negative strand (blue). The inner two rings represent log2FC of genes in 1B1a (next to innermost ring) and 1B1b (innermost ring) with reference to 2B3. Full data are given in Supplementary Data 6 and 8. Plot was generated using Circos package.
Fig. 5
Fig. 5. Functional classification of global transcriptional changes reveals both unique and shared adaptations.
Bipartite network representing the relationships between isolates (ellipses) and enriched functional categories (rectangles) as determined by Gene Ontology classification of differentially expressed gene groups. The isolates are ordered by day of culture (left) and compartment (Blood, GI). Enriched functional categories uniquely present in the GI isolates are shown on the left, those that are uniquely present in blood isolates are show on the right, and those shared by isolates cultured from both blood and GI compartments are shown at the center. Three enriched functional categories shared by all isolates relative to 2B3 are not shown.

References

    1. Dekker, J. P. Within-host evolution of bacterial pathogens in acute and chronic infection. Annu Rev. Pathol.19, 203–226 (2024). - PubMed
    1. Didelot, X., Walker, A. S., Peto, T. E., Crook, D. W. & Wilson, D. J. Within-host evolution of bacterial pathogens. Nat. Rev. Microbiol14, 150–162 (2016). - PMC - PubMed
    1. Barreto, H. C. & Gordo, I. Intrahost evolution of the gut microbiota. Nat. Rev. Microbiol21, 590–603 (2023). - PubMed
    1. Smith, W. P. J., Wucher, B. R., Nadell, C. D. & Foster, K. R. Bacterial defences: mechanisms, evolution and antimicrobial resistance. Nat. Rev. Microbiol21, 519–534 (2023). - PubMed
    1. Grote, A. & Earl, A. M. Within-host evolution of bacterial pathogens during persistent infection of humans. Curr. Opin. Microbiol70, 102197 (2022). - PMC - PubMed

LinkOut - more resources