. 2025 Feb 28;16(1):2053.
doi: 10.1038/s41467-025-57363-y.

Neuron-specific isoform of PGC-1α regulates neuronal metabolism and brain aging

Affiliations

Neuron-specific isoform of PGC-1α regulates neuronal metabolism and brain aging

Dylan C Souder et al. Nat Commun. .

Abstract

The brain is a high-energy tissue, and although aging is associated with dysfunctional inflammatory and neuron-specific functional pathways, a direct connection to metabolism is not established. Here, we show that isoforms of mitochondrial regulator PGC-1α are driven from distinct brain cell-type specific promotors, repressed with aging, and integral in coordinating metabolism and growth signaling. Transcriptional and proteomic profiles of cortex from male adult, middle age, and advanced age mice reveal an aging metabolic signature linked to PGC-1α. In primary culture, a neuron-exclusive promoter produces the functionally dominant isoform of PGC-1α. Using growth repression as a challenge, we find that PGC-1α is regulated downstream of GSK3β independently across promoters. Broad cellular metabolic consequences of growth inhibition observed in vitro are mirrored in vivo, including activation of PGC-1α directed programs and suppression of aging pathways. These data place PGC-1α centrally in a growth and metabolism network directly relevant to brain aging.


Conflict of interest statement

Competing interests: The authors declare no conflict of interest.

Figures
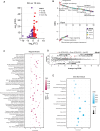
Fig. 1
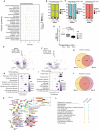
Fig. 1. Aging impacts brain immune, inflammatory, and neuronal functional networks.
A Volcano plot displaying transcripts quantified. Statistically significant transcripts are highlighted in red (upregulated) or purple (downregulated) in 30-month-old compared to 10-month-old male cortical tissue. B Rank order plot of enriched pathways by GSEA. Plot is ranked by normalized enrichment score. Each point represents pathways enriched in the 30v10 comparison. Points are color-coded by overlap with other comparisons (20v10–yellow, 30v20–cyan, 30v10 only–purple, present in all–grey). C KEGG pathways enriched in the Magenta module of WGCNA. D Mean-difference (MD) plots of transposable elements (TE) expression Log2FC against the average Log2count-per-million (CPM) for 30 m/10 m. TE callouts: “TE name (TE class).” E KEGG pathways enriched in the Steel blue module of WGCNA. n = 5 mice/ age group.
Fig. 2
Fig. 2. Metabolism of brain aging is reflected in the transcriptome and proteome.
A KEGG pathways of the green-yellow module of WGCNA from mouse cortex. B, C Abundance of Mitocarta3.0 genes in the green-yellow (p = 0.0004) (B), cyan (p < 0.0001), and salmon (p < 0.0001) (C) modules. Signficance determined by two-sided Fisher’s exact test. D RT-qPCR detection of PGC-1α expression cortex of male mice at 10 months, 20 months, and 30 months old (n = 5 mice/ age group). Boxplot represents median, 25th and 75th percentiles, and whiskers extend to min and max. Significance determined by Wilcox test (individual group comparison) and Kruskal–Wallis test. E, F Volcano plots displaying proteins quantified. Statistically significant proteins determined by Tukey’s HSD test are highlighted in purple. G Venn diagram showing overlap between differentially expressed proteins in the 30-month-old or 20-month-old cortex compared to the 10-month-old. H, I KEGG pathways enriched in the 30-month-old cortical proteome (H) and 20-month-old cortical proteome (I). Only pathways with greater than 6 proteins were plotted. J Venn diagram showing the overlap between enriched KEGG pathways in the 30-month-old or 20-month-old cortex compared to the 10-month-old cortex. K Network identified by String analysis. Proteins are colored based on biological pathway—mitochondrial ETC (yellow), ribosome (red), protein trafficking (brown), RNA splicing (orange). L Table displaying common pathways between the 20v10 and 30v10 comparison and if they are activated or repressed compared to the 10-month-old. n = 5 mice/ age group.
Fig. 3
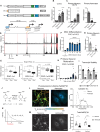
Fig. 3. PGC-1α transcript isoforms in the brain and cell type specificity.
A Schematic of the three major isoforms of Ppargc1a expressed in the brain and a representation of the location of their distinct promoter regions. B, C Relative expression pattern of PGC-1α transcripts detected by RT-qPCR of 12-month-old male mouse cortex (n = 6 mice) (B) and DIV10 primary cortical neurons and astrocytes isolated from P0 (neurons) and P1 (astrocytes) neonates (n = 6) (C). D Read density from GSE52564 for isolated neurons and astrocytes across the Ppargc1a locus. Pink lines denote annotated exons. E RT-qPCR detection of Ppargc1a transcript variants in cortex of male mice at 10 months, 20 months, and 30 months old (n = 5 mice). Boxplot represents median, 25th and 75th percentiles, and whiskers extend to min and max. F Expression of the brain-specific isoform of PGC-1α during neural stem cell (NSC) differentiation (n = 3 biological replicates). G Relative expression pattern of PGC-1α transcripts detected in DIV0 P0 neurons by RT-qPCR (n = 6 biological replicates). H Detection of Ppargc1a B1E2 during maturation of P0 primary cortical neurons (DIV0, 1, 3, 5, 7: n = 5; DIV10, 14: n = 6). I PGC-1α transcript levels after 24 h of actinomycin D treatment (n = 7). J Schematic of oxidation-reduction reaction of NAD+ to NADH. K Example of two-component decay curve produced through fluorescence lifetime imaging microscopy and is represented by the equation τm = a11)+a22). L Representative images (left) and distributions (right) of NAD(P)H mean fluorescence lifetime images of primary neurons and primary astrocytes (n = 10 neurons, n = 12 astrocytes). M Representative images (left) and quantitation (right) of NAD(P)H fluorescence intensity of primary neurons and primary astrocytes (n = 10 neurons, n = 12 astrocytes). Data shown with error bars noting mean ± SEM (B, C, FI, M). Signficance determined by ordinary one-way ANOVA with Dunnett’s multiple comparisons test (B, C, FH), the Wilcox test (individual group comparison) and the Kruskal–Wallis test (E), or by two-way ANOVA with Sidak’s multiple comparisons test (I, M). Asterisks indicate p value of <0.05 (*), <0.01(**), <0.0001 (****). See Source data file for exact p-values. See methods section for details on biological replicates used for RT-qPCR.
Fig. 4
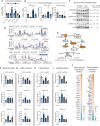
Fig. 4. PGC-1α gene promoter activation by GSK3β and associated factors.
A RT-qPCR detection of PGC-1α transcripts in control and LiCl-treated neurons (n = 6 replicates). B RT-qPCR detection of PGC-1α transcripts after 24-h treatment with actinomycin D +/− LiCl (n = 7 replicates). C Immunoblots of phosphorylation and total protein of GSK3β, CREB, and AMPK after 24-h treatment with 15 mM lithium chloride (LiCl) (n = 6–7). D Prediction of CREB binding sequences in Mmu Ppargc1a promoters using a transcription factor binding motif prediction software (http://tfbind.hgc.jp/). E Schematic of proposed pathways of lithium regulation of Ppargc1a transcripts (orange—proteins investigated in (FI). F–I RT-qPCR detection of Pparc-1a transcripts following treatment with lithium in the presence or absence of GSK3β inhibitor VIII (n = 6–8) (F), AMPK inhibitor Compound C (n = 5–9) (G), TrkB inhibitor ANA-12 (n = 4–6) (H), or CREB inhibitor 666-15 (I) (n = 6) (see Source data file for specific p-values for (FI). J Heatmap of the significantly changing genes detected from the “Transcriptional corepressor binding” and “Transcriptional repressor complex” GO terms. Data shown with error bars noting mean ± SEM (A, B, FI). Asterisk (*) indicates p-value < 0.05 by two-way ANOVA with Sidak’s multiple comparison test (A), ordinary one-way ANOVA with Dunnett’s test (B, FI), or two-tailed unpaired student’s t-test (C). See Source data file for exact p-values and for exact n for each group of (FI). See methods for details on biological replicates used for RT-qPCR and western blots.
Fig. 5
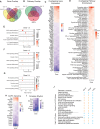
Fig. 5. Neuronal metabolic response to GSK3β inhibition with LiCl.
A Rank order plot of enriched pathways detected by GSEA of RNA-sequencing of neurons treated for 24 h with 15 mM LiCl (n = 4 replicates). Pathways are adjusted p-value determined by FDR. B, C Heatmap of the significantly changing genes in the oxidative phosphorylation (B) and ribosome (C) pathways enriched in LiCl-treated neurons. D Heatmap of PGC-1α responsive genes detected in the LiCl-treated neuron RNA-seq data. E Oxygen consumption of primary neurons treated with LiCl or a control media change measured by RESIPHER monitor for 24 h (n = 6 replicates). F Mitochondrial membrane potential assessed by JC-1 assay in primary neurons treated with LiCl or GSK3β inhibitor (Inhibitor VIII) for 24 h. G Representative images and quantification of mitochondria detected with TOMM20 antibody after 24 h treatment with LiCl or Inhibitor VIII. Mitochondrial size was determined through particle size detection in ImageJ (n = 25 control, n = 26 LiCl, n = 22 inhibitor VIII). H Representative images (left) and distributions (right) of NAD(P)H mean fluorescence lifetime of control or LiCl-treated primary neurons. I Representative images (left) and quantitation (right) of NAD(P)H fluorescence intensity of control or LiCl-treated primary neurons (n = 32 control neurons, n = 28 LiCl neurons). J NAD/NADH and NADP/NADPH ratios determined by biochemical assay (NAD/NADH: n = 18 control, n = 11 LiCl; NADP/NADPH: n = 16 control, n = 24 LiCl). Data shown with error bars noting mean ± SEM (F, G, I, J). Asterisks indicate p-value < 0.05 by multiple two-tailed t-tests (E), two-tailed unpaired student’s t-test (F, I, J), or Brown-Forsythe and Welch ANOVA with Dunnett’s test (G). See Source data file for exact p-values. See methods for details on biological replicates for western blots.
Fig. 6
Fig. 6. GSK3β plays an integrating role in growth regulation.
A Immunodetection of phosphorylated and total protein levels of IRS, AKT, S6, and ERK1/2 in primary neurons (n = 6–8). B Schematic of protein expression and phosphorylation in LiCl-treated neurons by Western blot (Figs. 4C and 5A). CE Heatmaps of cell cycle, nucleocytoplasmic transport, and extracellular matrix-receptor interaction pathways detected GSEA in lithium-treated neuron RNA-sequencing. F Representative images (left) and quantitation (right) of immunodetection of tubulin in control and LiCl-treated primary neurons (n = 13 control, n = 15 LiCl). Quantitation by Sholl analysis using the Sholl Analysis ImageJ. G Schematic of feeding timeline for lithium carbonate mouse study. Mice were fed lithium carbonate-containing food at 0, 0.6, 1.2, 1.8, and 2.4 g/kg daily for 16 weeks. H Body weights of the mice fed diets containing the five doses of LiCO3 (n = 10 mice/ diet). I Body composition analysis for the LiCO3-fed mice. Total fat mass (left) and fat mass as a percent of total adiposity (right). 0.0: 9 mice, 0.6: 10 mice, 1.2: 9 mice, 1.8: 8 mice, 2.4: 10 mice. Data shown with error bars noting mean ± SEM. Statistical significance was determined by two-tailed unpaired Student’s t-test (A), two-tailed unpaired student’s t-test with Welch’s correction (F) or ordinary one-way ANOVA with Dunnett’s test (H, I). See Source data file for exact p-values. See methods for details on biological replicates used for western blots.
Fig. 7
Fig. 7. LiCl impacts brain growth and metabolism pathways.
A Venn diagram of significant genes detected in the brains of mice treated with 4 different doses of LiCO3 compared to control mice (n = 4 mice/ diet). B Venn diagram of pathways enriched in the brains of mice given 1.2, 1.8, and 2.4 g/kg/day. Pathways were detected by PathfindR. C Heatmap of the 56 genes that are differentially expressed in all 3 doses. D Heatmap of 53 overlapping enriched pathways detected by PathfindR. EG Dotplots of top 5 enriched pathways in the 1.2 (E), 1.8 (F) and 2.4 (G) g/kg mouse brains. Significant pathways were determined by an FDR < 0.05. H, I Heatmap of the significantly changing genes in MAPK Signaling (H) and Circadian Rhythm (I) pathways across each of 3 doses of LiCO3. J Table displaying common KEGG pathways between the 30v10 30v20 and the LiCO3 diets comparison. An up arrow indicates positively enriched in 30 months compared to 10 or 20 months, respectively, or in LiCO3 diets compared to the control diet.

Update of

References

    1. López-Otín, C., Blasco, M. A., Partridge, L., Serrano, M. & Kroemer, G. Hallmarks of aging: an expanding universe. Cell186, 243–278 (2023). - PubMed
    1. Barger, J. L. et al. A conserved transcriptional signature of delayed aging and reduced disease vulnerability is partially mediated by SIRT3. PLoS ONE10, e0120738 (2015). - PMC - PubMed
    1. Monzel, A. S., Enríquez, J. A. & Picard, M. Multifaceted mitochondria: moving mitochondrial science beyond function and dysfunction. Nat. Metab.5, 546–562 (2023). - PMC - PubMed
    1. Harrington, J. S., Ryter, S. W., Plataki, M., Price, D. R. & Choi, A. M. K. Mitochondria in health, disease, and aging. Physiol. Rev.103, 2349–2422 (2023). - PMC - PubMed
    1. Lima, T., Li, T. Y., Mottis, A. & Auwerx, J. Pleiotropic effects of mitochondria in aging. Nat. Aging2, 199–213 (2022). - PubMed

MeSH terms

Substances

LinkOut - more resources