

Carbon dioxide removal from triethanolamine solution using living microalgae-loofah biocomposites
- PMID: 40021661
- PMCID: PMC11871227
- DOI: 10.1038/s41598-025-90855-x
Carbon dioxide removal from triethanolamine solution using living microalgae-loofah biocomposites
Abstract
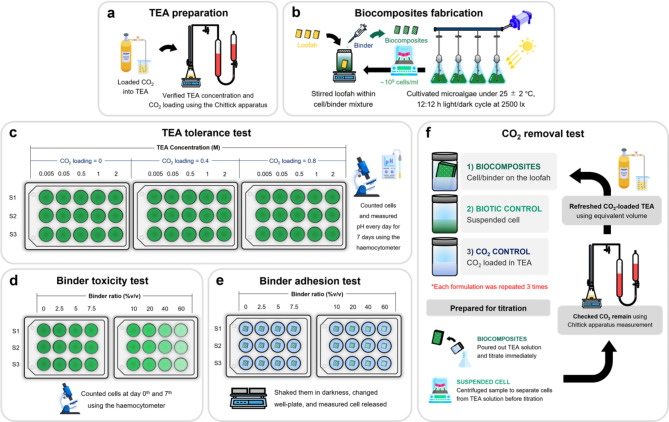
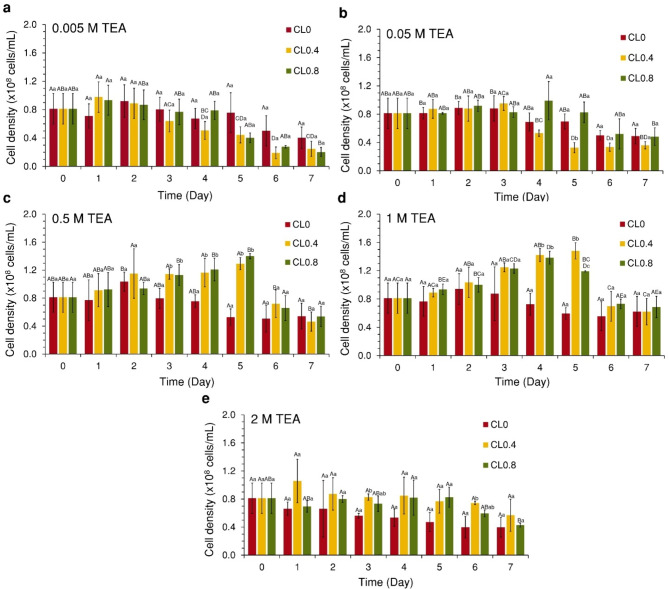
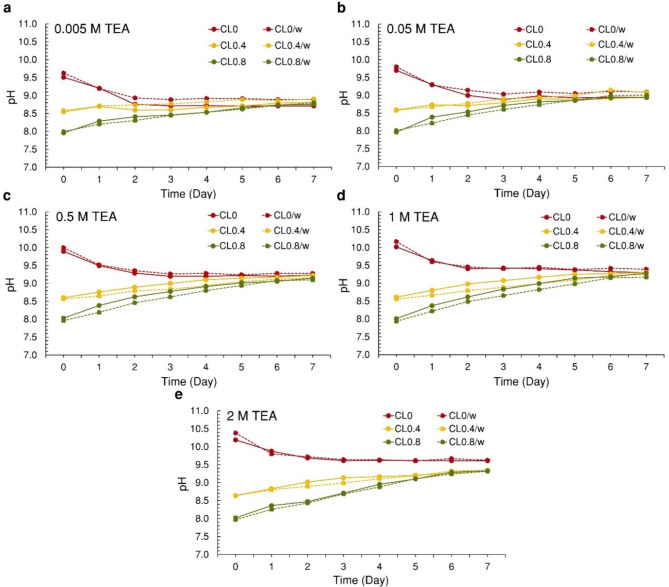
Nowadays, the climate change crisis is an urgent matter in which carbon dioxide (CO2) is a major greenhouse gas contributing to global warming. Amine solvents are commonly used for CO2 capture with high efficiency and absorption rates. However, solvent regeneration consumes an extensive amount of energy. One of alternative approaches is amine regeneration through microalgae. Recently, living biocomposites, intensifying traditional suspended cultivation, have been developed. With this technology, immobilizing microalgae on biocompatible materials with binder outperformed the suspended system in terms of CO2 capture rates. In this study, living microalgae-loofah biocomposites with immobilized Scenedesmus acuminatus TISTR 8457 using 5%v/v acrylic medium were tested to remove CO2 from CO2-rich triethanolamine (TEA) solutions. The test using 1 M TEA at various CO2 loading ratios (0.2, 0.4, 0.6, and 0.8 mol CO2/mol TEA) demonstrated that the biocomposites achieved CO2 removal rates 3 to 5 times higher than the suspended cell system over 28 days, with the highest removal observed at the 1 M with 0.4 mol CO2/mol TEA (4.34 ± 0.20 gCO2/gbiomass). This study triggers a new exploration of integration between biological and chemical processes that could elevate the traditional amine-based CO2 capture capabilities. Nevertheless, pilot-scale investigations are necessary to confirm the biocomposites's efficiency.
© 2025. The Author(s).
Conflict of interest statement
Declarations. Competing interests: All authors of this manuscript declare that they have no competing financial interests or personal relationships that could have influenced the outcome or interpretation of this study. Specifically, they affirm that they have no financial relationships with any organizations or individuals that may have a direct or indirect interest in the subject matter discussed in this manuscript. Additionally, they have no financial relationships, such as employment, consultancies, stock ownership, or patents, that may be perceived as having influenced the research conducted or the conclusions drawn. Furthermore, the authors confirm that there are no other associations or conflicts of interest, financial or otherwise, that could potentially affect the impartiality, objectivity, or integrity of this work. This declaration is made with the understanding that any undisclosed competing interests discovered after publication that are relevant to the study will be promptly disclosed to the journal editor. In short, all the authors declare no competing interests.
Figures


References
-
- Global Monitoring Laboratory. Trends in atmospheric carbon dioxide. https://gml.noaa.gov/ccgg/trends/ (2024).
-
- Lee, H. et al. Climate change 2023: Synthesis Report. Contribution of Working Groups I, II and III to the Sixth Assessment Report of the Intergovernmental Panel on Climate Change. Geneva, Switzerland, pp. 35–115. 10.59327/IPCC/AR6-9789291691647 (2023).
-
- Skjånes, K., Lindblad, P. & Muller, J. BioCO2–A multidisciplinary, biological approach using solar energy to capture CO2 while producing H2 and high value products. Biomol. Eng.24 (4), 405–413. 10.1016/j.bioeng.2007.06.002 (2007). - PubMed
-
- Goswami, R. K., Mehariya, S. & Verma, P. Advances in microalgae-based carbon sequestration: current status and future perspectives. Environ. Res.249, 118397. 10.1016/j.envres.2024.118397 (2024). - PubMed
MeSH terms
Substances
LinkOut - more resources
Full Text Sources
