. 2025 Feb 28;16(1):2055.
doi: 10.1038/s41467-025-57367-8.

HBV-associated hepatocellular carcinomas inhibit antitumor CD8+ T cell via the long noncoding RNA HDAC2-AS2

Affiliations

HBV-associated hepatocellular carcinomas inhibit antitumor CD8+ T cell via the long noncoding RNA HDAC2-AS2

Yanan Gao et al. Nat Commun. .

Abstract

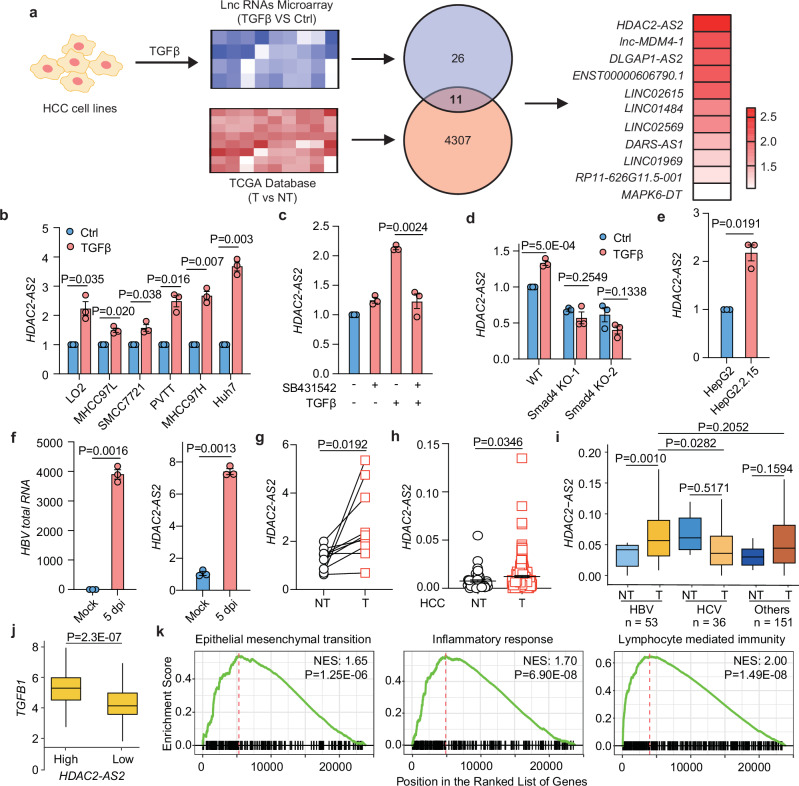
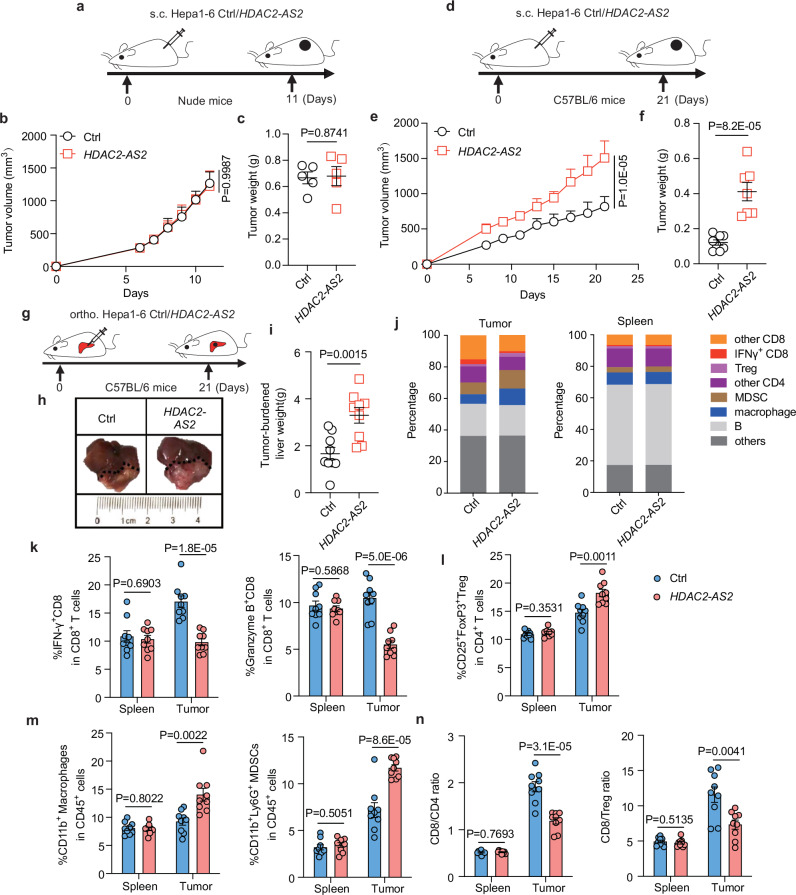
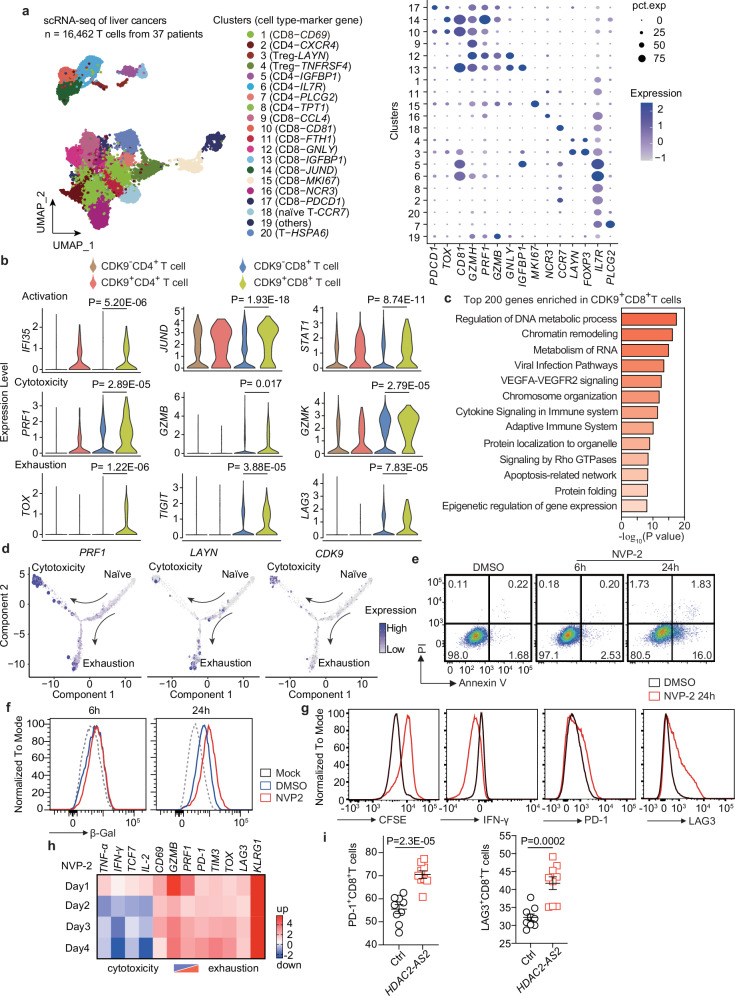
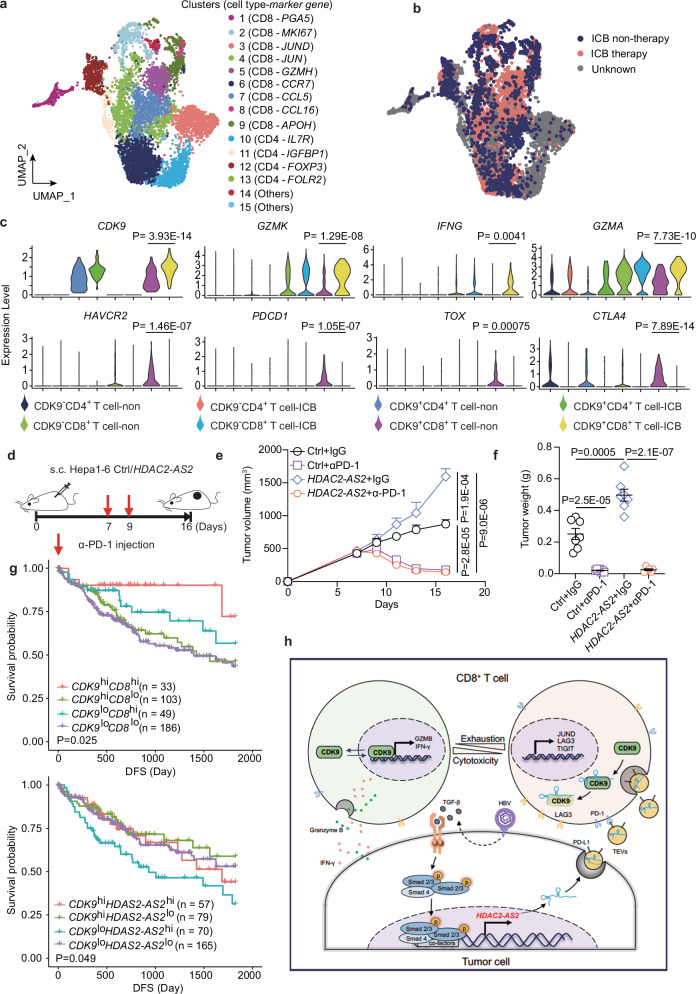
Hepatocellular carcinoma (HCC) is one of the most common malignancies worldwide. Extracellular vesicles (EV) are critical mediators of intercellular communication within the tumor microenvironment, and cancer-cell-secreted EVs often facilitate cancer progression. Here we show that in HBV-associated HCC, tumor-cell-derived EVs contain a TGFβ-inducible long noncoding RNA, termed HDAC2-AS2. EVs enriched with HDAC2-AS2 facilitate cancer progression by suppressing cytotoxicity of intra-tumor CD8+ T cells. Mechanistically, in activated cytotoxic CD8+ T cells, translocation of the transcription factor cyclin-dependent kinase 9 (CDK9), to the cytoplasm is critical for functional integrity. HDAC2-AS2 targets and blocks cytosolic CDK9, and this results in exhaustion of PD-1+CD8+ T cells and suppression of IFN-γ+CD8+ T cell cytotoxicity. Notably, we demonstrate that low CDK9 and high HDAC2-AS2 expressions are associated with poor survival of HCC, which can be rescued by anti-PD-1 therapy. These findings emphasize the significance of tumor-derived EVs in suppressing antitumor CD8+ T cell immunity to promote tumorigenesis, and highlight extracellular HDAC2-AS2 as a promising biomarker and therapeutic target for HCC.


Conflict of interest statement

Competing interests: The authors declare no competing interests.

Figures

Fig. 1
Fig. 1. HDAC2-AS2 was upregulated by TGFβ.
a Experimental layout to identify TGFβ dependent lncRNAs. HepG2, Huh7, MHCC97, and PVTT cells were treated with TGFβ (2.5 ng/mL) for 8 h. RNA was harvested for microarray analysis of lncRNAs. Then our lncRNA microarray (TGFβ treatment vs. ctrl) merged with upregulated lncRNAs in the TCGA database (HCC samples vs. non-tumor tissues). qRT-PCR validation of indicated 11 lncRNAs relative to β-actin in MHCC97H cells treated with TGFβ (2.5 ng/mL) for 48 h. b qRT-PCR validation of HDAC2-AS2 relative to β-actin in LO2, PVTT, Huh7, SMCC7721, MHCC97L, and MHCC97H cells treated with TGFβ (2.5 ng/mL) for 48 h. c MHCC97H cells were pretreated with 10 μM SB431542 for 1 h, followed by TGFβ treatment for 48 h. HDAC2-AS2 expression was detected by qRT-PCR. d qRT-PCR analysis of HDAC2-AS2 expression relative to β-actin in SMCC7721 WT and Smad4 KO cells treated with TGFβ (2.5 ng/mL) for 48 h. e qRT-PCR analysis of HDAC2-AS2 relative to β-actin in HepG2 and HepG2.2.15 cells. f qRT-PCR analysis of HDAC2-AS2 relative to β-actin in HepG2-NTCP cell line after HBV infection. g qRT-PCR analysis of HDAC2-AS2 expression relative to β-actin in human HCC tissues and paired adjacent noncancerous tissues (n = 10 for paired samples). h Elevated HDAC2-AS2 expression in the tumor of HCC (n = 50, 200 for NT and T samples) in the TCGA database. i Boxplot showing the expression levels of HDAC2-AS2 in tumor (T) and nontumor tissues (NT) sourced from the TCGA-LIHC database, classified according to their etiology (n = 53, 36, 151 for samples of HBV, HCV, and others, respectively). The boxplots denote the median with a quartile range (25–75%), and the length of whiskers represents 1.5× the IQR. j The expresision levels of TGFB1 in HDAC2-AS2 low- (n = 157) and high- (n = 83) expressing tumor and nontumor tissues. The boxplots denote the median with a quartile range (25–75%), and the length of whiskers represents 1.5× the IQR. k GSVA analysis of epithelial-mesenchymal transition, inflammatory response, and lymphocyte-mediated immunity signatures in HDAC2-AS2 high-expressing tumor tissues. The P-values were calculated based on a two-tailed permutation test. NES, normalized enrichment score. Error bars represent mean ± SEM for three independent replicates. Statistical analyses were determined by two-tailed Student’s t-test (bj). Source data are provided as a Source Data file.
Fig. 2
Fig. 2. HDAC2-AS2 promoted tumor growth in C57BL/6 mice and impaired CD8+ T cell function.
a Experimental layout to analyze tumor growth in nude mice (ac). Mice were subcutaneously xenografted with Hepa1-6-Ctrl or HDAC2-AS2 cells (3 × 106) for 11 days (n = 5 mice for each group). b and c Tumor volume (b) and Tumor weight (c) were measured (n = 5). d Experimental layout to analyze tumor growth in C57BL/6 mice. Mice were subcutaneously xenografted with Hepa1-6-Ctrl (n = 8) or HDAC2-AS2 cells (n = 7) (1 × 107) for 21 days. e and f Tumor volume (e) and Tumor weight (f) were measured in tumor-bearing C57BL/6 mice. g Experimental layout to analyze immune cells in C57BL/6 mice (n = 9 mice per group). Mice were orthotopically xenografted with Hepa1-6-Ctrl or HDAC2-AS2 cells (3 × 106) for 2 weeks. Immune cells in the tumor and spleen were harvested and analyzed. h and i Tumor weight was shown in C57BL/6 mice orthotopically xenografted with Hepa1-6-Ctrl or HDAC2-AS2 cells. n = 9 mice per group. j Immunophenotyping of the percentage of individual cell populations in spleen and tumor tissues by flow cytometry. k The percentage of IFN-γ+CD8+ T cells and Granzyme B+ CD8+ T cells in the spleen and tumor tissues was shown. n = 9 mice per group. l and m Flow cytometry quantification of the percentage of CD25+FoxP3+ Treg (l, gated in CD4+CD45+ cells), CD11b+ TAMs and CD11b+ Ly6G+ MDSCs (m gated in CD45+ cells) in spleen and tumor tissues. n = 9 mice per group. n Flow cytometry quantification of CD4/CD8 ratio and CD8/ Treg ratio in spleen and tumor tissues, gated in CD3+CD45+ cells. n = 9 mice per group. All error bars represent mean ± SEM. Statistical analyses were determined by two-way ANOVA (b, e) or two-tailed Student’s t-test (c, f, i, kn). Source data are provided as a Source Data file.
Fig. 3
Fig. 3. HDAC2-AS2 released inside extracellular vesicles by HCC cells.
a qRT-PCR analysis of HDAC2-AS2 expression relative to the spike-in control λ polyA+ RNA in the TCS of MHCC97L and MHCC97H cells treated with 2 μg/mL RNase A alone or in combination with 0.1% Triton X-100 for 20 min. b Representative electron microscopy images of EVs. Scale bar: 100 nm. c NTA analysis of EVs. d Immunoblotting analysis of CD9, TSG101, GAPDH and VDAC1. Representative images are shown from three independent replicates. e EVs were identified using CD63 antibody, Iso isotype control. f qRT-PCR analysis of HDAC2-AS2 expression relative to spike-in control λ polyA+ RNA in the EVs from MHCC97L and MHCC97H cells treated with 2 μg/mL RNase A alone or in combination with 0.1% Triton X-100 for 20 min. UD undetectable. g and h qRT-PCR analysis of the HDAC2-AS2 levels relative to spike-in control λ polyA+ RNA in the EVs derived from MHCC97H Rab27A knockdown stable cell line (g), or from MHCC97H after treated with 5 μM GW4869 for 48 h (h). i qRT-PCR analysis of HDAC2-AS2 levels relative to spike-in control λ polyA+ RNA in the EVs of MHCC97L and MHCC97H cells that were treated with TGFβ (2.5 ng/mL) for 48 h. j MHCC97H cells were treated with 2.5 ng/mL TGFβ for 24 h. qRT-PCR analysis was performed to assess the expression of related genes relative to β-actin in ctrl and TGFβ-treated cells. k qRT-PCR analysis of HDAC2-AS2 expression relative to spike-in control λ polyA+ RNA in the EVs of HepG2 and HepG2.2.15 cells treated with RNase A (2 μg/mL) for 20 min. l Representative electron microscopy images of EVs isolated from plasma of healthy donors (HD, n = 9) and HCC patients (n = 14). Scale bar: 100 nm. m Immunoblotting analysis of CD9, VDAC1 expression in EVs isolated from plasma of HD and HCC patients. Representative images are shown from three independent replicates. n qRT-PCR analysis of HDAC2-AS2 expression relative to spike-in control λ polyA+ RNA in the EVs isolated from plasma of HD (n = 9) and HCC patients (n = 14). EVs were purified by ultracentrifugation (bi, kn). Error bars represent mean ± SEM for three independent replicates. Statistical analyses were determined by two-tailed Student’s t-test (a, fk, n). Source data are provided as a Source Data file. EVs extracellular vesicles, HD healthy donors.
Fig. 4
Fig. 4. HDAC2-AS2 Extracellular vesicles impaired CD8+ T cells function.
a Flow cytometry analysis of GFP+ immune cells in tumors of orthotopically xenografted with Hepa1-6-Ctrl-EGFP-mCD63 or Hepa1-6-HDAC2-AS2-EGFP-mCD63 cells for two weeks (n = 6 mice). Mø: macrophage. b qRT-PCR analysis of HDAC2-AS2 levels in infiltrated CD8+ T, CD4+ T, and Mø in tumors orthotopically xenografted with Hepa1-6-Ctrl-EGFP-mCD63 or Hepa1-6-HDAC2-AS2-EGFP-mCD63 cells for two weeks. qRT-PCR results represent fold change relative to the macrophage group after normalization to β-actin (three independent replicates). Mø macrophages, UD undetectable. c DiI-labeled EVs from Hepa1-6-Ctrl or HDAC2-AS2 cells were added to activated mouse CD8+ T cells for 24 h, then DiI signal was detected by confocal microscopy. Mock is PBS treatment. Scale bar: 5 μm. EVs were purified by ultracentrifugation. Representative images are shown from three independent replicates. d qRT-PCR analysis of HDAC2-AS2 relative to β-actin in mouse CD8+ T cells after incubating with Ctrl and HDAC2-AS2 containing EVs for 24 h (three independent replicates). UD: undetectable. e Activated human CD8+ T cells were incubated with EVs derived from MHCC97L-Ctrl and MHCC97L-HDAC2-AS2 cells for 24 h, HDAC2-AS2 expression was detected by qRT-PCR and normalized to β-actin (three independent replicates). f and g Activated mouse CD8+ T cells were treated with EVs from Hepa1-6-Ctrl or HDAC2-AS2 cells for 48 h. Apoptosis was detected by western blot (f) and flow cytometry (g) (three independent replicates). h Activated mouse CD8+ T cells were infected with retrovirus ctrl or retrovirus-HDAC2-AS2 for 48 h, and apoptosis was detected by flow cytometry (three independent replicates). i Activated human CD8+ T cells were infected with lentivirus ctrl or lentivirus-HDAC2-AS2 for 48 h, and apoptosis was detected by flow cytometry (three independent replicates). j Flow cytometry quantification of the percentage of Annexin-V+ CD8+T cells in tumor tissues from orthotopically xenografted mice (n = 6 mice). k Activated human CD8+ T cells were incubated with EVs derived from MHCC97L-Ctrl and MHCC97L-HDAC2-AS2 cells for 48 h, then the indicated signal was detected by flow cytometry. l Activated human CD8+ T cells were incubated with EVs derived from TGFβ treated ctrl and HDAC2-AS2 knockdown MHCC97H cells for 48 h. The protein levels of cleaved PARP and caspase3 were detected by western blot. EVs were purified by VEX reagent. Representative images are shown from three independent replicates. m Activated human CD8+ T cells were incubated with EVs derived from ctrl and HDAC2-AS2 knockdown MHCC97H cells for 48 h, then the indicated signal was detected by flow cytometry. EVs were purified by VEX reagent. Error bars represent mean ± SEM. Statistical analyses were determined by a two-tailed Student’s t-test (a, b, d, e, gj). Source data are provided as a Source Data file. Mφ macrophage.
Fig. 5
Fig. 5. HDAC2-AS2 targeted CDK9 to impair the function of CD8+ T cells.
a Silver staining of the SDS-PAGE gel containing aliquots of samples derived from proteins pulled down by HDAC2-AS2 (right lane) or its antisense RNA (left lane) in mouse CD8+ T cells. The arrows indicate the gels submitted for mass-spectrometry, identifying CDK9 as the band unique to HDAC2-AS2. Representative images are shown from three independent replicates. b Western blot analysis of the interaction of CDK9 with HDAC2-AS2 (treated the same as panel a). Representative images are shown from three independent replicates. c RIP analysis of the interaction between CDK9 and HDAC2-AS2 (three independent replicates). d The expression of CDK9 in naïve and activated mouse CD8+ T cells (24, 48, 72 h) was detected by confocal microscopy. Scale bar: 5 μm. Representative images are shown from three independent replicates. e Western blot analysis of CDK9 expression in nuclear and cytoplasmic fractions of activated mouse CD8+ T cells and MHCC97H cells. Representative images are shown from three independent replicates. f Activated mouse CD8+ T cells were treated with EVs from Hepa1-6-Ctrl or HDAC2-AS2 cells for 48 h, mock is PBS treatment. CDK9 expression was detected by western blotting. EVs were purified by ultracentrifugation. Representative images are shown from three independent replicates. g The expression of CDK9 in activated mouse CD8+ T cells of retrovirus ctrl and retrovirus-HDAC2-AS2 infection was observed by confocal microscopy. Scale bar: 5 μm. Representative images are shown from three independent replicates. h FISH assay showing the localization of HDAC2-AS2 and CDK9 in activated human CD8+ T cells of lentivirus ctrl and lentivirus-HDAC2-AS2 infection. Scale bar: 5 μm. Representative images are shown from three independent replicates. i Experimental layout for single-cell Ti-ATAC-seq 2 to analyze chromatin accessibility and T cell receptor (TCR) clonality. j The UMAP projection displays T cells from HCC patients, illustrating the landscape of TCR clonality (left; indicated by the sizes of TCR clonotypes) and chromatin accessibility (right) from Ti-ATAC-seq 2 datasets. Each color represents a T-cell cluster. k The chromatin accessibility, indicated by gene scores of the indicated genes, is overlaid on the UMAP embedding. l Violin plot showing the chromatin accessibility as indicated by gene scores of CDK9 of the T-cell clusters. Each color represents a T-cell cluster, the cells of each cluster were obtained from patients (n = 9). mo Violin plots showing the gene scores of indicated genes (m) and ChromVAR TF-motif bias-corrected deviation scores of indicated TF regulators (n) across the CD8 T-cell clusters. The cytotoxicity of the cluster is indicated by the gene scores of GZMK and PRF1, whereas the exhaustion of the cluster is indicated by the gene scores of TOX and PDCD1. (o). Boxplot showing the T-cell clonal expansion as indicated by the log10 (clonotype size +1) across the CD8 T-cell clusters. The boxplots denote the median with a quartile range (25–75%), and the length of whiskers represents 1.5x the IQR. The cells of each cluster were obtained from patients (n = 9). Statistical analyses were determined by a two-tailed Student’s t-test (c, o). Source data are provided as a Source Data file. Cyto cytoplasmic, Nuc nuclear, RV retrovirus.
Fig. 6
Fig. 6. Single-cell transcriptomic analysis highlighted the enhanced cytotoxicity of CDK9+CD8+ T cells.
a Left: The scRNA-seq (GEO: GSE151530) UMAP projection of the 16,462 T cells from 37 patients with liver cancer. Each color represents a T-cell cluster. Cell types and marker genes are assigned to each cluster. Right: Expression levels of marker genes identified for clusters. b Violin plot showing the expression profiles of genes related to T-cell activation (top), cytotoxicity (middle), and exhaustion (bottom). A Wilcoxon Rank Sum test was performed to determine the P values (two-tailed test). c Pathway enrichment of top 200 marker genes enriched in CDK9+CD8+ T cells as compared to CDK9-CD8+ T cells using Metascape analysis. Significance shown by the Bonferroni-corrected P values (two-tailed test).  d The gene expression of PRF1, LAYN, CDK9 overlaid on the cell trajectory projection. The size and color represent the gene expression levels. e Activated mouse CD8+ T cells were treated with 250 nM NVP-2 for 6 h or 24 h, and apoptotic cells were detected by flow cytometry. f Activated mouse CD8+ T cells were treated with 250 nM NVP-2 for 6 h or 24 h, and senescent cells were detected by flow cytometry. β-Gal positive cells are shown as senescent cells. g Activated mouse CD8+ T cells were treated with 250 nM NVP-2 for 24 h, and then the indicated signal was detected by flow cytometry. h Activated mouse CD8+ T cells were treated with 100 nM NVP-2 for indicated days, then the cytotoxicity- and exhaustion-related genes were determined by qRT-PCR. The heat map showed the fold changes when compared to the DMSO group each day. i Flow cytometry quantification of the percentage of PD-1+CD8+T and LAG3+ CD8+T in tumor tissues from orthotopically xenografted mice (n = 9 for each group). Error bars represent mean ± SEM. Statistical analyses were determined by a two-tailed Student’s t-test. Source data are provided as a Source Data file.
Fig. 7
Fig. 7. Immune checkpoint blockade (ICB) disrupted the HDAC2-AS2-CDK9 axis to empower CDK9+ CD8+ T cell cytotoxicity.
a The scRNA-seq (GEO: GSE151530 and GSE149614) UMAP projection of the tumor-infiltrating T cells from patients with liver cancer. Each color represents a T-cell cluster. Cell types and marker genes are assigned to each cluster. b UMAP plot showing the information of patients with or without immune checkpoint blockade (ICB) therapy. c Violin plot showing the expression profiles of indicated genes. These T-cell groups were grouped based on the ICB therapy and expression of CD4, CD8A, and CDK9 in each cell. A Wilcoxon Rank Sum test was performed to determine the P values (two-tailed test). d Experimental layout to analyze the effect of anti-PD-1treatment in inhibiting tumor growth in C57BL/6 WT mice (n = 7 mice). Mice were subcutaneously xenografted with Hepa1-6-Ctrl or HDAC2-AS2 cells (1 × 107) for 16 days and received anti-PD-1 treatment at day 7 and day 9. e and f Tumor volumes (e) and Tumor weight (f) are shown in C57BL/6 WT mice subcutaneously xenografted with Hepa1-6-Ctrl or HDAC2-AS2 cells and received anti-PD-1 treatment. n = 7. g The disease-free survival curve based on the TCGA HCC data showing patients with higher expression of CDK9 and CD8A, or CDK9 and HDAC2-AS2 in tumor had better prognosis. Log-rank test was performed to determine the P values. h Working model. Error bars represent mean ± SEM. Statistical analyses were determined by two-way ANOVA (e) or two-tailed Student’s t-test (f). Source data are provided as a Source Data file.

References

    1. Sung, H. et al. Global Cancer Statistics 2020: GLOBOCAN estimates of incidence and mortality worldwide for 36 cancers in 185 countries. CA Cancer J. Clin.71, 209–249 (2021). - PubMed
    1. Forner, A., Reig, M. & Bruix, J. Hepatocellular carcinoma. Lancet391, 1301–1314 (2018). - PubMed
    1. Llovet, J. M. et al. Hepatocellular carcinoma. Nat. Rev. Dis. Prim.7, 6 (2021). - PubMed
    1. Yoh, T. et al. Surgery for recurrent hepatocellular carcinoma: achieving long-term survival. Ann. Surg.273, 792–799 (2021). - PubMed
    1. Kulik, L. & El-Serag, H. B. Epidemiology and management of hepatocellular carcinoma. Gastroenterology156, 477–491.e471 (2019). - PMC - PubMed

MeSH terms