. 2025 Feb 28;8(1):338.
doi: 10.1038/s42003-025-07654-3.

Elevated levels of S100A8 and S100A9 exacerbate muscle mitochondrial fragmentation in sepsis-induced muscle atrophy

Affiliations

Elevated levels of S100A8 and S100A9 exacerbate muscle mitochondrial fragmentation in sepsis-induced muscle atrophy

Dongqin Huang et al. Commun Biol. .

Abstract

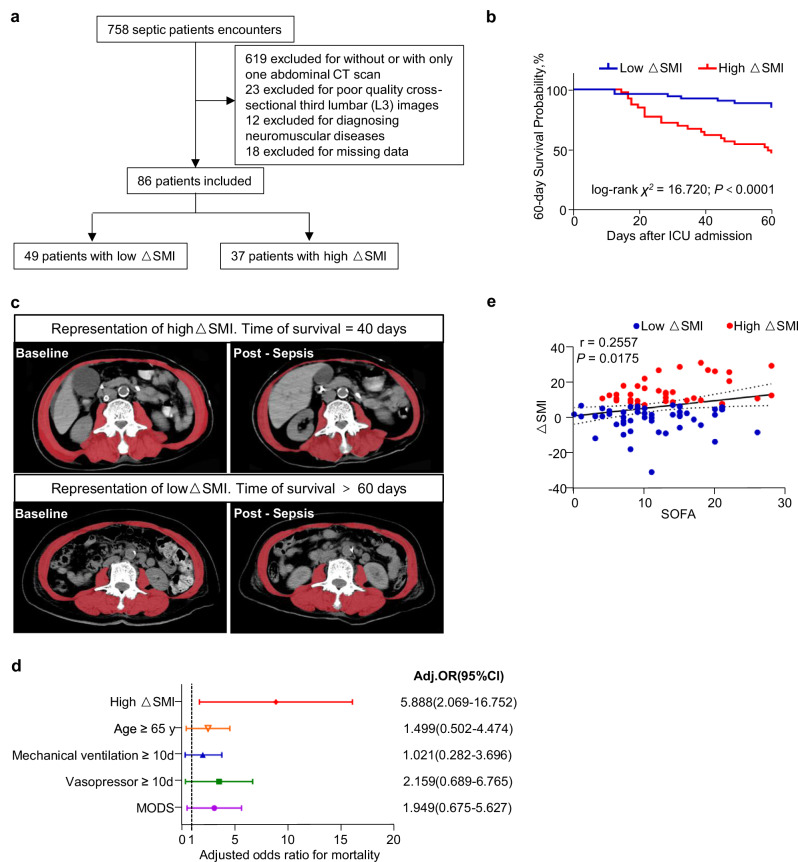
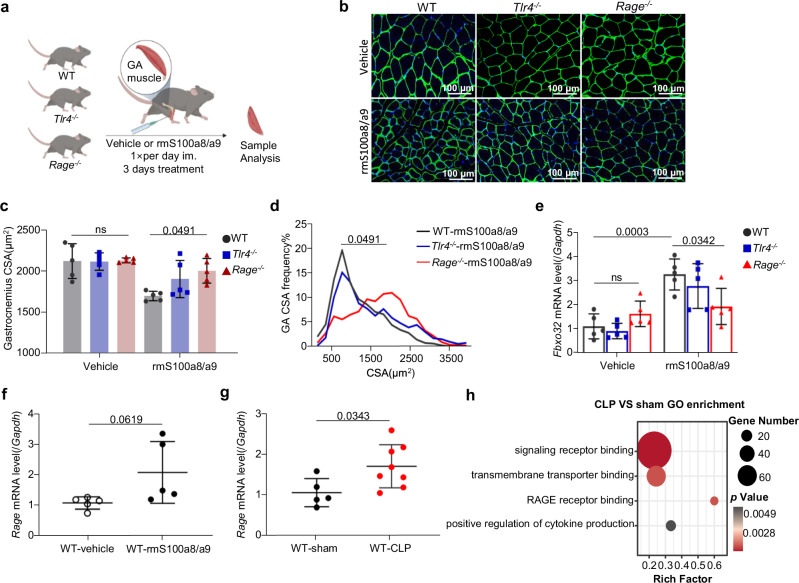
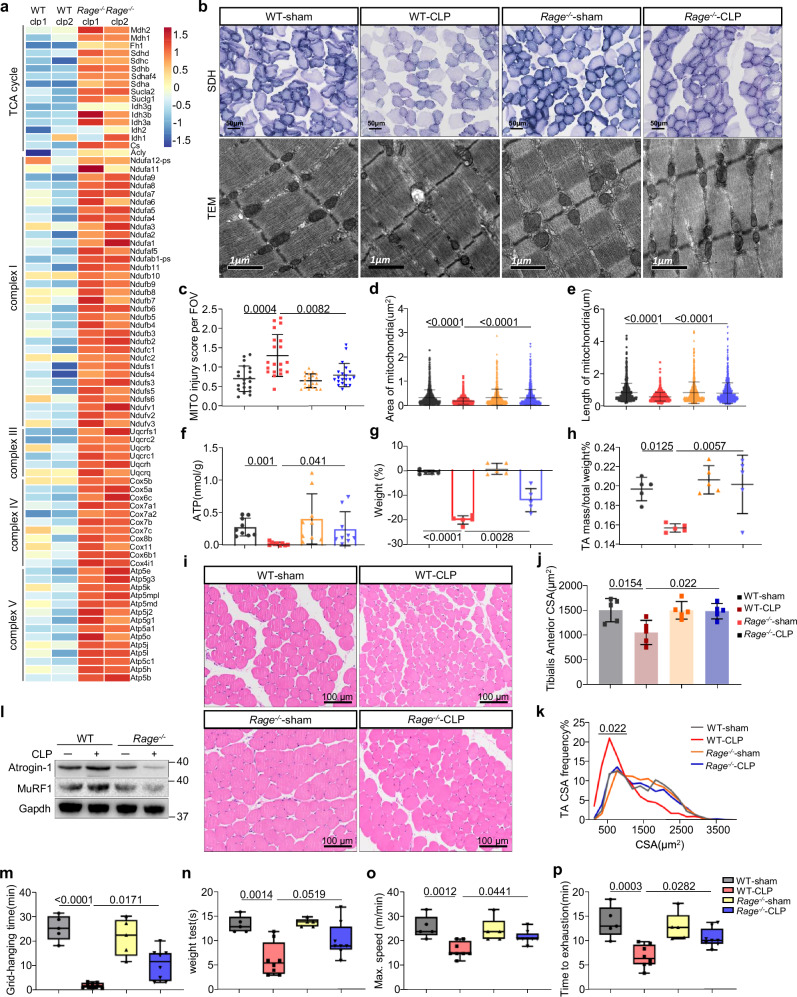
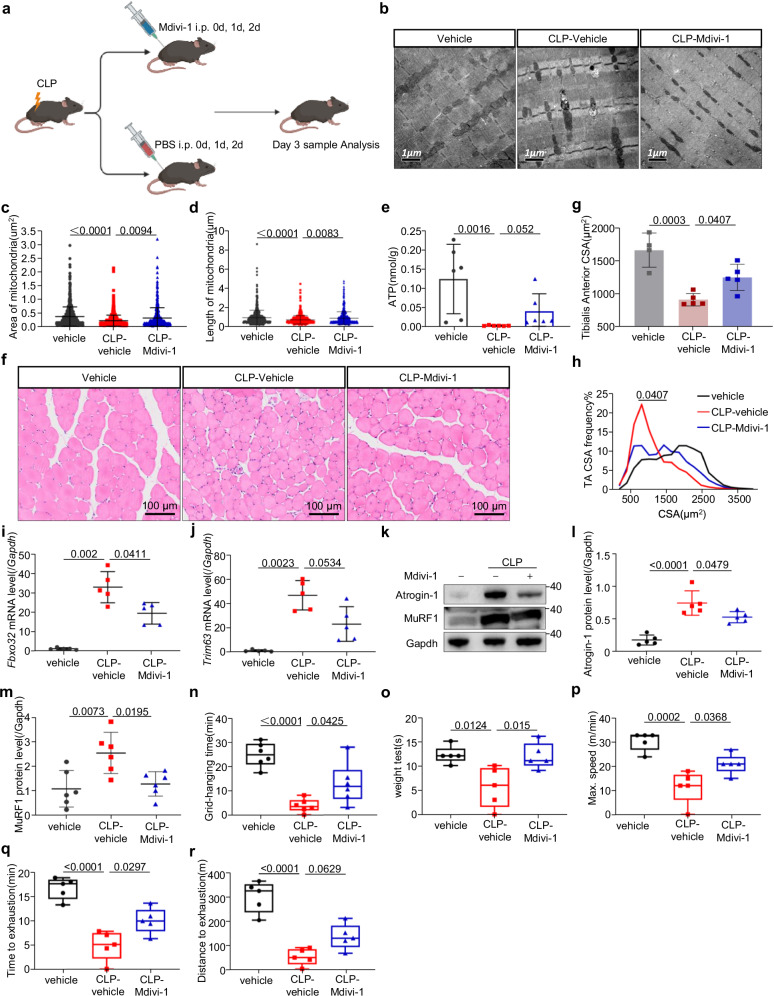
Sepsis-induced skeletal muscle atrophy is common in septic patients with the increases risk of mortality and is associated with myocellular mitochondrial dysfunction. Nevertheless, the specific mechanism of sepsis muscle atrophy remains unclear. Here we conducted a clinical retrospective analysis and observed the elevation of skeletal muscle index (ΔSMI) was an independent risk factor for 60-day mortality in septic patients. Moreover, in mouse model of sepsis, the skeletal muscle atrophy was also observed, which was associated with the upregulation of S100a8/a9-mediated mitochondrial dysfunction. Inhibition of S100a8/a9 significantly improved mitochondrial function and alleviated muscle atrophy. Conversely, administration of recombinant S100a8/a9 protein exacerbated mitochondrial energy exhaustion and myocyte atrophy. Mechanistically, S100a8/a9 binding to RAGE induced Drp1 phosphorylation and mitochondrial fragmentation, resulting in muscle atrophy. Additionally, RAGE ablation or administration of Drp1 inhibitor significantly reduced Drp1-mediated mitochondrial fission, improved mitochondrial morphology and function. Our findings indicated the pivotal role of S100a8/a9 in driving the mitochondrial fragmentation in septic muscle atrophy. Targeting S100a8/a9-RAGE-initiated mitochondrial fission might offer a promising therapeutic intervention against septic muscle atrophy.


Conflict of interest statement

Competing interests: The authors declare no competing interests.

Figures

Fig. 1
Fig. 1. The high skeletal muscle index (△SMI) is an independent risk factor for 60-day mortality in septic patients.
a Study flow diagram for septic patients. b Kaplan–Meier survival curves (60-day) stratified by △SMI. c Representative CT scans at the third lumbar vertebra level in two septic patients at baseline and post-sepsis. The red shadows show the skeletal muscle area. d Adjusted 60-day mortality according to △SMI category, age, MODS, vasopressor, and mechanical ventilation, is analyzed by multivariable logistic regression. The values shown are the adjusted odds ratio (aOR, 95% confidence interval). Low △SMI, Age <65 y, Mechanical ventilation <10 d, Vasopressor <10 d, non-MODS are defined as reference. e Correlation of the △SMI level with sequential organ failure assessment (SOFA) score. Data are presented as Two-tailed Spearman’s rank correlation. The adjusted odds ratios with 95% confidence intervals are shown. Each dot represents an individual subject.
Fig. 2
Fig. 2. Skeletal muscle atrophy is associated with mitochondrial dysfunction in septic mouse model.
a Body weight at 0 and 1, 3, 7, and 14 days after CLP. (control and CLP 14 d, n  =  6 mice; CLP 1 d and 3 d, n  =  15 mice; CLP 7 d, n  =  12 mice) b Representative haematoxylin and eosin (H&E) staining images from tibialis anterior (TA) at 0, 1, 3, 7, and 14 days after CLP. Scale bars, 100 μm. c Fiber CSA (μm2) of TA muscle from 0 day up to 14 days after CLP. (control, n  =  4 mice; CLP 1 d, 3 d, 7 d and 14 d, n = 5 mice). dFbxo32 and Trim63 expression (mRNA) in TA muscle. (n  =  5 per group). *p < 0.05, **p < 0.01, ***p < 0.001 of Fbxo32 mRNA level, ##p < 0.01, ###p < 0.001 of Trim63 mRNA level. e Part of the top 20 of KEGG and GO enrichment analysis of muscles from CLP-3d or sham-3d group. (n = 3 per group). Red arrows indicate mitochondria related pathways. f Heatmap of genes encoding metabolic enzymes involved in the TCA cycle and metabolic enzymes contributing to the electron transport chain 3 d after CLP or sham. (n = 3 per group). Gene expression values expressed as log2(FC). FC: fold change. g Quantification of succinate dehydrogenase (SDH) staining intensity of TA cross-section. graph showing SDH staining intensity per field of view (FOV). Each symbol represents a FOV of SDH images. Each group has 5 mice and 4 FOVs were randomly selected for assay from each animal. h Representative intermyofibrillar mitochondria transmission electron microscopy (TEM) images of TA muscle 3 d after CLP or sham. i Graphs showing the level of total ATP in TA muscles 3 d after CLP or sham. (sham, n = 5 mice, CLP 3 d, n = 8 mice). Bars show mean ± SEM (c, g, i) and median with interquartile range (a, d). Two-sided P values were determined by one-way analysis of variance (ANOVA), followed by Tukey’s multiple comparison test (c), the Kruskal–Wallis with Dunn’s multiple comparison test (a, d), and unpaired t-test (g, i).
Fig. 3
Fig. 3. S100a8/a9 contribute to sepsis-induced skeletal muscle atrophy and mitochondrial dysfunction.
a Volcano plots showing the gene expression fold change (x-axis, log2 scale) and p-value significance (y-axis, -log10 scale) of CLP 3 d versus sham 3 d skeletal muscles. Dotted lines indicate a Log10FDR threshold of >0.05 or Log2FC (fold change) of ±2. (n = 3 per group). Expression level of S100a8(b) and S100a9(c) measured by qPCR in tibialis anterior (TA) muscle at 0 and 1, 3, 7, and 14 days after CLP (n = 7 per group). Representative western blots images (d) and quantification protein levels of S100a8/a9 (e) in TA muscle at 0 and 1, 3, 7 and 14 days after CLP (n = 4 per group). Correlation of S100a8 mRNA expression with total weight (f), TA muscle weight (g), and Fbxo32 mRNA expression (h). Each symbol represents one animal (control, n  =  8 mice; CLP 1 d, n  =  8 mice; CLP 3 d, n  =  7 mice; CLP 7 d, n  =  8 mice; CLP 14 d, n  =  7 mice). i Correlation of S100a8 mRNA expression with ATP content. Each symbol represents one animal (sham 3 d, n  =  5 mice; CLP 3 d, n  =  7 mice). Data are presented as Two-tailed Spearman’s rank correlation. Dots represent individual subjects. Dashed lines represent 95% confidence intervals. j Representative gastrocnemius (GA) cross-section 3-days after intramuscular injection with rmS100a8/a9 or vehicle reagent. DAPI, blue; laminin, green. Scale bar, 100 µm. k Fiber CSA (μm2) of GA muscle in (j). (n = 6 per group). l mRNA expression level of Fbxo32 3-days after intramuscular injection with rmS100a8/a9 or vehicle reagent (n = 4–5 per group). m Representative images of GA intermyofibrillar mitochondria by TEM after intramuscular injection with rmS100a8/a9 or vehicle reagent. Scale bars, 0.5 μm. n Mitochondria injury score from the statistics of (m). Bar graph presents mitochondrial injury score per FOV. Each symbol represents a TEM image of one FOV. There were 4 mice per group, and 5 FOVs were randomly selected for statistic from each animal. o Total ATP content in GA muscles after intramuscular injection with rmS100a8/a9 normalized to vehicle. (n = 6 per group). p Graph showing fiber CSA (μm2) of TA muscle after intraperitoneally injection with paquinimod or vehicle reagent for 3 consecutive days after CLP. (vehicle, n  =  4 mice; CLP- vehicle, n  =  5 mice; CLP- paquinimod, n  =  5 mice). q The representative western blots images of Atrogin-1 and MuRF1 in muscle tissue lysates after intraperitoneally injection with paquinimod or vehicle reagent for 3 consecutive days after CLP. r Representative TEM images of TA intermyofibrillar mitochondria. Scale bars, 0.5 μm. s Graph showing the levels of total ATP in the muscle tissue lysates (n  =  5 per group). Graphs showing grid-hanging capacity (t), treadmill maximal speed (u), run time to exhaustion (v). (t, n  =  8 mice per group; u, v, n = 6 mice per group). Bars show mean ± SEM (e, k, l, o, p, sv) and median with interquartile range (b, c, n). Two-sided P values were determined by unpaired t-test (k, l, o) and Mann–Whitney U-test (n), and one-way ANOVA, followed by Tukey’s multiple comparison test (e, p, sv), the Kruskal–Wallis with Dunn’s multiple comparison test (b, c).
Fig. 4
Fig. 4. S100a8/a9 induces skeletal muscle atrophy via RAGE.
a Experimental scheme showing gastrocnemius muscles of WT, Rage-/- and Tlr4-/-mice injected with rmS100a8/a9 (100 ng/muscle) or vehicle (PBS) for three consecutive days. Representative gastrocnemius (GA) cross-section images (b) and quantitative analysis of fiber CSA (μm2) (c) and distribution of CSA area (d, %) after rmS100a8/a9 treatment (n  =  5 per group). DAPI, blue; laminin, green. Scale bar, 100 µm. e Graph showing mRNA level of Fbxo32 in the GA muscle by qPCR (n  =  5 per group). f Graph showing mRNA level of Rage 3 days after intramuscular injection with rmS100a8/a9 or vehicle reagent in the GA muscle by qPCR (n = 5 per group). g Graph showing mRNA level of Rage 3 days after CLP or sham operation in the TA muscle by qPCR (sham, n = 5 mice; CLP, n = 8 mice). h GO analysis of RAGE receptor-related pathways between CLP 3 d and sham controls (n = 3 per group). Bars show mean ± SEM (c, e, f, g). ns, not significant. Two-sided P values were determined by unpaired t-test (f, g), one-way ANOVA with Games-Howell’s multiple comparisons test (c), and two-way ANOVA with Tukey’s multiple comparisons test (e).
Fig. 5
Fig. 5. RAGE deficiency improves muscle mitochondrial morphology and ATP generation and alleviates skeletal muscle atrophy in sepsis.
a Heatmap of genes encoding metabolic enzymes involved in the TCA cycle and metabolic enzymes contributing to the electron transport chain. Gene expression values were expressed as log2(FC) comparing Rage-/- and WT mice 3-days after CLP model. (n  =  3 per group) FC: fold change. b Representative images of succinate dehydrogenase (SDH) staining (above, Scale bar, 50 µm.) and TEM (below, Scale bar, 1 µm.) of WT and Rage-/- mice 3 d after CLP or sham operations in tibialis anterior (TA) muscle tissue. c Graph showing mitochondria injury score of Rage-/- and WT 3 days after CLP or sham operation in TA muscle tissue. Bar graph presents mitochondrial injury score per FOV. Each symbol represents a TEM image of one FOV. There were 4 mice per group, and 5 FOVs were randomly selected for statistic from each animal. d, e Quantitative analysis of Intermyofibrillar (IMF) mitochondria area and length from TEM images as in (b) (n = 4 per group, total mitochondria quantified: n = 801 wt sham, n = 834 wt CLP, n = 769 Rage-/- sham, n = 863 Rage-/- CLP). f Graph showing the levels of total ATP in TA muscle tissue lysates of WT and Rage-/- mice 3 d after CLP or sham operations (n  =  9 per group). Graphs showing the body weight (g) and TA muscle weight (h) of Rage-/- and WT 3-days after CLP or sham operations (n  =  5 per group). Representative TA cross-section H&E images (i) and quantitative analysis of fiber CSA (μm2) (j) and distribution of CSA area (k, %) of WT and Rage-/- mice 3 d after CLP or sham operations (n  =  5 per group). Scale bar, 100 µm. l Graph showing the representative western blots images of Atrogin-1 and MuRF1 in muscle tissue lysates. Graphs showing grid-hanging capacity (m), weight test(n), treadmill maximal speed (o), run time to exhaustion (p) of WT and Rage-/- mice 3 d after CLP or sham operations. (sham, n  =  5 mice, CLP, n = 8 mice). Bars show mean ± SEM (g, h, j, mp) and median with interquartile range (cf). Two-sided P values were determined by two-way ANOVA with Tukey’s multiple comparisons test (g, h, j, k, mp) and with Sidak’s multiple comparisons test (cf).
Fig. 6
Fig. 6. S100a8/a9-RAGE triggers Drp1 phosphorylation-mediated muscle mitochondrial fragmentation in sepsis.
a Representative confocal images of the mitochondrial network (VDAC, green) in EDL muscle fibers of WT and Rage-/- mice 3 d after CLP or sham operations. Yellow arrows show the longitudinal pattern of interconnected mitochondria alongside the myofibrils, and the red arrows show the mitochondrial disconnection. VDAC: voltage-dependent anion channel. Scale bar, 10 µm and 5 µm. b Representative images of western blots of mitochondrial dynamics regulatory proteins (p-Drp1616, Drp1, Fis1, Mfn2, and Opa1) of WT and Rage-/- mice 3 d after CLP or sham operations in tibialis anterior (TA) muscle tissue lysates. c Graph showing the relative protein level of p-Drp1616 normalized to Drp1 as reference in (b) (n  =  5 per group). Representative TEM images (d, Scale bar, 1 µm) and quantitative analysis of intermyofibrillar mitochondria area (e) and length (f) of TA muscle after intraperitoneally injection with paquinimod or vehicle reagent for 3 consecutive days after CLP (n = 4 per group, total mitochondria quantified: n = 291 vehicle, n = 433 CLP vehicle, n = 430 CLP paquinimod). Representative images of western blots of p-Drp1616 and Drp1 in TA muscle tissue lysates (g) and quantitative analysis of p-Drp1616 protein (h) 3 days after paquinimod or vehicle treatment with WT septic mice (n  =  5 per group). Bars show mean ± SEM (c, h) and median with interquartile range (e, f). Two-sided P values were determined by two-way ANOVA with Tukey’s multiple comparisons test (c), one-way ANOVA with Tukey’s multiple comparison test (h), and the Kruskal–Wallis with Dunn’s multiple comparison test (e, f).
Fig. 7
Fig. 7. Inhibition of Drp1 ameliorates septic muscle atrophy by improving mitochondrial morphology and ATP generation.
a Experimental scheme showing WT mice intraperitoneally injected with Mdivi-1(10 mg/kg) or vehicle (PBS) for 3 consecutive days after CLP. Representative TEM images (b) and quantitative analysis of intermyofibrillar mitochondria area (c) and length (d) 3 days after Mdivi-1 or vehicle reagent treated with WT septic mice. Scale bars, 1 μm. (n = 4 per group, total mitochondria quantified: n = 713 vehicle, n = 650 CLP vehicle, n = 425 CLP Mdivi-1). e Graph showing the level of total ATP in the muscle tissue lysates after intraperitoneally injection with Mdivi-1 or vehicle reagent for 3 consecutive days after CLP (n  =  6 per group). Representative tibialis anterior (TA) cross-section H&E images (f) and quantitative analysis of fiber CSA (μm2) (g) and distribution of CSA area (h, %) (n  =  4-5 per group). Scale bar, 100 µm. Graphs showing the mRNA levels of Fbxo32 (i) and Trim63 (j) in the TA muscle tissue lysates. Western blots images (k) and quantitative analysis of Atrogin-1 (l) and MuRF1 (m) protein levels in muscle tissue lysates 3 days after Mdivi-1 or vehicle treatment with WT septic mice (n  = 5–6 per group). Graphs showing grid-hanging capacity (n), weight test (o), treadmill maximal speed (p), run time (q) and distance(r) to exhaustion 3 days after Mdivi-1 or vehicle treatment with WT septic mice (n  =  5–6 per group). Bars show mean ± SEM (g, i, j, lr) and median with interquartile range (ce). Two-sided P values were determined by one-way ANOVA followed by Tukey’s (g, h, Io, r) multiple comparisons test, Sidak’s multiple comparisons test (p, q), Games-Howell’s multiple comparisons test (i, j), and Kruskal–Wallis with Dunn’s multiple comparison test (ce).

References

    1. Singer, M. et al. The third international consensus definitions for sepsis and septic shock (Sepsis-3). JAMA315, 801–810 (2016). - PMC - PubMed
    1. Zhu, X. et al. Secreted frizzled-related protein 2 and inflammation-induced skeletal muscle atrophy. Crit. Care Med.45, e169–e183 (2017). - PubMed
    1. Liu, Y. et al. Gut-muscle axis and sepsis-induced myopathy: the potential role of gut microbiota. Biomed. Pharmacother.163, 114837 (2023). - PubMed
    1. Prescott, H. C. & Angus, D. C. Enhancing recovery from sepsis: a review. JAMA319, 62–75 (2018). - PMC - PubMed
    1. Evans, L. et al. Surviving sepsis campaign: international guidelines for management of sepsis and septic shock 2021. Intens. Care Med.47, 1181–1247 (2021). - PMC - PubMed

MeSH terms