. 2025 Jul;46(7):1834-1851.
doi: 10.1038/s41401-024-01462-x. Epub 2025 Feb 28.

FGF21, a modulator of astrocyte reactivity, protects against ischemic brain injury through anti-inflammatory and neurotrophic pathways

Affiliations

FGF21, a modulator of astrocyte reactivity, protects against ischemic brain injury through anti-inflammatory and neurotrophic pathways

Dong-Xue Wang et al. Acta Pharmacol Sin. 2025 Jul.

Abstract

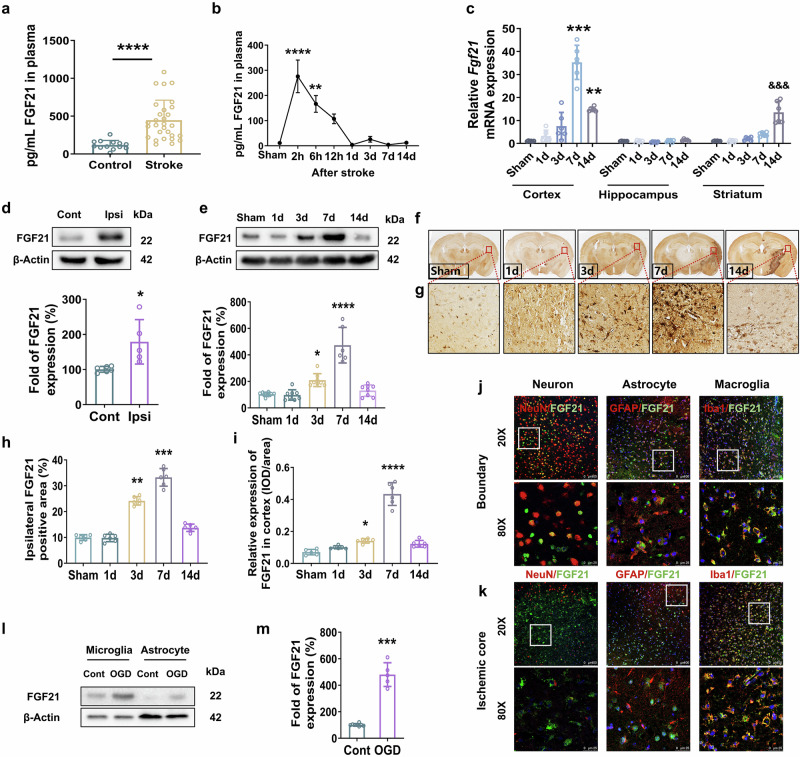
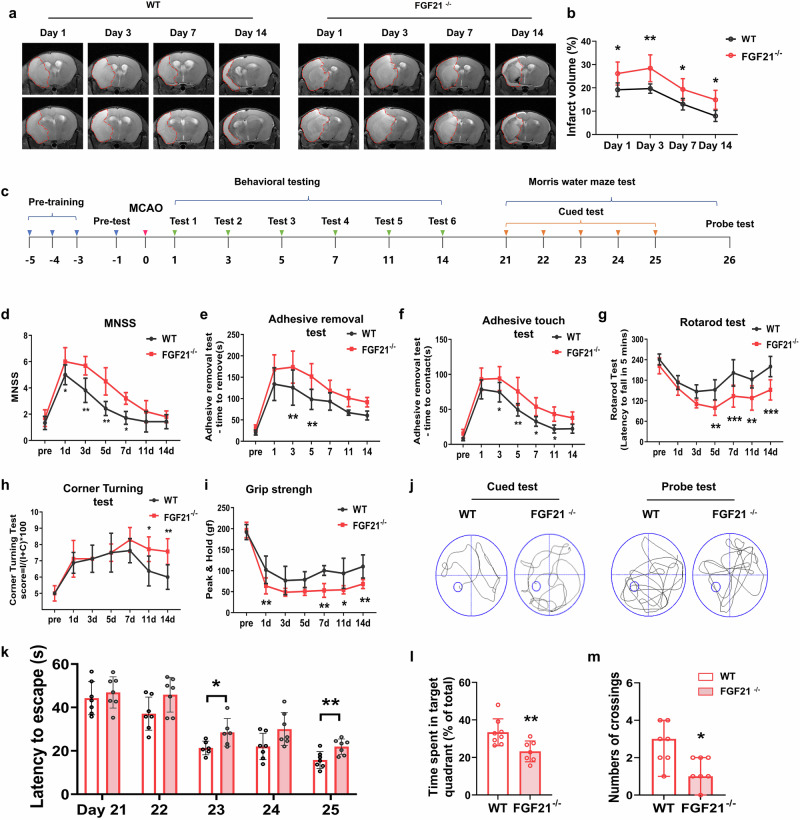
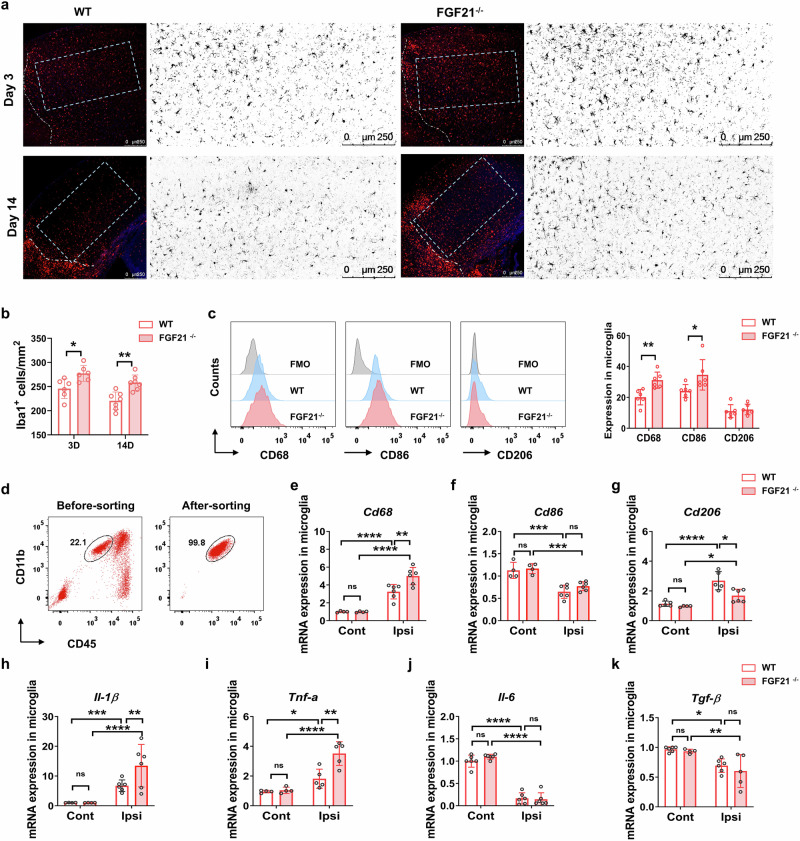
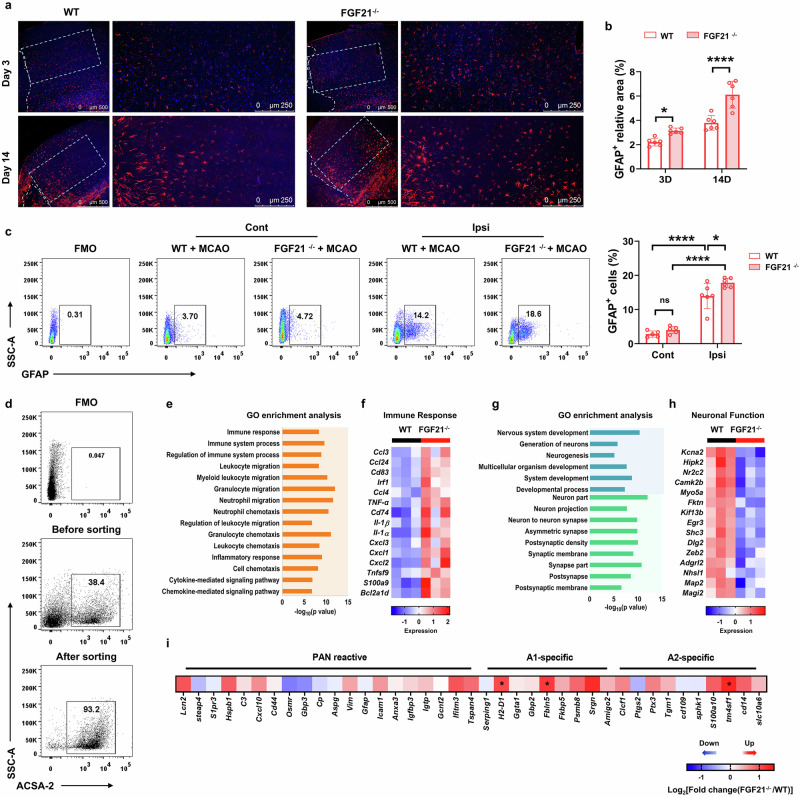
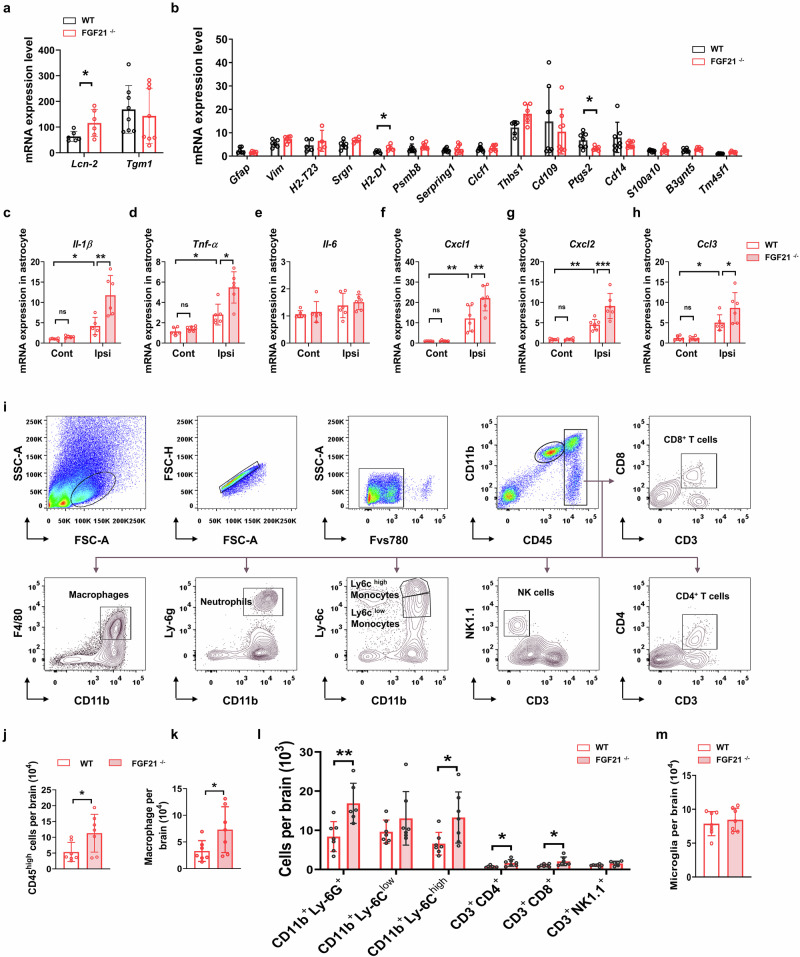
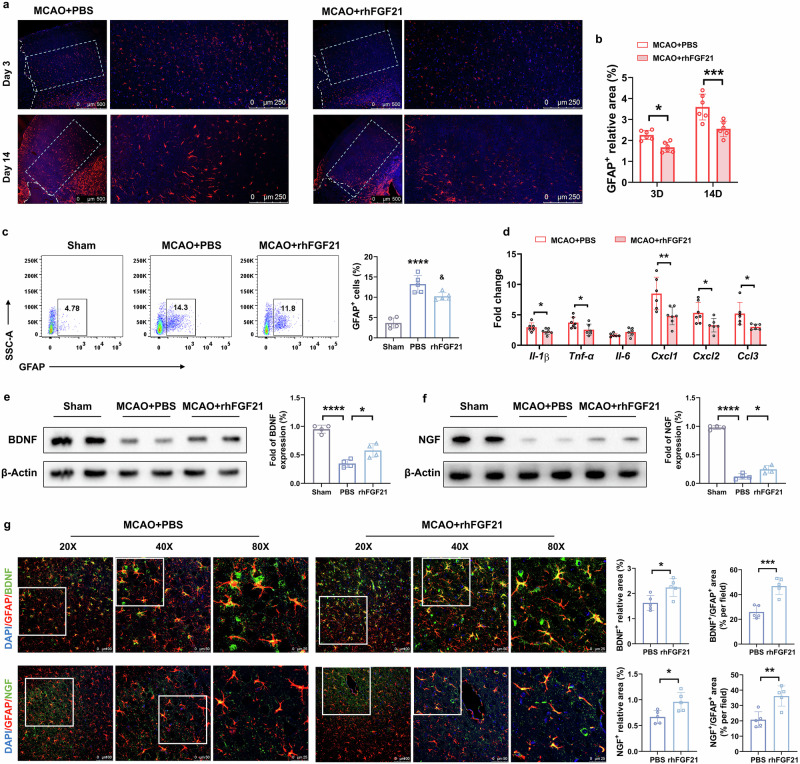
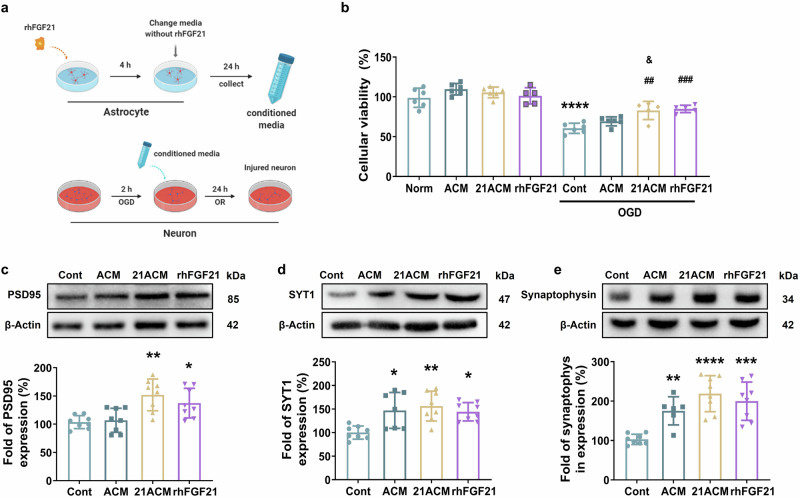
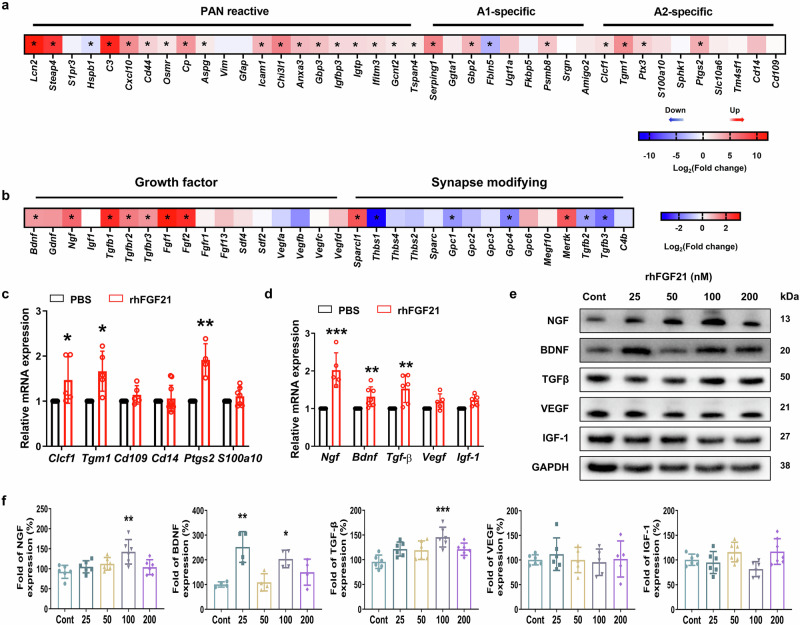
Ischemic stroke is a frequent cause of mortality and disability, and astrocyte reactivity is closely associated with injury outcomes. Fibroblast growth factor 21 (FGF21), an endogenous regulator, has been shown to perform pleiotropic functions in central nervous system (CNS) disorders. However, studies on neurological diseases have paid little attention to the effects and detailed mechanisms of FGF21 in astrocytes. Here, we found elevated serum levels of FGF21 in stroke patients and transient middle cerebral artery occlusion (tMCAO) mice. In the peri-infarct cortex, microglia and astrocytes serve as sources of FGF21 in addition to neurons. MRI and neurobehavioral assessments of wild-type (WT) and FGF21-/- tMCAO model mice revealed a deteriorated consequence of the loss of FGF21, with exacerbated brain infarction and neurological deficits. Additionally, combined with the pharmacological treatment of WT mice with recombinant human FGF21 (rhFGF21) after tMCAO, FGF21 was identified to suppress astrocytic activation and astrocyte-mediated inflammatory responses after brain ischemia and participated in controlling the infiltration of peripheral inflammatory cells (including macrophages, neutrophils, monocytes, and T cells) by modulating chemokines expression (such as Ccl3, Cxcl1, and Cxcl2) in astrocytes. Furthermore, rhFGF21 was shown to boost the production of neurotrophic factors (BDNF and NGF) in astrocytes, and by which rescued neuronal survival and promoted synaptic protein expression (postsynaptic density protein-95 (PSD-95), synaptotagmin 1 (SYT1), and synaptophysin) in neurons after ischemic injury. Overall, our findings implicate that FGF21 acts as a suppressor of astrocyte activation, and exerts anti-inflammatory and neurotrophic effects after ischemic brain injury through its action on astrocytes, offering an alternative therapeutic target.

Keywords: FGF21; astrocyte reactivity; leukocyte infiltration; neuroinflammation; transient middle cerebral artery occlusion (tMCAO).


Conflict of interest statement

Competing interests: The authors declare no competing interests.

Figures

Fig. 1
Fig. 1. The expression of FGF21 was induced after cerebral ischemia.
a The level of FGF21 in the serum of stroke patients was measured via ELISA. n = 13 for controls; n = 31 for stroke patients ****P < 0.0001 vs. control. b Quantification of serum FGF21 in mice during the acute and subacute stages after tMCAO via ELISA. n = 10 per group, **P < 0.01, ****P < 0.0001 vs. the sham group. c FGF21 mRNA levels in ischemic cortices, hippocampi, and striatum at 1, 3, 7, 14 d after transient MCAO/reperfusion. n = 6/group, **P < 0.01, ***P < 0.001 vs. the sham group (Cortex), &&&P < 0.001 vs. the sham group (Striatum). d Representative Western blot images and quantification of FGF21 in the ipsilesional (Ipsi) cortex compared with the contralesional (Cont) cortex at 7 d after MCAO/reperfusion. *P < 0.05 vs. the Cont group; n = 6/group. e Representative Western blot images and quantification of FGF21 in the cortical penumbra at days 1, 3, 7, and 14 post-stroke. *P < 0.05, ****P < 0.0001 vs. the sham group; n = 8 for sham, 1d-, 3d-, and 14d- group; n = 6 for 7d- group. f, h Representative images of immunohistochemical staining of FGF21 f and the percentage quantification of the injured ipsilateral FGF21-positive area h. g, i Magnified images of the cortical region g and the quantification of the average integrated optical density (IOD) of FGF21-positive staining i. n = 6/group. *P < 0.05, **P < 0.01, ***P < 0.001, and ****P < 0.0001 vs. the sham group; IOD/area: IOD per stained area. j, k Representative double-immunofluorescence staining images of FGF21 (green), neurons (red, NeuN-positive), astrocytes (red, GFAP-positive), and microglia (red, Iba1-positive) in the boundary zone j and the ischemic core k at 7 d after tMCAO. Scale bars = 100 µm or 25 µm. l, m Representative Western blot images and quantification of FGF21 in OGD/R-induced microglia and astrocytes. ***P < 0.001 vs. the Cont group; n = 5 per group. Data were expressed as mean ± SD, and statistical significance was determined by unpaired Student’s t-test or 1way-ANOVA with Tukey’s multiple comparison test.
Fig. 2
Fig. 2. Exacerbated ischemic brain damage in FGF21−/− mice.
a The representative images of 9.4T-MRI show the time course of brain infarcts (outlined in red dashed line) in WT and FGF21−/− mice. b Quantification of the infarct volume. n = 6/group. *P < 0.05, **P < 0.01 vs. WT mice. c Schematic diagram of the timeline of neurological deficit assessments and cognitive testing. Neurological functions were evaluated with mNSS d, adhesive-removal test (time to contract f, and time to removal e), rotarod g, corner-turning h, and grip strength i tests at days 1, 3, 5, 7, 11, and 14 after surgery. n = 9 for the WT group, and n = 10 for the FGF21−/− group; *P < 0.05, **P < 0.01, and ***P < 0.001 for FGF21−/− group vs. WT group. j Spatial cognitive performances were determined by the Morris water maze test. Escape latency in the cued testing phase k, time spent in the target quadrant l, and numbers of platform crossing m in the probe test were measured. *P < 0.05, **P < 0.01 vs. the WT group. Results are presented as mean ± SD, and statistical significance was determined by unpaired Student’s t-test or 2way-ANOVA with Sidak’s multiple comparison test.
Fig. 3
Fig. 3. Altered microglial response and phenotype in FGF21−/− mice after stroke.
a Microphotographs and bar graph b of Iba1-positive (red) microglia in the perifocal cortex of WT and FGF21−/− mice show the changes in microglia density at 3 and 14 d after tMCAO. n = 8/group. c FACS analysis and quantitative data of the expression of CD68, CD86, and CD206 in microglia (CD45intCD11b+) by FMO control. n = 6/group. *P < 0.05, **P < 0.01 by 2way-ANOVA with Sidak’s multiple comparison. d FACS images show the purity of microglia (> 99%) after cell sorting. ek qRT‒PCR shows the mRNA expression of the microglial signature gene (Cd68, Cd86, and Cd206) and inflammatory cytokine (Il-1β, Tnf-α, Il-6, and Tgf-β) in the sorted microglia from the contralesional and ipsilesional brain of WT and FGF21−/− mice. n = 6/group. *P < 0.05, **P < 0.01, ***P < 0.001, and ****P < 0.0001, determined by 2way-ANOVA with Tukey’s multiple comparison. Results are presented as mean ± SD.
Fig. 4
Fig. 4. Increased astrocyte reactivity in FGF21−/− mice after stroke.
a Representative images of astrocytes immunostaining (GFAP, red; Hoechst, blue) in the perifocal cortex of WT and FGF21−/− mice that were taken at days 3 and 14 after tMCAO. Scale bar=500 μm or 250 μm. b Quantitative assessment of the relative area of cells positive for GFAP in the indicated region of WT and FGF21−/− mice. n = 6/group. *P < 0.05, ****P < 0.0001, determined by 2way-ANOVA with Sidak’s multiple comparison. c Representative FACS plots and gate strategy of GFAP+ astrocyte in the ipsilesional and contralesional hemisphere of FGF21−/− and WT mice at 3 d after tMCAO. *P < 0.05, ****P < 0.0001, determined by 2way-ANOVA with Tukey’s multiple comparison. Results are presented as mean ± SD. d Astrocytes from the brain were isolated by MACS, and the purity of was verified by FACS analysis. e, g Representative Gene Ontology (GO) enrichment analysis of upregulated e and downregulated g genes expressed in astrocytes obtained from the ipsilesional brain of FGF21−/− mice versus WT mice. f, h Heatmap showing the upregulated genes categorized in immune response f, and downregulated genes correlated with neuronal functions h. i RNA-sequencing data revealed the expression of PAN-reactive, A1- and A2-specific genes in the sorted astrocytes in the ipsilesional hemisphere of WT and FGF21−/− mice at 3 d after tMCAO. q Value < 0.05, and Fold change > 2, for FGF21−/− vs. WT group.
Fig. 5
Fig. 5. Increased astrocytic cytokine/chemokine expression and accumulation of leukocytes in FGF21−/− mice.
a, b Fold change of PAN-reactive (Gfap, Vim, and Lcn-2), A1- specific (H2-T23, Srgn, H2-D1, Psmb8, and Serping-1) and A2-specific (Clcf-1, Tgm-1, Thbs-1, Cd109, Ptgs2, Cd14, S100a10, B3gnt5, and Tm4sf1) genes in astrocytes in the ipsilesional hemisphere relative to the contralesional expression. n = 8/group. ch Quantitative RT-PCR showed the mRNA expression level of inflammatory Il-1β c, Tnf-а d, Il-6 e, Cxcl1 f, Cxcl2 g, and Ccl3 h. n = 6/group. *P < 0.05, **P < 0.01, ***P < 0.001 by 2way-ANOVA with Tukey’s multiple comparison. i Flow cytometry plots show the gating strategy of microglia and infiltrating immune cell populations in the brain, including macrophages (CD45highCD11b+F4/80+), neutrophils (CD45highCD11b+Ly6G+), Ly6clow/Ly6chigh monocytes (CD45highCD11b+Ly6Clow and CD45highCD11b+ Ly6Chigh), NK cells (CD45highCD3-NK1.1+) CD8+T cells (CD45highCD3+CD8+), and CD4+T cells (CD45highCD3+CD4+). jm Cell counts of brain-infiltrating leukocytes j, macrophages k, indicated immune cell subsets l, and brain-resident microglia m in the brain at 3 d after tMCAO. n = 8/group. *P < 0.05, **P < 0.01, determined by 2way-ANOVA with Tukey’s multiple comparison. Results are presented as mean ± SD.
Fig. 6
Fig. 6. Altered astrocyte response in rhFGF21-treated mice after stroke.
a Representative images of GFAP immunostaining in the perilesional brain tissue sections from tMCAO mice receiving PBS or rhFGF21, Scale bar=500 μm or 250 μm. b Relative GFAP-positive area in the cortical region surrounding the border of the lesion for 3 and 14 d post-injury. n = 6/group. *P < 0.05, ***P < 0.001, by 2way-ANOVA with Sidak’s multiple comparison. c Gating strategy and quantification for GFAP+ astrocytes in the ipsilateral hemisphere 3 d after tMCAO. n = 6/group, ****P < 0.0001 vs. sham group &P < 0.05 vs. MCAO group (1way-ANOVA with Tukey’s multiple comparison). d Quantitative RT-PCR for mRNA expression of Il-1β, Tnf-α, Il-6, Ccl3, Cxcl1, and Cxcl2 in sorted astrocytes. n = 8/group. *P < 0.05, **P < 0.01, by unpaired Student’s t-test. e, f The expression levels of BDNF and NGF in the cortex around the infarcted zone were detected by Western blot, and normalized to β-actin. n = 4/group. *P < 0.05, ****P < 0.0001, determined by 1way-ANOVA with Tukey’s multiple comparison. g Double-immunofluorescence staining for GFAP/BDNF and GFAP/NGF in the perifocal cortex under PBS or rhFGF21 treatment condition at 3 d after tMCAO. Scale bar=100, 50, or 25 μm. n = 5/group. *P < 0.05, **P < 0.01, ***P < 0.001, determined by unpaired Student’s t-test. Results are presented as mean ± SD.
Fig. 7
Fig. 7. Effects of rhFGF21-stimulated astrocytes on neuronal survival and neuroplasticity after OGD/R exposure.
a A flow chart of the experiment with conditioned medium transfer from astrocytes to neurons in culture. b Neuronal viability after conditioned medium treatment under normal or OGD/R conditions. ****P < 0.0001 vs. the Norm group; ##P < 0.05 and ###P < 0.001 vs. the Cont group; &P < 0.05 vs. the OGD/R-ACM group (one-way ANOVA with Tukey’s multiple comparison); n = 6. ce Representative Western blot images and quantification of PSD95, SYT1, and synaptophysin levels in OGD/R-induced neurons cultured with conditioned medium. Norm, normal, nontreated neurons; ACM, conditioned medium from normal astrocytes; 21ACM, conditioned medium from rhFGF21-treated astrocytes; rhFGF21, rhFGF21 treatment alone. n = 8. *P < 0.05, **P < 0.01, ***P < 0.001, ****P < 0.0001 and vs. the Cont group (one-way ANOVA with Tukey’s multiple comparison).
Fig. 8
Fig. 8. rhFGF21 alters astrocyte reactivity and induces the expression of trophic factors.
a Analysis of RNA-seq data for astrocytes following treatment with FGF21 depicts the changes of genes in the PAN-reactive, A1- and A2-specific categories. (*P < 0.05, compared to non-reactive astrocytes). b Heatmap of growth factor and synapse-modifying genes expression changes between non-treated and FGF21-treated astrocytes. c Quantitative PCR for A2-specific gene after rhFGF21 treatment for 4 h. d Fold change of genes Bdnf, Ngf, Vegf, Tgf-β, and Igf-1 in FGF21-treated astrocytes compared to Cont. n = 6. *P < 0.05, **P < 0.01 and ***P < 0.001 (unpaired Student’s t-test). e, f Representative Western blot images and quantification of NGF, BDNF, TGF-β, VEGF, and IGF-1 in cell lysates after rhFGF21 treatment for 24 h. n = 6. *P < 0.05, **P < 0.01, and ***P < 0.001 vs. the Cont group (one-way ANOVA with Tukey’s test).
Fig. 9
Fig. 9. The schematic diagram of the proposed mechanisms regarding the role of FGF21 in ischemic stroke.
The neuroprotective effects of FGF21 on ischemic brain injury were achieved through its modulation of astrocyte reactivity, which is mediated mainly by reducing the levels of inflammatory cytokines/chemokines and upregulating the expression of BDNF/NGF.

References

    1. Hankey GJ. Stroke. Lancet. 2017;389:641–54. - PubMed
    1. Stokowska A, Aswendt M, Zucha D, Lohmann S, Wieters F, Moran Suarez J, et al. Complement C3a treatment accelerates recovery after stroke via modulation of astrocyte reactivity and cortical connectivity. J Clin Invest. 2023;133:e16225. - PMC - PubMed
    1. Liddelow S, Barres B. SnapShot: astrocytes in health and disease. Cell. 2015;162:1170–e1. - PubMed
    1. Kang W, Balordi F, Su N, Chen L, Fishell G, Hebert JM. Astrocyte activation is suppressed in both normal and injured brain by FGF signaling. Proc Natl Acad Sci USA. 2014;111:E2987–95. - PMC - PubMed
    1. Boghdadi AG, Spurrier J, Teo L, Li M, Skarica M, Cao B, et al. NogoA-expressing astrocytes limit peripheral macrophage infiltration after ischemic brain injury in primates. Nat Commun. 2021;12:6906. - PMC - PubMed

MeSH terms

LinkOut - more resources