. 2025 Mar;31(3):840-848.
doi: 10.1038/s41591-024-03435-3. Epub 2025 Feb 28.

Rapid brain tumor classification from sparse epigenomic data

Affiliations

Rapid brain tumor classification from sparse epigenomic data

Björn Brändl et al. Nat Med. 2025 Mar.

Abstract

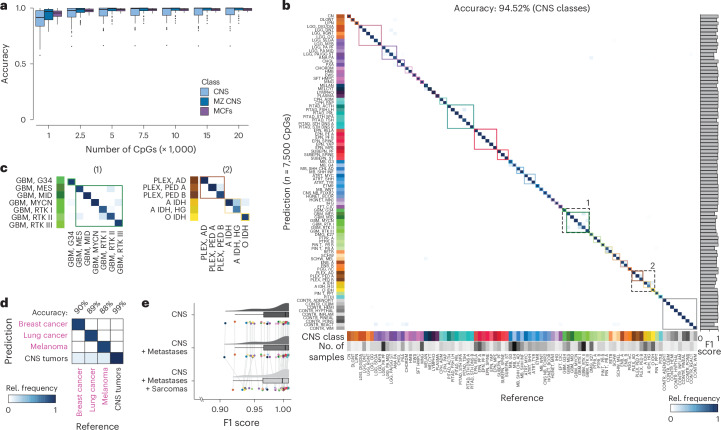
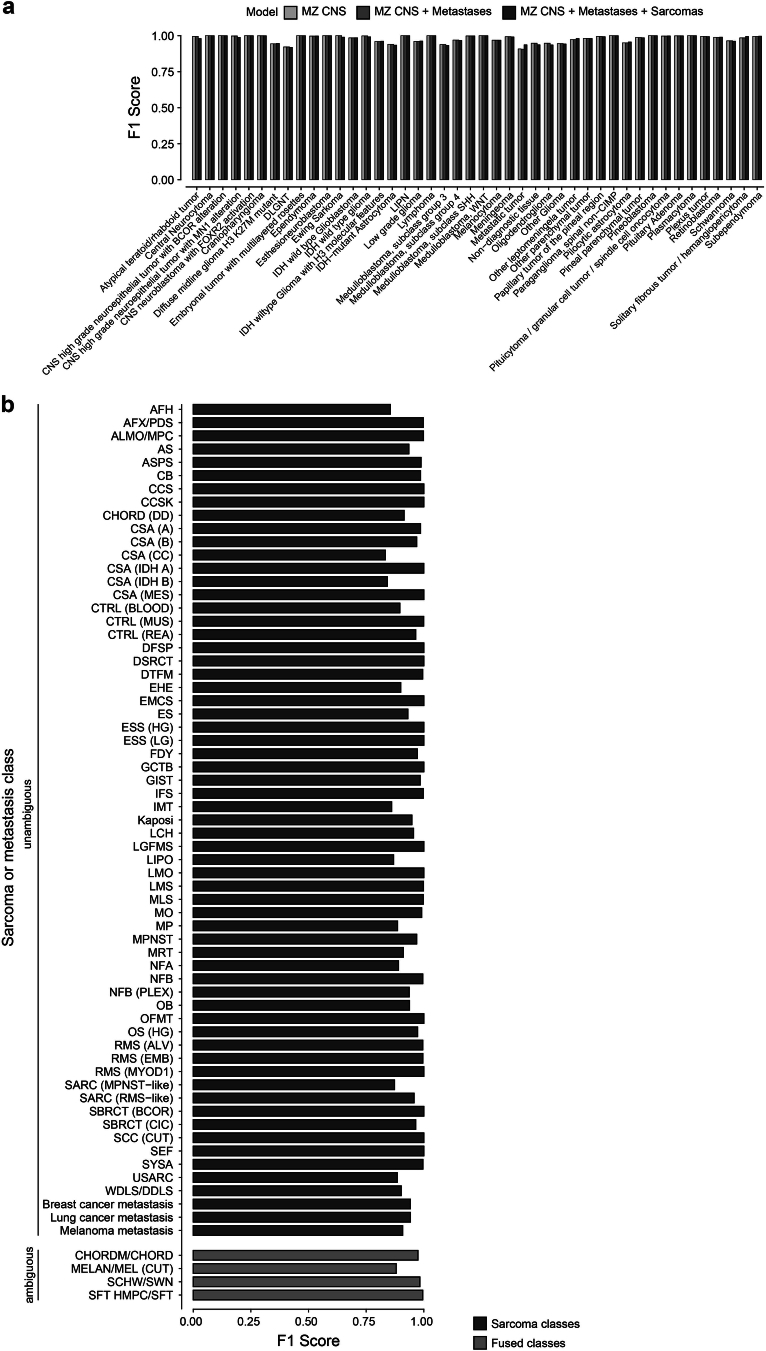
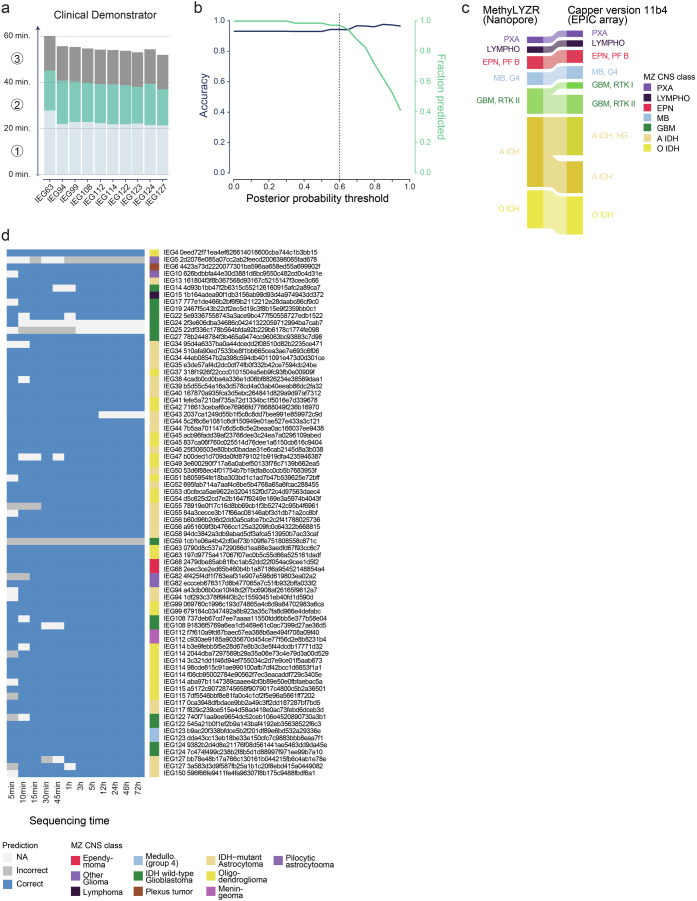
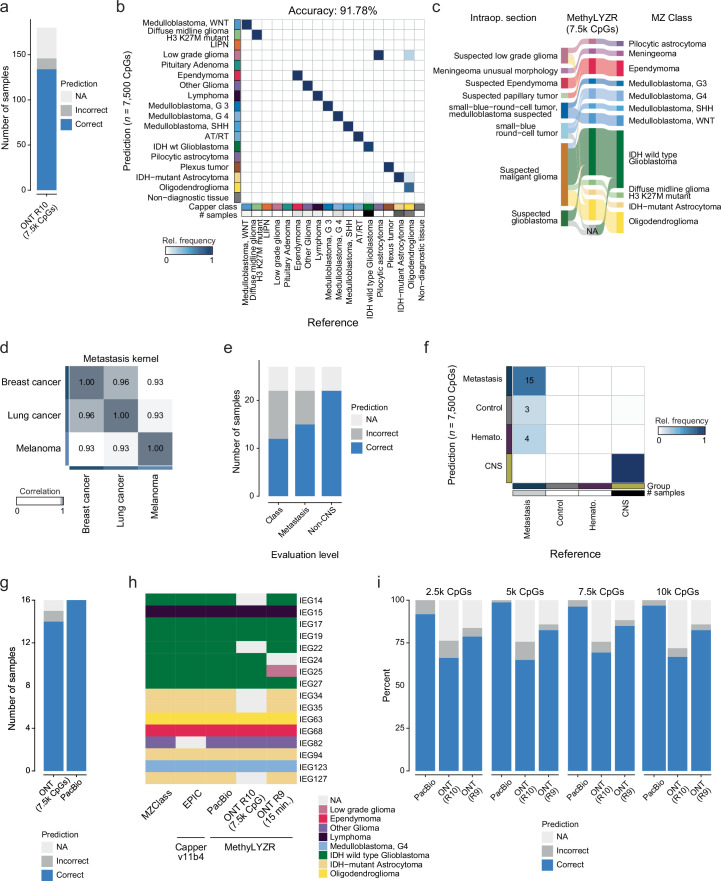
Although the intraoperative molecular diagnosis of the approximately 100 known brain tumor entities described to date has been a goal of neuropathology for the past decade, achieving this within a clinically relevant timeframe of under 1 h after biopsy collection remains elusive. Advances in third-generation sequencing have brought this goal closer, but established machine learning techniques rely on computationally intensive methods, making them impractical for live diagnostic workflows in clinical applications. Here we present MethyLYZR, a naive Bayesian framework enabling fully tractable, live classification of cancer epigenomes. For evaluation, we used nanopore sequencing to classify over 200 brain tumor samples, including 10 sequenced in a clinical setting next to the operating room, achieving highly accurate results within 15 min of sequencing. MethyLYZR can be run in parallel with an ongoing nanopore experiment with negligible computational overhead. Therefore, the only limiting factors for even faster time to results are DNA extraction time and the nanopore sequencer's maximum parallel throughput. Although more evidence from prospective studies is needed, our study suggests the potential applicability of MethyLYZR for live molecular classification of nervous system malignancies using nanopore sequencing not only for the neurosurgical intraoperative use case but also for other oncologic indications and the classification of tumors from cell-free DNA in liquid biopsies.


Conflict of interest statement

Competing interests: F.-J.M., B.S., H.K., A.v.B., B.B. and C.R. filed a patent application (WO 2023/031485 A1) covering the development of MethyLYZR. S.Y. is a member of advisory boards and has received honoraria from Amgen, AstraZeneca, Bayer, Janssen, Roche and Servier. H.K. is a member of an expert panel and has received honoraria from Roche and Oxford Nanopore Technologies. The remaining authors declare no competing interests.

Figures

Fig. 1
Fig. 1. MethyLYZR enables tumor class prediction on sparse data without model retraining.
a, Simplified schematic of the timeline of a brain surgery procedure. The stages encompass the following: (1) induction, involving anesthesia and patient positioning with neuronavigation adjustments (approximately 45–60 min); (2) incision and progression to the tumor (approximately 30 min); (3) tumor resection (approximately 60 min) and (4) retraction and completion of suturing (approximately 30 min). Notably, the 60-min tumor resection stage is the critical time window for obtaining a molecular diagnosis. However, the turnaround times of established molecular diagnostics extend beyond the length of the surgical procedure. b, Illustration of the training and prediction process of the naive Bayes algorithm. Multiple tumor classes (m classes) with several samples contribute CpG methylation ratios (p features) for algorithm training. The training involves generating m centroids (μ) based on the provided samples (S1,,Snm), describing the average methylation probability of each of the n CpGs (features) per tumor class. Additionally, weights (w) are calculated per CpG and class, reflecting the predictive power of a CpG for a specific tumor class. For tumor class prediction in a given sample, sparse, binary methylation values from individual molecules—for example, obtained through Nanopore sequencing—serve as input for the pre-trained Bernoulli naive Bayes model. The output comprises a ranked list of posterior probabilities of all tumor classes in the model. c, Benchmarking analysis of MethyLYZR training time on published CNS 450k methylation arrays across 91 tumor classes with a total of 2,801 samples. The training was executed on a single core using a Dell PowerEdge R7525 server (3 GHz AMD 64-Core Processor, 256 CPUs, 1,031.3 GB DDR4 RAM, Linux distribution) and an Apple iMac Pro (3 GHz 10-Core Intel Xeon W, 64 GB 2,666 MHz DDR4 RAM, 1 TB APFS SSD, Radeon Pro Vega 56 GPU with 8 GB VRAM, macOS 13.2.1). Notably, centroids and weight training were achieved on the server in under 20 min and on the iMac Pro in under 40 min.
Fig. 2
Fig. 2. Highly accurate tumor class prediction from sparse, binary DNA methylation profiles based on 450k methylation arrays.
a, Evaluation of prediction accuracy for the synthetic samples using a random subset of 1,000, 2,500, 5,000, 7,500, 10,000, 15,000 or 20,000 CpGs. In silico simulation of 100 × 2,801 samples mirroring low-coverage Nanopore sequencing was performed from 450k arrays of 2,801 biologically independent samples representing 91 CNS cancer and control methylation classes. Box plots display the median as the central line, the IQR (25th–75th percentile) as the box and outliers (points beyond 1.5× the IQR) as dots outside the whiskers. b, Confusion matrix depicting the prediction outcomes for all imputed samples using 7,500 CpGs, yielding an overall accuracy of 94.52% for CNS classes and 97.72% for MZ CNS classes. Colors indicate relative frequencies that are normalized to the number of samples in each reference class. Misclassification errors are represented by deviations from the bisecting line, and clinically relevant groups (MZ CNS classes) are highlighted by colored squares. F1 scores are provided on the right. c, Zoom into the confusion matrix for groups of CNS tumor classes with slightly lower F1 scores than the average. d, Confusion matrix illustrating predictions on an extended dataset, including CNS tumors, breast cancer, lung cancer and melanoma CNS metastases (91 CNS classes and 2,801 samples; three metastatic classes and 85 samples). Using 7,500 CpGs, MethyLYZR achieves an accuracy of 90.31%, 89.39%, 88.76% and 99.99% in distinguishing among breast, lung, melanoma and CNS samples, respectively. e, Distribution of F1 scores per class resulting from the prediction of 280,100 simulated CNS samples across three models with increasing complexity. The three models include 91 CNS classes (top), 91 CNS + 3 metastasis classes (middle) and 91 CNS + 3 metastasis + 64 sarcoma classes (bottom). F1 scores per model are represented as dots and summarized through box and density plots. Box plots display the median as the central line, the IQR (25th–75th percentile) as the box and outliers (points beyond 1.5× the IQR) as dots outside the whiskers.
Fig. 3
Fig. 3. Workflow for intraoperative shallow Nanopore sequencing.
a, Schematic representation of the timeline for intraoperative tumor sequencing and classification in our study. The cancer class prediction is achieved within a rapid turnaround time of just 1 h from tumor biopsy reception. The process involves genomic DNA extraction (approximately 22 min), Nanopore library preparation (approximately 18 min) and loading of the library with subsequent sequencing (15–20 min). b, Description of the Nanopore and 450k methylation array cohort derived from patients with CNS cancer in this study. A total of 75 Nanopore runs were conducted using samples from 51 patients, and, for a subset of 22 patients, 450k methylation arrays were generated from matched tumor biopsies. c, Relationship between sequencing time and the number of CpGs sequenced at least once, derived from our cohort of 75 Nanopore runs. In the initial 24 h of sequencing, the count of newly observed CpGs rises with sequencing time, saturating into enhanced coverage per CpG thereafter (left). Within 15 min of sequencing, approximately 7,500 CpGs are covered on average (right). Data are presented as mean ± s.d. d, Benchmarking analysis of MethyLYZR prediction time on our Nanopore runs using the model trained on the 91 CNS and three metastasis tumor classes executed on an Apple iMac Pro (3 GHz 10-Core Intel Xeon W, 64 GB 2,666 MHz DDR4 RAM, 1 TB APFS SSD, Radeon Pro Vega 56 GPU with 8 GB VRAM, macOS 13.2.1). For data acquired from 15 min of sequencing, the runtime is negligibly small (on average less than 1 s), and, even with full 72-h runs, the prediction time remains well below 4 min, even in the most extreme cases (on average less than 1 min). Numbers on top state the mean number of CpGs for each time benchmarked. The bar represents the median, and the error bar is the s.d. gDNA, genomic DNA.
Fig. 4
Fig. 4. MethyLYZR predicts cancer classes from CNS cancer as well as spinal cord liquid biopsies with high accuracy.
a, Confusion matrix illustrating the prediction outcomes for all Nanopore samples using CpGs obtained within 15 min of sequencing, resulting in an overall accuracy of 94.52% for MZ CNS classes. Misclassification errors are depicted by deviations from the bisecting line, and F1 scores per class are presented on the right. b, Evaluation of predictive power across sequencing times ranging from 5 min to 72 h. The largest increase in prediction accuracy was observed between 5 min and 15 min of sequencing (89.06% versus 94.52%). Beyond this interval, extended sequencing times yielded only small improvements in accuracy (94.52% versus 97.22% for 15 min versus 72 h). c, Tumor class predictions for 96 Nanopore-sequenced CNS tumors based on 7,500 CpGs to simulate 15 min of sequencing, stratified by estimated purity (ACE). As purity increases, the accuracy of MethyLYZR demonstrates an upward trend, reaching consistently high levels of diagnostic accuracy from approximately 60% tumor purity onward. Accuracy (%) left to right: 82.2, 84.8, 87.5, 87.3, 90.6, 92.6, 96.9, 100.0, 100.0 and 100.0. d, Tumor class predictions for 17 cfDNA samples obtained from CSF samples of pediatric CNS tumor patients with more than 2,500 CpGs covered and an estimated tumor fraction above 0.1. MethyLYZR provided high-confidence predictions for 16 of the 17 samples and, among these, achieved 93% accuracy, including a metastasis predicted as metastatic (instead of CNS). Number of CpGs used for prediction (left to right): 208,678; 100,598; 259,863; 45,822; 51,741; 20,309; 188,340; 8,861; 50,493; 9,150; 3,058; 7,453; 198,609; 212,907; 111,630 and 5,841.
Extended Data Fig. 1
Extended Data Fig. 1. Training of weights for Naïve Bayes classifier.
a) Correlation matrix of centroids derived from the training of MethyLYZR on 2,801 CNS 450k methylation arrays, segregated into 91 classes. Utilizing all CpGs post-quality control, the majority of centroids exhibit high correlation. b) Schematic of ReliefF-algorithm-based calculation of feature weights. Weights ωij are calculated for each feature (CpG) and class with index i and j. In brief, for every sample within a class Cj, the mean distance to its k-nearest foreign centroids (misses: inter-class) is calculated and subtracted by the mean distance to all other samples within the same class (hits: inter-class). The proximity of samples and centroids is pre-calculated on the full, p-dimensional information. CpGs that serve as good and precise predictors for a class will exhibit a smaller intra-class than inter-class distance, resulting in a positive weight, and vice versa for non-specific CpGs.
Extended Data Fig. 2
Extended Data Fig. 2. Grouping of 91 CNS classes into 44 clinically relevant MZ CNS classes.
a) 91 CNS tumor classes are consolidated into 44 MZ CNS classes, preserving clinically relevant distinctions. Larger fusions are particularly impactful on Low-grade glioma, Pituitary Adenoma, Ependymoma, IDH wild-type Glioblastoma, and non-diagnostic control classes.
Extended Data Fig. 3
Extended Data Fig. 3. Evaluation of prediction accuracy per CNS tumor class.
a) Schematic illustrating the simulation strategy for obtaining in silico converted binary methylation events from 450k arrays. Methylation rates per sample serve as the probability for a CpG to be methylated on a single molecule. Employing a Bernoulli distribution, the methylation rates of 100 molecules are simulated for each CpG, resulting in 100 sampled replicates from each 450k methylation array. Subsequently, a subset of CpGs (n = 1k, 2.5k, 5k, 7.5k, 10k, 15k, and 20k) is randomly sampled and utilized for class prediction of each synthetic replicate. b) Accuracy of predictions per CNS class as a function of the number of sampled CpGs. The 91 CNS classes are grouped by clinical relevance MZ CNS class. In the majority of classes, predictions exhibit improvement with an increasing number of CpGs, plateauing at around 5 to 7.5k CpGs. Beyond this threshold, further increments in the number of CpGs yield only marginal improvements in predictions. Black lines indicate the average accuracy of the MZ CNS class. c) Accuracy of predictions per MZ CNS class (n = 44) for different levels of error. The error rate indicates the frequency with which a CpG methylation status was inverted. The average accuracy is 97.89%, 98.01%, 98.10%, 98.08%, and 97.30% for error levels of 0%, 1%, 2.5%, 5%, and 10%, respectively. Boxplots display the median as the central line, the interquartile range (IQR; 25th to 75th percentile) as the box, and outliers (points beyond 1.5 times the IQR) as dots outside the whiskers.
Extended Data Fig. 4
Extended Data Fig. 4. Evaluation of prediction accuracy per CNS tumor class.
a) Confusion matrix depicting the prediction outcomes for all imputed samples using 1k, 2.5k, 5k, 7.5k, 10k, 15k, and 20k CpGs, yielding an overall accuracy of 86.83% to 95.03% for CNS classes and 92.42% to 97.99% for MZ CNS classes. Color key indicates relative frequencies that are normalized to the number of samples in each reference class. Misclassification errors are represented by deviations from the bisecting line and F1 scores per class are provided on the right.
Extended Data Fig. 5
Extended Data Fig. 5. Evaluation of MethyLYZR on models with increased complexity.
a) F1 scores per MZ CNS class resulting from the prediction of 100 ×2,801 simulated CNS samples across three models with increasing complexity. The F1 scores per MZ CNS class demonstrate no decline of F1 scores across the models, suggesting sustained accuracy even with substantially expanded model scopes. The three models include 91 CNS classes (light grey), 91 CNS + 3 metastasis classes (grey), and 91 CNS + 3 metastases + 64 sarcoma classes (dark grey). b) F1 scores for each sarcoma or metastases class derived from the prediction of 100 ×1,162 simulated samples using a model trained on 91 CNS, 3 metastases, and 64 sarcoma classes. All F1 scores surpass 0.83, with the majority approaching almost 1 (mean: 0.96). Classes that were present in more than one reference dataset were fused, labeled as ambiguous, and appropriately accounted for.
Extended Data Fig. 6
Extended Data Fig. 6. Evaluation of prediction accuracy on Nanopore samples.
a) Comparison of times for (1) DNA isolation, (2) library preparation, and (3) sequencing for 10 samples run in interoperative settings in the clinics (‘Clinical Demonstrators’) with corresponding videos (see Supplementary Video). The median times are 22:15 minutes for DNA extraction, 17:10 minutes for library preparation, and predictions after 15 minutes of sequencing, resulting in the correct diagnosis in all runs (2-4 sequencing runs per sample to validate consistency in results, Supplementary Table 10). b) Assessment of a posterior probability cutoff for Nanopore samples. The graph illustrates the percentage of samples exceeding the threshold for each posterior probability, along with the corresponding accuracy based on these samples. Notably, a posterior probability of 0.6 or higher resulted in a high percentage of correctly predicted samples. c) Comparative analysis of predicted classes derived from Nanopore data using MethyLYZR and matching 450k methylation arrays employing the Capper classifier version 11b4. At the CNS class level, predictions align in 74.07% of cases, while 100% of predictions are in agreement at the clinically relevant MZ CNS levels. d) Assessment of predictive power across sequencing times ranging from 5 minutes to 72 hours, analyzed individually by runs. The most substantial increase in prediction power was observed between 5 and 15 minutes of sequencing, with three samples exhibiting either no correct predictions or none at all. The color bar on the side depicts the reference class.
Extended Data Fig. 7
Extended Data Fig. 7. Evaluation of the barcoded Nanopore cohort and technology comparison.
a) Barplot visualizing prediction outcome of the 180 brain cancer biopsies of 13 CNS cancer classes sequenced using barcoding on a PromethION R10 flow cell. For 80% of the 180 samples a classification was returned with an accuracy of 91.78%. b) Confusion matrix illustrating the prediction outcomes for all 180 barcoded Nanopore samples using 7.5k CpGs, resulting in an overall accuracy of 91.78% for MZ CNS classes. Misclassification errors are depicted by deviations from the bisecting line. c) For a subset of 26 samples with available intraoperative frozen section neuropathology (left) and matching Nanopore sequencing experiments (middle), MethyLYZR’s results showed full agreement with the broader rapid frozen section categories and more nuanced feedback aligned with current diagnostic groups (right). d) Correlation heatmap of the metastasis class kernels (breast cancer, lung cancer, and melanoma), showing correlations of >0.93. e) Barplot visualizing the 27 brain metastases mainly from lung, colon, and breast. 22 of these were predicted with a posterior above 0.6 (7.5k CpGs). 15 of the 22 were identified as metastasis and the 7 misclassifications were correctly identified as non-CNS cancer and assigned to control (n = 4) or hematopoietic (n = 3) groups. f) Confusion matrix illustrating the prediction outcomes for all 22 metastasis samples using 7.5k CpGs. 15 of the 22 were identified as metastasis and the 7 misclassifications were correctly identified as non-CNS cancer and assigned to control (n = 4) or hematopoietic (n = 3) groups. g) Barplot visualizing the prediction outcome of the 16 samples sequenced with Nanopore (first 15 minutes, rapid kit, R9) and PacBio HiFi (no posterior threshold due to high sequencing quality). h) Heatmap comparing the prediction accuracy of different sequencing technologies (EPIC with Capper classifier, PacBio HiFi, Nanopore R9 rapid, and R10 barcoded) for 16 samples from 8 different CNS classes. i) Visualization of prediction outcomes when using a limited number of CpGs (n = 2.5k, 5k, 7.5k, and 10k). All data were down-sampled 10 times to the CpG numbers on a per-read sampling basis.
Extended Data Fig. 8
Extended Data Fig. 8. Tumor purity affects prediction accuracy.
a) Proportions of tumor classes of tumor purity (ACE) stratified samples. b) Classification results of cell-free DNA from cerebrospinal fluid sequenced with Nanopore sequencing. 8 samples with limited quality showed less than 2.5k CpGs covered after filtering for reads within the expected length for cfDNA of 50-700nt. Annotations on top state the age of the donor, the time to/from operation, the estimated tumor cell content, and the number of CpGs. c) Classification results of cell-free DNA from cerebrospinal fluid sequenced with Nanopore sequencing. 33 samples with more than 2.5k CpGs covered after filtering for reads within the expected length for cfDNA of 50–700nt are shown. 17 had a tumor fraction above 0.1: one sample did not reach the posterior threshold; 15 of 16 were correctly predicted (93%), including a metastasis predicted as metastatic (instead of CNS). Annotations on top state the age of the donor, the time to/from operation, the estimated tumor cell content, and the number of CpGs.
Extended Data Fig. 9
Extended Data Fig. 9. MethyLYZR predictions are more accurate than Sturgeon on shallow coverage, low CpG methylation information.
a) Comparative analysis of MethyLYZR, Sturgeon, and nanoDx on the 100 ×2,801 simulated CNS samples based on 450k methylation array data. Predictions were conducted for 5k, 7.5k, and 10k CpGs. MethyLYZR predicts a class in >99% of samples with an average accuracy of 94.43%, 95.15%, and 95.25%, whereas Sturgeon reports for 89% of the samples a class with an accuracy of 92.61% (7.5k CpGs) and nanoDx in 42% with 98.69% (7.5k CpGs) accuracy (correct class, but below default reporting threshold indicated by blue diagonal lines). Of note, nanoDx has to re-train and thus requires more than 20 minutes per sample. b) Comparative analysis of MethyLYZR, Sturgeon and nanoDx on our 75 Nanopore runs. Predictions were conducted for CpGs that were sequenced within the first 15 minutes. MethyLYZR predicts a correct class in 94.52% out of 97.33% of samples, while Sturgeon only predicts 91.94% out of 82.67% of samples correctly and nanoDx predicts 98.69% out of 42% of samples correctly (correct class, but below default reporting threshold indicated by blue diagonal lines). c) Comparative analysis of Sturgeon and nanoDx matching the MethyLYZR analysis in Fig. 4c (Nanopore samples stratified by tumor purity, 73 of 94 predicted in full dataset, 82.19% accuracy). Of note, the predictions are based on only 7.5k CpGs to simulate 15 minutes of sequencing. While Sturgeon shows an accuracy of 75.95% (79/94 samples predicted), nanoDx shows an accuracy of 100% but low number of above-threshold classifications (43/94 samples predicted) and also 100% without the default threshold (correct class, but below default reporting threshold indicated by blue diagonal lines).

References

    1. Gal, A. A. & Cagle, P. T. The 100-year anniversary of the description of the frozen section procedure. JAMA294, 3135–3137 (2005). - PubMed
    1. Eisenhardt, L. & Cushing, H. Diagnosis of intracranial tumors by supravital technique. Am. J. Pathol.6, 541–552 (1930). - PMC - PubMed
    1. Hollon, T. C. et al. Near real-time intraoperative brain tumor diagnosis using stimulated Raman histology and deep neural networks. Nat. Med.26, 52–58 (2020). - PMC - PubMed
    1. Louis, D. N. et al. The 2021 WHO Classification of Tumors of the Central Nervous System: a summary. Neuro Oncol.23, 1231–1251 (2021). - PMC - PubMed
    1. Capper, D. et al. DNA methylation-based classification of central nervous system tumours. Nature555, 469–474 (2018). - PMC - PubMed