Comparative transcriptome analysis reveals potential regulatory genes involved in the development and strength formation of maize stalks
- PMID: 40021951
- PMCID: PMC11871777
- DOI: 10.1186/s12870-025-06276-5
Comparative transcriptome analysis reveals potential regulatory genes involved in the development and strength formation of maize stalks
Abstract
Background: Stalk strength is a critical trait in maize that influences plant architecture, lodging resistance and grain yield. The developmental stage of maize, spanning from the vegetative stage to the reproductive stage, is critical for determining stalk strength. However, the dynamics of the genetic control of this trait remains unclear.
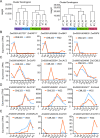
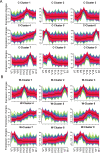
Results: Here, we report a temporal resolution study of the maize stalk transcriptome in one tropical line and one non-stiff-stalk line using 53 transcriptomes collected covering V7 (seventh leaf stage) through silking stage. The time-course transcriptomes were categorized into four phases corresponding to stalk early development, stalk early elongation, stalk late elongation, and stalk maturation. Fuzzy c-means clustering and Gene Ontology (GO) analyses elucidated the chronological sequence of events that occur at four phases of stalk development. Gene Ontology analysis suggests that active cell division occurs in the stalk during Phase I. During Phase II, processes such as cell wall extension, lignin deposition, and vascular cell development are active. In Phase III, lignin metabolic process, secondary cell wall biogenesis, xylan biosynthesis process, cell wall biogenesis, and polysaccharide biosynthetic process contribute to cell wall strengthening. Defense responses, abiotic stresses, and transport of necessary nutrients or substances are active engaged during Phase IV. Kyoto Encyclopedia of Genes and Genomes (KEGG) analysis showed that the two maize lines presented significant gene expression differences in the phenylpropanoid biosynthesis pathway and the flavonoid biosynthesis pathway. Certain differentially expressed genes (DEGs) encoding transcription factors, especially those in the NAC and MYB families, may be involved in stalk development. In addition, six potential regulatory genes associated with stalk strength were identified through weighted gene co-expression network analysis (WGCNA).
Conclusion: The data set provides a high temporal-resolution atlas of gene expression during maize stalk development. These phase-specific genes, differentially expressed genes, and potential regulatory genes reported in this study provide important resources for further studies to elucidate the genetic control of stalk development and stalk strength formation in maize.
Keywords: Maize; Regulatory genes; Stalk development; Stalk strength; Transcriptome.
© 2025. The Author(s).
Conflict of interest statement
Declarations. Ethics approval and consent to participate: Not applicable. Consent for publication: Not applicable. Competing interests: The authors declare no competing interests.
Figures


Similar articles
-
Transcriptome analysis reveals the mechanism of internode development affecting maize stalk strength.BMC Plant Biol. 2022 Jan 24;22(1):49. doi: 10.1186/s12870-022-03435-w. BMC Plant Biol. 2022. PMID: 35073838 Free PMC article.
-
Spatial accumulation of lignin monomers and cellulose underlying stalk strength in maize.Plant Physiol Biochem. 2024 Sep;214:108918. doi: 10.1016/j.plaphy.2024.108918. Epub 2024 Jul 6. Plant Physiol Biochem. 2024. PMID: 38986238
-
Integration of transcriptome and metabolome analyses reveals key lodging-resistance-related genes and metabolic pathways in maize.Front Genet. 2022 Oct 10;13:1001195. doi: 10.3389/fgene.2022.1001195. eCollection 2022. Front Genet. 2022. PMID: 36299597 Free PMC article.
-
Genetic mapping and genomic selection for maize stalk strength.BMC Plant Biol. 2020 May 7;20(1):196. doi: 10.1186/s12870-020-2270-4. BMC Plant Biol. 2020. PMID: 32380944 Free PMC article.
-
Stalk architecture, cell wall composition, and QTL underlying high stalk flexibility for improved lodging resistance in maize.BMC Plant Biol. 2020 Nov 11;20(1):515. doi: 10.1186/s12870-020-02728-2. BMC Plant Biol. 2020. PMID: 33176702 Free PMC article.
References
-
- Zhao B, Li K, Wang M, Liu Z, Yin P, Wang W, Li Z, Li X, Zhang L, Han Y, et al. Genetic basis of maize stalk strength decoded via linkage and association mapping. Plant J. 2023;117(5):1558–73. - PubMed
-
- Zhan X, Kong F, Liu Q, Lan T, Liu Y, Xu J, Ou Q, Chen L, Kessel G, Kempenaar C et al. Maize basal internode development significantly affects stalk lodging resistance. Field Crops Res. 2022;286.
-
- Robertson DJ, Julias M, Lee SY, Cook DD. Maize stalk lodging: morphological determinants of stalk strength. Crop Sci. 2017;57(2):926–34.
Publication types
MeSH terms
Substances
Grants and funding
LinkOut - more resources
Full Text Sources

