. 2025 Feb 28;31(1):81.
doi: 10.1186/s10020-025-01133-5.

Constitutive systemic inflammation in Shwachman-Diamond Syndrome

Affiliations

Constitutive systemic inflammation in Shwachman-Diamond Syndrome

Giuseppe Sabbioni et al. Mol Med. .

Abstract

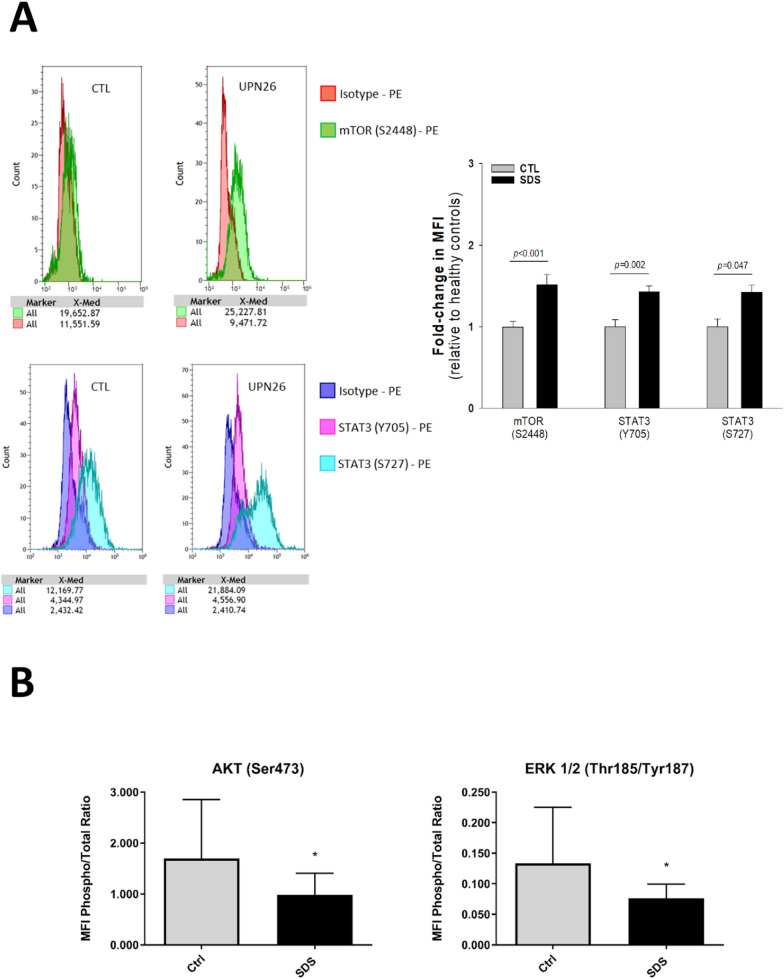
Background and purpose: Shwachman-Diamond Syndrome (SDS) is an autosomal recessive disease belonging to the inherited bone marrow failure syndromes and characterized by hypocellular bone marrow, exocrine pancreatic insufficiency, and skeletal abnormalities. SDS is associated with increased risk of developing myelodysplastic syndrome (MDS) and/or acute myeloid leukemia (AML). Although SDS is not primarily considered an inflammatory disorder, some of the associated conditions (e.g., neutropenia, pancreatitis and bone marrow dysfunction) may involve inflammation or immune system dysfunctions. We have already demonstrated that signal transducer and activator of transcription (STAT)-3 and mammalian target of rapamycin (mTOR) were hyperactivated and associated with elevated IL-6 levels in SDS leukocytes. In this study, we analyzed the level of phosphoproteins involved in STAT3 and mTOR pathways in SDS lymphoblastoid cells (LCLs) and the secretomic profile of soluble pro-inflammatory mediators in SDS plasma and LCLs in order to investigate the systemic inflammation in these patients and relative pathways.

Methods: Twenty-six SDS patients and seven healthy donors of comparable age were recruited during the programmed follow-up visits for clinical evaluation at the Verona Cystic Fibrosis Center Human. The obtained samples (plasma and/or LCLs) were analyzed for: phosphoproteins, cytokines, chemokines and growth factors levels by Bio-plex technology; microRNAs profiling by next generation sequencing (NGS) and microRNAs expression validation by Real Time-PCR (RT-PCR) and droplet digital PCR (ddPCR) .

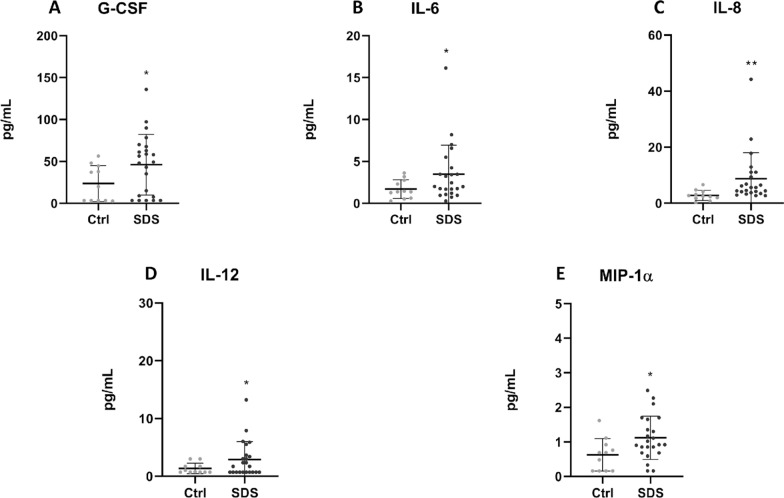
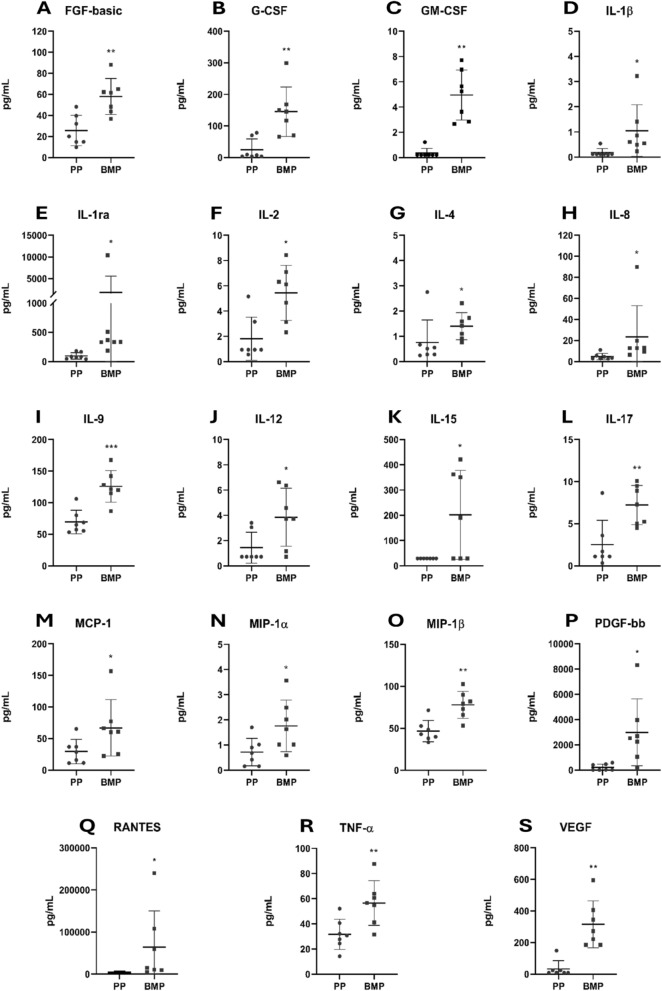
Results: We demonstrated dysregulation of ERK1/2 and AKT phosphoproteins in SDS, as their involvement in the hyperactivation of the STAT3 and mTOR pathways confirmed the interplay of these pathways in SDS pathophysiology. However, both these signaling pathways are strongly influenced by the inflammatory environment. Here, we reported that SDS is characterized by elevated plasma levels of several soluble proinflammatory mediators. In vitro experiments show that these pro-inflammatory genes are closely correlated with STAT3/mTOR pathway activation. In addition, we found that miR-181a-3p is down-regulated in SDS. Since this miRNA acts as a regulator of several pro-inflammatory pathways such as STAT3 and ERK1/2, its down-regulation may be a driver of the constitutive inflammation observed in SDS patients.

Conclusions: The results obtained in this study shed light on the complex pathogenetic mechanism underlying bone marrow failure and leukemogenesis in SDS, suggesting the need for anti-inflammatory therapies for SDS patients.

Keywords: Acute myeloid leukemia; Inflammation; Shwachman-Diamond Syndrome; mTOR.


Conflict of interest statement

Declarations. Ethics approval and consent to participate: This study was approved by the Ethics Committee of Azienda Ospedaliera Universitaria Integrata (Verona, Italy: approval No. 4182 CESC). Informed consent was obtained from participants or their legal representatives. Consent for publication: All the authors agree to publish. Competing interests: The authors declare no competing interests.

Figures

Fig. 1
Fig. 1
Analysis of phosphoproteins in LCLs obtained from SDS and healthy donors. LCLs from SDS patients or from healthy control subjects were cultured with the same culture length and passages in RPMI-1640 medium supplemented with 10% FBS. Successively, cells protein extracts were used to perform Phospho-Flow (A) and Luminex® xMap® (B) assays. (A): After fixation and permeabilization, cells were stained with specific PE-conjugated antibody against mTOR (S2448) or STAT3 (Y705 or S727). Flow cytometry analysis was then performed. Isotype PE-conjugated antibody was employed as negative control. The graphs on the left are representative of a Phospho-Flow analysis performed on LCLs obtained from a SDS patient (UPN26) compared with a healthy donor (CTL). The histogram on the right shows the fold-change, relative to healthy controls, of the normalized median fluorescence intensity (MFI) of mTOR (S2448, n = 9) and STAT3 (Y705 and S727, n = 6 each) in LCL from SDS patients (UPN26, UPN37, UPN75, black bars) and healthy donors (light grey bars). (B): The histograms show, for each analyte, the MFI ± SEM values of the phosphorylated protein on the total (MFI Phospho/Total Ratio) detected in healthy donors (light grey bars, n = 6) and SDS (black bars, n = 10) derived samples. The phosphoproteins analyzed are AKT and ERK1/2. The phosphorylated residue detected is indicated in parentheses next to each protein. * = p < 0.05; ** = p < 0.01; *** = p < 0.001
Fig. 2
Fig. 2
Expression profile of cytokines and chemokines in plasmas obtained from peripheral blood of healthy subjects and SDS patients. The scatter plots show the concentration, in pg/mL (mean ± SD), of the 5 analytes for which the difference between WT- (white bars, n = 11) and SDS- (grey bars, n = 23) derived samples was statistically significant: GCS-F (A), IL-6 (B), IL-8 (C), IL-12 (D), MIP-1α (E). Analyses by Luminex® xMap® technology. * = p < 0.05; ** = p < 0.01
Fig. 3
Fig. 3
Expression profile of cytokines and chemokines in plasma obtained from peripheral and bone marrow blood of SDS patients. The scatter plots display the concentration, measured in pg/mL (mean ± SD), of 19 analytes whose levels differed significantly between peripheral blood plasma (PP, grey dots, n = 7) and bone marrow blood plasma (BMP, grey squares, n = 7) of SDS patients: FGF basic (A), G-CSF (B), GM-CSF (C), IL-1β (D), IL-1ra (E), IL-2 (F), IL-4 (G), IL-8 (H), IL-9 (I), IL-12 (J) IL-15 (K), IL-17 (L), MCP-1 (M), MIP-1α (N), MIP-1β (O), PDGF-bb (P), RANTES (Q), TNF-α (R), VEGF (S). Analyses by Luminex® xMap® technology. * = p < 0.05; ** = p < 0.01; *** = p < 0.001
Fig. 4
Fig. 4
Release of cytokines and chemokines by LCLs isolated from healthy subjects and SDS patients. The scatter plots show the concentration, in pg/mL (mean ± SEM), of the 6 analytes for which the difference between Ctrl- (light grey dots, n = 4) and SDS- (grey dots, n = 7) derived samples was statistically significant: eotaxin (A), GM-CSF (B), IL-6 (C), IL-13 (D), IL-15 (E), RANTES (F). Analyses by Luminex® xMap® technology. * = p < 0.05; ** = p < 0.01
Fig. 5
Fig. 5
Effects of everolimus on the secretion of soluble inflammatory factors by LCLs. The scatter plots show the concentration, measured in pg/mL (mean ± SEM), of 20 analytes whose levels significantly differ in the supernatants of SDS-derived LCLs treated with everolimus 350 nM (Eve, grey dots, n = 6) or not treated (NT, light grey dots, n = 6): eotaxin (A), FGF basic (B), GM-CSF (C), IL-1β (D), IL-1ra (E), IL-2 (F), IL-4 (G), IL-5 (H), IL-6 (I), IL-8 (J), IL-9 (K) IL-10 (L), IL-13 (M), IL-17 (N), IP-10 (O), MCP-1 (P), MIP-1α (Q), MIP-1β (R), RANTES (S), TNF-α (T). Analyses by Luminex® xMap® technology. * = p < 0.05
Fig. 6
Fig. 6
Differential expression levels of miRNAs obtained by NGS miRNome analysis and droplet digital RT-PCR validation. Heatmap (A) and expression fold-change levels (B) of microRNA in healthy lymphoblastoid cells (Ctrl) versus lymphoblastoid cells derived from SDS patients (SDS). Data showed microRNAs with fold change FC > 1.5. Green = down-regulation; red = up-regulation. (C) ddPCR, comparing control healthy cells and SDS cells in relation to the content of significantly dysregulated miRNA. * = p < 0.05

References

    1. Aksamitiene E, Kiyatkin A, Kholodenko BN. Cross-talk between mitogenic Ras/MAPK and survival PI3K/Akt pathways: a fine balance. Biochem Soc Trans. 2012;40(1):139–46. 10.1042/BST20110609. - PubMed
    1. Alfaro C, Sanmamed MF, Rodríguez-Ruiz ME, Teijeira Á, Oñate C, et al. Interleukin-8 in cancer pathogenesis, treatment and follow-up. Cancer Treat Rev. 2017;60:24–31. 10.1016/j.ctrv.2017.08.004. - PubMed
    1. Assmann JLJC, Leon LG, Stavast CJ, van den Bogaerdt SE, Schilperoord-Vermeulen J, et al. miR-181a is a novel player in the STAT3-mediated survival network of TCRαβ+ CD8+ T large granular lymphocyte leukemia. Leukemia. 2022;36(4):983–93. 10.1038/s41375-021-01480-2. - PMC - PubMed
    1. Baggiolini M, Clark-Lewis I. Interleukin-8, a chemotactic and inflammatory cytokine. FEBS Lett. 1992;307(1):97–101. 10.1016/0014-5793(92)80909-z. - PubMed
    1. Bakouny Z, Choueiri TK. IL-8 and cancer prognosis on immunotherapy. Nat Med. 2020;26(5):650–1. 10.1038/s41591-020-0873-9. - PubMed

LinkOut - more resources