. 2025 Feb 28;22(1):57.
doi: 10.1186/s12974-025-03389-4.

Prenatal inflammation exacerbates hyperoxia-induced neonatal brain injury

Affiliations

Prenatal inflammation exacerbates hyperoxia-induced neonatal brain injury

Meray Serdar et al. J Neuroinflammation. .

Abstract

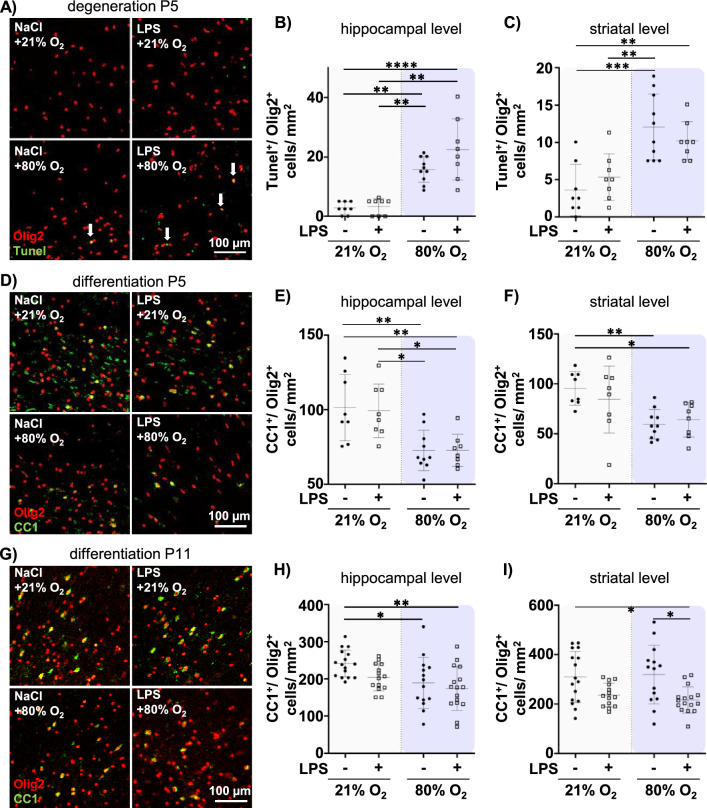
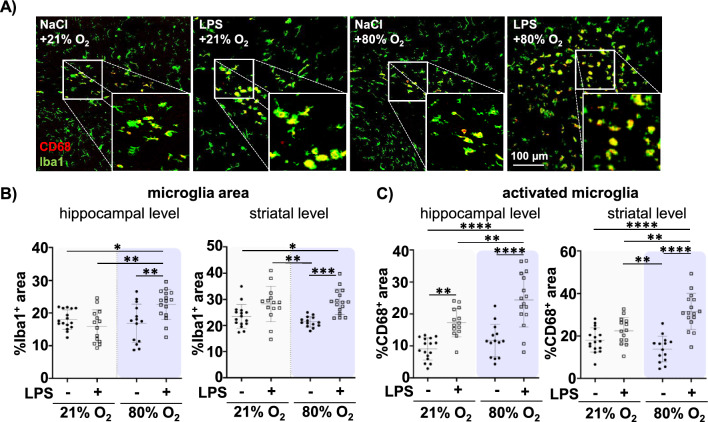
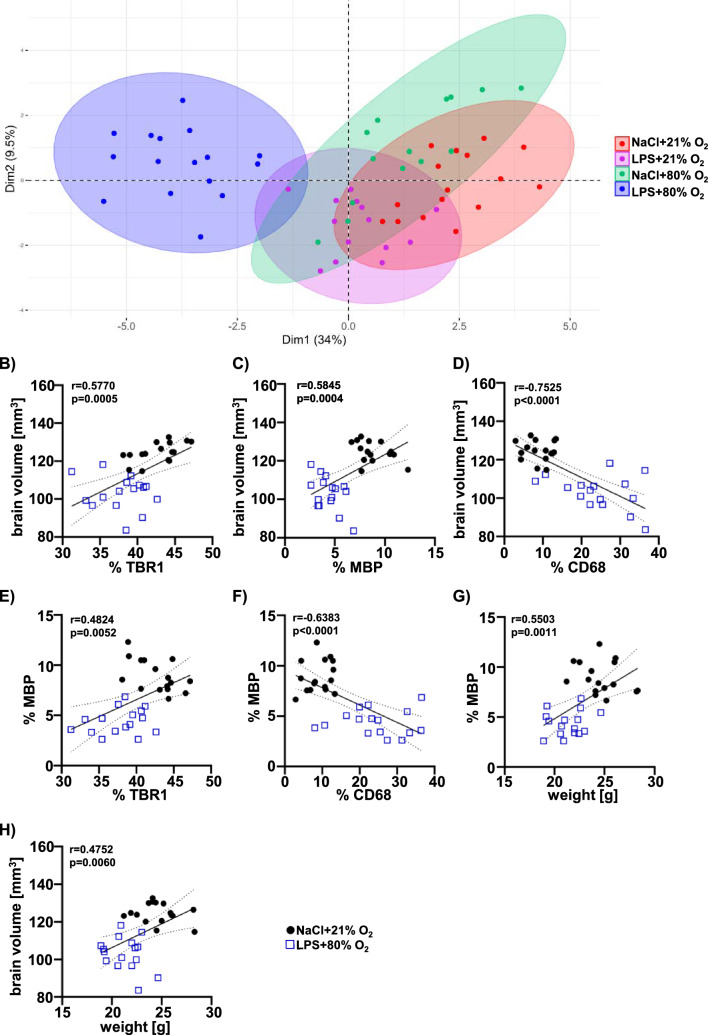
Background: Premature born infants are at high risk to develop white matter injury (WMI). Hyperoxia and perinatal inflammation are main risk factors for preterm birth and associated brain injury. To date the majority of experimental studies have focused on isolated insults. However, clinically, WMI injury is a multifactorial disorder caused by a variety of triggers. To establish a clinically relevant rodent model of WMI, we combined prenatal inflammation with postnatal hyperoxia to investigate individual, and additive or synergistic effects on inflammatory processes, myelination and grey matter development.

Methods: At embryonic day 20, pregnant Wistar rat dams received either a single intraperitoneal injection of 100 µg/ kg lipopolysaccharide (LPS) or sodium chloride. Offspring were either exposed to hyperoxia (80% O2) or normoxia (21% O2) from postnatal day 3 to 5. Animals were sacrificed immediately after hyperoxia or 6 days later, corresponding to term-equivalent age. White and grey matter development and neuroinflammatory responses were investigated at cellular and molecular levels applying immunohistochemistry, western blotting, real time PCR in brain tissues and multiplex protein expression analysis on serum samples.

Results: Prenatal inflammation combined with postnatal hyperoxia resulted in reduced body weight and length in the offspring, accompanied by increased serum leptin levels at term equivalent age. The altered body parameters, like body weight, were associated with decreased brain volume, thinning of deep cortical layers and hypomyelination. As potential underlying mechanisms, we identified severe myelination deficits and an increased microglia activation associated with elevated inflammatory cytokine expression in brain tissues, while peripheral cytokine levels were reduced. Interestingly, effects on body size were mainly mediated by prenatal LPS, independent of hyperoxia, while oligodendrocyte degeneration was mainly induced by postnatal hyperoxia, independent of prenatal inflammation. However, for the majority of pathological changes, including brain size, myelination deficits, microglia activation and inflammatory cytokine expression, additive or synergistic effects were detected.

Conclusion: Prenatal inflammation combined with postnatal hyperoxia results in aggravated myelination deficits and inflammatory responses compared to single insults, making it an ideal model to improve our understanding of the complex pathophysiology underlying WMI and to evaluate urgently needed therapies.

Keywords: Cytokines; Microglia; Neuroinflammation; Oligodendrocytes; Postnatal hyperoxia; Prenatal inflammation; Preterm birth; White matter injury.


Conflict of interest statement

Declarations. Ethics approval and consent to participate: Animal experiments were performed in accordance with the Animal Research Reporting of in Vivo Experiments (ARRIVE) guidelines with governmental approval by the State Agency for Nature, Environment and Consumer Protection North Rhine-Westphalia. Consent for publication: Not applicable. Competing interests: The authors declare no competing interests.

Figures

Fig. 1
Fig. 1
Prenatal inflammation combined with postnatal hyperoxia leads to growth restriction and disturbed metabolism. A Experimental setup (created wit BioRender): Dams received a single intraperitoneal (i.p.) injection of 100 µg/ kg LPS or NaCl at embryonic day 20 (E20). Newborn pups were exposed to normoxia (21% O2) or hyperoxia (80% O2) for 48 h from postnatal day P3 to P5. Analyses were performed either immediately after hyperoxia at P5 or at term-equivalent age at P11. B Alterations in dam weight was recorded within 24 h after LPS application (n = 4–5 dams/ group). CE) The offspring’s body weight was recorded daily and is shown here for relevant ages P0, P5 and P11. F At P11 the body length (head to tail) was measured. G Leptin protein levels were analysed in serum samples by multiplex protein expression analyses. n = 8–10 rats/group at P5, n = 14–16 rats/group at P11. *p < 0.05, **p < 0.01, ***p < 0.001
Fig. 2
Fig. 2
The combination of prenatal inflammation and postnatal hyperoxia leads to a reduced brain volume and deep cortical layer thinning at P11. After prenatal inflammation at E20 pups were exposed to postnatal normoxia (21% O2) or hyperoxia (80% O2) from P3 to P5 and analysed at P11. A, B Hemisphere volume were determined on cresyl-violet stained sections taken from bregma level − 4.1 ± 0.2 to − 0.5 ± 0.2 mm with a distance of 140 µm between sections. C Cortical thickness of layer V and VI was analysed in TBR1 stained tissue sections. White boxes illustrate the deep cortical layer V–VI depicted on the right side. D, E The ratio of the TBR1 positive deep cortical layer related to the whole hemisphere area was quantified at the hippocampal (3.72 ± 0.7 mm, D) and striatal (− 0.6 ± 0.3 mm, E) level. n = 14–16 rats/ group. *p < 0.05, ***p < 0.001, ****p < 0.0001
Fig. 3
Fig. 3
Prenatal inflammation and postnatal hyperoxia have a different impact on the number of degenerating and mature oligodendrocytes in a time point- and region-specific manner. Pups from dams with prenatal inflammation and additionally exposed to postnatal normoxia (21% O2) or hyperoxia (80% O2) at P3 for 48 h were analysed immediately after hyperoxia at P5 or at term-equivalent age at P11. A Oligodendrocyte degeneration was assessed in Olig2 (red)/ Tunel (green) co-staining at P5. Arrows indicate Olig2/ Tunel co-localizations (yellow). B, C The number of double positive cells was analysed in the white matter at the hippocampal (3.72 ± 0.7 mm, B) and striatal (− 0.6 ± 0.3 mm, C) level. DI The number of mature oligodendrocytes was analysed in tissue sections stained for Olig2 (red) and CC1 (green). Olig2/ CC1 double positive cells were quantified at P5 (E, F) and P11 (H, I). Example images in A, D and G are derived from the cingulum of the white matter region (Suppl. Figure 1). n = 8–10 rats/group at P5, n = 14–16 rats/group at P11. *p < 0.05, **p < 0.01, ***p < 0.001
Fig. 4
Fig. 4
The double-hit of prenatal inflammation and postnatal hyperoxia induces pronounced myelination deficits associated with structural changes. Myelination was analysed at term equivalent age P11, i.e. 6 days after postnatal normoxia (21% O2) or hyperoxia (80% O2) via immunohistochemistry and real time PCR. A Representative images of MBP (myelin basic protein) staining (upper: immunohistochemistry MBP-staining; lower: sum density MBP-staining). B The MBP positive area related to the whole hemisphere area was analysed at the hippocampal (3.72 ± 0.7 mm) and the striatal level (− 0.6 ± 0.3 mm). C The same images were used to analyse the sum pixel density of MBP staining normalized to the hemisphere. D mRNA expression of MAG and CNPase from whole hemisphere was quantified by RT-PCR. E Representative images in are derived from the deep cortical white matter and the appropriate skeletonized pictures. F Structural formation of MBP fibre was evaluated using by the adapted DiameterJ plug Image J enabling skeletonization of images from MBP staining (E). The fibre length was quantified in 3 ROIs of the white matter (Suppl. Figure 1). n = 14–16 rats/ group. Scale bar (white) 1000 µm and scale bar (black) 100 µm. *p < 0.05, **p < 0.01, ****p < 0.0001
Fig. 5
Fig. 5
Prenatal inflammation combined with postnatal hyperoxia lead to microglia activation at P11. Prenatal inflammation was induced at E20 followed by postnatal normoxia (21% O2) or hyperoxia (80% O2) at P3 for 48 h and brains were investigated at P11. A Microglia activation was analysed by CD68 (red) / Iba1 (green) co-staining in three regions of white matter (Suppl. Figure 6C); representative images are derived from cingulum White boxes reveal high magnification images of the staining to show morphological changes. B As a measure of microglia density the percentage of Iba1 positive area was quantified in the white matter of the hippocampal (3.72 ± 0.7 mm, left) and striatal level (−0.6 ± 0.3 mm, right). C Activation of microglia was assessed by quantification of the percentage of CD68 positive area from the total Iba1 positive area in hippocampal (left) and striatal level (right). n = 14–16 rats/ group, *p < 0.05, **p < 0.01, ***p < 0.001, ****p < 0.0001
Fig. 6
Fig. 6
The double hit of prenatal inflammation plus postnatal hyperoxia leads to pronounced changes in inflammatory cytokine levels in the brain and the circulation at P11. After LPS application at E20 pups underwent normoxia (21% O2) or hyperoxia (80% O2) at P3 for 48 h. Analysis was performed at term equivalent age P11. A, B mRNA expression of pro- (IL6, TNFα) and anti-inflammatory (IL4, IL10) cytokines was analysed in brain tissue lysates. C, D Serum samples were analysed by multiplex protein expression analysis. n = 14–16 rats/ group for A and B, n = 8–10 rats/ group for C and D. *p < 0.05, **p < 0.01, ***p < 0.001, ****p < 0.0001
Fig. 7
Fig. 7
Pups exposed to prenatal inflammation plus postnatal hyperoxia clearly separate from single insults and controls. To visualise overlapping and combinational effects of the investigated noxious insults postnatal hyperoxia (80% O2) and prenatal LPS injection, a principal component analysis (PCA) was performed based on 21 parameters (sex, weight P5, weight P11, body length, brain volume, MAG protein level, MAG gene level, IL6, TNFα, IL10, IL4; hippocampal and striatal level: % MBP, sum density MBP, % CD68, % Iba1, fibre length, intersection, % TBR1; serum: leptin, IL6, TNFα, IL10, and IL4). n = 14–16 rats/ group. B-H) Based on body weight and histological data (hippocampal level) at term-equivalent age (P11), correlation analyses were performed for key features of WMI injury, i.e. body weight, brain volume, cortical thickness (%TBR1), myelination (%MBP) and microglial activation (%CD68). Correlation coefficients (r) and p-values are indicated in the graphs. n = 16 rats/ group

References

    1. Howson CP, et al. Born too soon: preterm birth matters. Reprod Health. 2013;10(Suppl1):S1. - PMC - PubMed
    1. Keller M, et al. Policy benchmarking report on neonatal health and social policies in 13 European countries. Acta Paediatr. 2010;99(11):1624–9. - PubMed
    1. Wood NS, et al. Neurologic and developmental disability after extremely preterm birth. EPICure Study Group. N Engl J Med. 2000;343(6):378–84. - PubMed
    1. Doyle LW, Anderson PJ. Adult outcome of extremely preterm infants. Pediatrics. 2010;126(2):342–51. - PubMed
    1. Back SA, Miller SP. Brain injury in premature neonates: a primary cerebral dysmaturation disorder? Ann Neurol. 2014;75(4):469–86. - PMC - PubMed

Substances

LinkOut - more resources